California's 14th congressional district
California's 14th congressional district is a congressional district in the U.S. state of California.
| California's 14th congressional district | |||
|---|---|---|---|
.tif.png) California's 14th congressional district since January 3, 2013 | |||
| Representative |
| ||
| Median income | $117,054[1] | ||
| Ethnicity | |||
| Cook PVI | D+27[3] | ||
Jackie Speier, a Democrat, has represented the district since January 2013.
Currently, it contains most of San Mateo County and a sliver of southwestern San Francisco. Cities in the district include Belmont, Brisbane, Burlingame, Colma, Daly City, East Palo Alto, El Granada, Foster City, Half Moon Bay, Hillsborough, Millbrae, Montara, Moss Beach, Pacifica, San Bruno, San Carlos, San Mateo, South San Francisco, and part of Redwood City.[4]
From 1993 to 2013, the 14th district lay farther south, comprising portions of San Mateo, Santa Clara, and Santa Cruz counties. Cities in the district included Mountain View, Sunnyvale, Menlo Park, Palo Alto, Half Moon Bay, and Scotts Valley. According to a 2006 report, the district was the third wealthiest in the nation.[5] Since redistricting by the California Citizens Redistricting Commission of 2011, most of that district is now the 18th District, while the current 14th covers most of what was the 12th District.
History
Recent election results from statewide races
| Year | Office | Results |
|---|---|---|
| 1992 | President | Clinton 53.5 – 26.7 |
| Senator | Boxer 59.5 – 32.2 | |
| Senator | Feinstein 65.9 – 29.1% | |
| 1994 | Governor[6] | Brown 49.1 – 46.8 |
| Senator[7] | Feinstein 63.3 – 30.5% | |
| 1996 | President[8] | B. Clinton 57.8 – 30.8% |
| 1998 | Governor[9] | Davis 65.8 – 30.3 |
| Senator[10] | Boxer 60.8 – 36% | |
| 2000 | President[11] | Gore 62.2 – 32.2 |
| Senator[12] | Feinstein 60.8 – 33.2% | |
| 2002 | Governor[13] | Davis 54.9 – 38.3% |
| 2003 | Recall[14][15] | No 61.9 – 38.1 |
| Bustamante 43.1 – 36.4% | ||
| 2004 | President[16] | Kerry 67.6 – 28.6 |
| Senator[17] | Boxer 68.3 – 27.5% | |
| 2006 | Governor[18] | Schwarzenegger 50.9 – 42.7 |
| Senator[19] | Feinstein 72.2 – 22.1% | |
| 2008 | President[20] | Obama 73.1 – 24.9% |
| 2010 | Governor[21] | Brown 63.9 – 32.7 |
| Senator[22] | Boxer 65.5 – 30.3% | |
| 2012 | President | Obama 74.2 – 23.6 |
| Senator | Feinstein 79.3 – 20.7% | |
| 2014 | Governor | Brown 77.5 – 22.5% |
| 2016 | President | H. Clinton 76.9 – 18.2 |
| Senator | Harris 70.9 – 29.1% | |
| 2018 | Governor | Newsom 76.0 – 24.0 |
| Senator | Feinstein 63.5 – 36.5% |
List of members representing the district
| Member | Party | Dates | Cong ress(es) |
Electoral history | Counties |
|---|---|---|---|---|---|
| District created | March 4, 1933 | ||||
| Thomas F. Ford | Democratic | March 4, 1933 – January 3, 1945 |
73rd 74th 75th 76th 77th 78th |
[data unknown/missing] Retired. |
1933 – 1953 Los Angeles |
 Helen Gahagan Douglas |
Democratic | January 3, 1945 – January 3, 1951 |
79th 80th 81st |
[data unknown/missing] Retired to run for U.S. Senator. | |
 Sam Yorty |
Democratic | January 3, 1951 – January 3, 1953 |
82nd | [data unknown/missing] Redistricted to the 26th district. | |
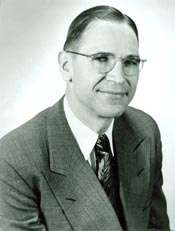
 Harlan Hagen |
Democratic | January 3, 1953 – January 3, 1963 |
83rd 84th 85th 86th 87th |
[data unknown/missing] Redistricted to the 18th district. |
1953 – 1963 Kern, Kings, Tulare |
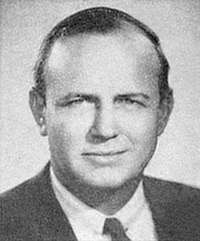
 John F. Baldwin Jr. |
Republican | January 3, 1963 – March 9, 1966 |
88th 89th |
Redistricted from the 6th district. Died. |
1963 – 1975 Contra Costa |
| Vacant | March 9, 1966 – June 7, 1966 | ||||
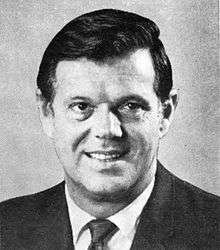 Jerome Waldie |
Democratic | June 7, 1966 – January 3, 1975 |
89th 90th 91st 92nd 93rd |
Elected to finish Baldwin's term. Retired to run for Governor of California. | |
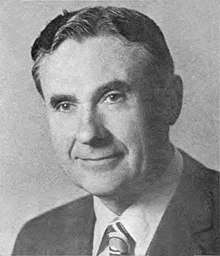 John J. McFall |
Democratic | January 3, 1975 – December 31, 1978 |
94th 95th |
Redistricted from the 15th district. Lost re-election and resigned. |
1975 – 1983 Alameda, Amador, Calaveras, El Dorado, Mono, San Joaquin, Stanislaus, Tuolumne |
| Vacant | December 31, 1978 – January 3, 1979 | ||||
 Norman D. Shumway |
Republican | January 3, 1979 – January 3, 1991 |
96th 97th 98th 99th 100th 101st |
[data unknown/missing] Retired. | |
| 1983 – 1993 Alpine, Amador, El Dorado, Lassen, Modoc, Nevada, Placer, Plumas, San Joaquin, Sierra | |||||
 John Doolittle |
Republican | January 3, 1991 – January 3, 1993 |
102nd | [data unknown/missing] Redistricted to the 4th district. | |
 Anna Eshoo |
Democratic | January 3, 1993 – January 3, 2013 |
103rd 104th 105th 106th 107th 108th 109th 110th 111th 112th |
[data unknown/missing] Redistricted to the 18th district. |
1993 – 2003 San Mateo, northwestern Santa Clara |
| 2003 – 2013 Southern San Mateo, northwestern Santa Clara, Santa Cruz | |||||
 Jackie Speier |
Democratic | January 3, 2013 – present |
113th 114th 115th 116th |
Redistricted from the 12th district. | 2013 – Present San Mateo, southwestern San Francisco |
Election results
|
1932 • 1934 • 1936 • 1938 • 1940 • 1942 • 1944 • 1946 • 1948 • 1950 • 1952 • 1954 • 1956 • 1958 • 1960 • 1962 • 1964 • 1966 (Special) • 1966 • 1968 • 1970 • 1972 • 1974 • 1976 • 1978 • 1980 • 1982 • 1984 • 1986 • 1988 • 1990 • 1992 • 1994 • 1996 • 1998 • 2000 • 2002 • 2004 • 2006 • 2008 • 2010 • 2012 • 2014 • 2016 • 2018 |
1932
| Party | Candidate | Votes | % | ||
|---|---|---|---|---|---|
| Democratic | Thomas F. Ford | 47,368 | 57.1 | ||
| Republican | William D. Campbell | 35,598 | 42.9 | ||
| Total votes | 82,966 | 100.0 | |||
| Turnout | |||||
| Democratic win (new seat) | |||||
1934
| Party | Candidate | Votes | % | |
|---|---|---|---|---|
| Democratic | Thomas F. Ford (Incumbent) | 52,761 | 61.0 | |
| Republican | William D. Campbell | 33,945 | 37.1 | |
| Progressive | Lyndon R. Foster | 2,487 | 2.7 | |
| Socialist | Harry Sherr | 1,130 | 1.2 | |
| Communist | Lawrence Ross | 1,086 | 1.2 | |
| Total votes | 91,409 | 100.0 | ||
| Turnout | ||||
| Democratic hold | ||||
1936
| Party | Candidate | Votes | % | |
|---|---|---|---|---|
| Democratic | Thomas F. Ford (Incumbent) | 63,365 | 61.0 | |
| Republican | William D. Campbell | 25,497 | 24.6 | |
| Progressive | Albert L. Johnson | 12,874 | 12.4 | |
| Communist | Harold J. Ashe | 1,329 | 1.3 | |
| Socialist | Glen Trimble | 770 | 0.7 | |
| Total votes | 103,855 | 100.0 | ||
| Turnout | ||||
| Democratic hold | ||||
1938
| Party | Candidate | Votes | % | |
|---|---|---|---|---|
| Democratic | Thomas F. Ford (Incumbent) | 67,588 | 68.3 | |
| Republican | William D. Campbell | 31,375 | 31.7 | |
| Total votes | 98,963 | 100.0 | ||
| Turnout | ||||
| Democratic hold | ||||
1940
| Party | Candidate | Votes | % | |
|---|---|---|---|---|
| Democratic | Thomas F. Ford (Incumbent) | 73,137 | 64.3 | |
| Republican | Herbert L. Herberts | 37,939 | 33.3 | |
| Communist | Pettis Perry | 2,732 | 2.4 | |
| Total votes | 113,808 | 100.0 | ||
| Turnout | ||||
| Democratic hold | ||||
1942
| Party | Candidate | Votes | % | |
|---|---|---|---|---|
| Democratic | Thomas F. Ford (Incumbent) | 49,326 | 67 | |
| Republican | Herbert L. Herberts | 24,349 | 33 | |
| Total votes | 73,675 | 100 | ||
| Turnout | ||||
| Democratic hold | ||||
1944
| Party | Candidate | Votes | % | |
|---|---|---|---|---|
| Democratic | Helen Gahagan Douglas | 65,729 | 51.6 | |
| Republican | William D. Campbell | 61,767 | 48.4 | |
| Total votes | 127,496 | 100.0 | ||
| Turnout | ||||
| Democratic hold | ||||
1946
| Party | Candidate | Votes | % | |
|---|---|---|---|---|
| Democratic | Helen Gahagan Douglas (Incumbent) | 53,536 | 54.4 | |
| Republican | Frederick M. Roberts | 44,914 | 45.6 | |
| Total votes | 98,450 | 100.0 | ||
| Turnout | ||||
| Democratic hold | ||||
1948
| Party | Candidate | Votes | % | |
|---|---|---|---|---|
| Democratic | Helen Gahagan Douglas (Incumbent) | 89,581 | 65.3 | |
| Republican | W. Wallace Braden | 44,611 | 32.5 | |
| Progressive | Sidney Moore | 2,904 | 2.2 | |
| Total votes | 137,096 | 100.0 | ||
| Turnout | ||||
| Democratic hold | ||||
1950
| Party | Candidate | Votes | % | |
|---|---|---|---|---|
| Democratic | Sam Yorty | 47,653 | 49.4 | |
| Republican | Jack W. Hardy | 35,543 | 36.8 | |
| Progressive | Charlotta A. Bass | 13,364 | 13.8 | |
| Total votes | 96,560 | 100.0 | ||
| Turnout | ||||
| Democratic hold | ||||
1952
| Party | Candidate | Votes | % | |||
|---|---|---|---|---|---|---|
| Democratic | Harlan Hagen | 70,809 | 51 | |||
| Republican | Thomas H. Werdel (Incumbent) | 68,011 | 49 | |||
| Total votes | 138,820 | 100 | ||||
| Turnout | ||||||
| Democratic gain from Republican | ||||||
1954
| Party | Candidate | Votes | % | |
|---|---|---|---|---|
| Democratic | Harlan Hagen | 75,194 | 65 | |
| Republican | Al Blain | 40,270 | 35 | |
| Total votes | 115,464 | 100 | ||
| Turnout | ||||
| Democratic hold | ||||
1956
| Party | Candidate | Votes | % | |
|---|---|---|---|---|
| Democratic | Harlan Hagen (Incumbent) | 94,461 | 63 | |
| Republican | Myron F. Tisdel | 55,509 | 37 | |
| Total votes | 149,970 | 100 | ||
| Turnout | ||||
| Democratic hold | ||||
1958
| Party | Candidate | Votes | % | |
|---|---|---|---|---|
| Democratic | Harlan Hagen (Incumbent) | 120,347 | 100.0 | |
| Turnout | ||||
| Democratic hold | ||||
1960
| Party | Candidate | Votes | % | |
|---|---|---|---|---|
| Democratic | Harlan Hagen (Incumbent) | 97,026 | 56.5 | |
| Republican | G. Ray Arnett | 74,800 | 43.5 | |
| Total votes | 171,826 | 100.0 | ||
| Turnout | ||||
| Democratic hold | ||||
1962
| Party | Candidate | Votes | % | |
|---|---|---|---|---|
| Republican | John F. Baldwin Jr. (Incumbent) | 99,040 | 62.9 | |
| Democratic | Charles R. Weidner | 58,469 | 37.1 | |
| Total votes | 157,509 | 100.0 | ||
| Turnout | ||||
| Republican hold | ||||
1964
| Party | Candidate | Votes | % | |
|---|---|---|---|---|
| Republican | John F. Baldwin Jr. (Incumbent) | 117,272 | 64.9 | |
| Democratic | Russell M. Koch | 63,469 | 35.1 | |
| Total votes | 180,741 | 100.0 | ||
| Turnout | ||||
| Republican hold | ||||
1966 (Special)
| Party | Candidate | Votes | % | |||
|---|---|---|---|---|---|---|
| Democratic | Jerome R. Waldie | 53.7 | ||||
| Republican | Frank J. Newman | 31.2 | ||||
| Republican | John A. Richardson | 10.5 | ||||
| Democratic | Leo Antonio Costa | 4.3 | ||||
| Republican | Dooris G. "Duke" Johnston | 1.6 | ||||
| Republican | Tallak B. Wralstad | 1.2 | ||||
| Total votes | 100.0 | |||||
| Turnout | ||||||
| Democratic gain from Republican | ||||||
1966
| Party | Candidate | Votes | % | |
|---|---|---|---|---|
| Democratic | Jerome R. Waldie (Incumbent) | 108,668 | 56.4 | |
| Republican | Frank J. Newman | 83,878 | 43.6 | |
| Total votes | 192,546 | 100.0 | ||
| Turnout | ||||
| Democratic hold | ||||
1968
| Party | Candidate | Votes | % | |
|---|---|---|---|---|
| Democratic | Jerome R. Waldie (Incumbent) | 152,500 | 71.6 | |
| Republican | David W. Schuh | 56,598 | 26.6 | |
| American Independent | Luis W. Hamilton | 3,945 | 1.9 | |
| Total votes | 213,043 | 100.0 | ||
| Turnout | ||||
| Democratic hold | ||||
1970
| Party | Candidate | Votes | % | |
|---|---|---|---|---|
| Democratic | Jerome R. Waldie (Incumbent) | 148,655 | 74.5 | |
| Republican | Byron D. Athan | 50,750 | 25.5 | |
| Total votes | 199,405 | 100.0 | ||
| Turnout | ||||
| Democratic hold | ||||
1972
| Party | Candidate | Votes | % | |
|---|---|---|---|---|
| Democratic | Jerome R. Waldie (Incumbent) | 158,948 | 77.6 | |
| Republican | Floyd E. Sims | 45,985 | 22.4 | |
| Total votes | 204,933 | 100.0 | ||
| Turnout | ||||
| Democratic hold | ||||
1974
| Party | Candidate | Votes | % | |
|---|---|---|---|---|
| Democratic | John J. McFall (Incumbent) | 101,932 | 70.9 | |
| Republican | Charles M. "Chuck" Gibson | 34,679 | 24.1 | |
| American Independent | Roger A. Blaine | 7,367 | 4.9 | |
| Total votes | 143,978 | 100.0 | ||
| Turnout | ||||
| Democratic hold | ||||
1976
| Party | Candidate | Votes | % | |
|---|---|---|---|---|
| Democratic | John J. McFall (Incumbent) | 123,285 | 72.5 | |
| Republican | Roger A. Blaine | 46,674 | 27.5 | |
| Total votes | 169,959 | 100.0 | ||
| Turnout | ||||
| Democratic hold | ||||
1978
| Party | Candidate | Votes | % | |||
|---|---|---|---|---|---|---|
| Republican | Norman D. Shumway (Incumbent) | 95,962 | 53.4 | |||
| Democratic | John J. McFall (Incumbent) | 76,602 | 42.6 | |||
| American Independent | George Darold Waldron | 7,163 | 4.0 | |||
| Total votes | 179,727 | 100.0 | ||||
| Turnout | ||||||
| Republican gain from Democratic | ||||||
1980
| Party | Candidate | Votes | % | |
|---|---|---|---|---|
| Republican | Norman D. Shumway (Incumbent) | 133,979 | 60.7 | |
| Democratic | Ann Cerney | 79,883 | 36.2 | |
| Libertarian | Douglas G. Housley | 6,717 | 3.0 | |
| Total votes | 220,579 | 100.0 | ||
| Turnout | ||||
| Republican hold | ||||
1982
| Party | Candidate | Votes | % | |
|---|---|---|---|---|
| Republican | Norman D. Shumway (Incumbent) | 134,225 | 63.4 | |
| Democratic | Baron Reed | 77,400 | 36.6 | |
| Total votes | 211,625 | 100.0 | ||
| Turnout | ||||
| Republican hold | ||||
1984
| Party | Candidate | Votes | % | |
|---|---|---|---|---|
| Republican | Norman D. Shumway (Incumbent) | 179,238 | 73.3 | |
| Democratic | Ruth Paula Carlson | 58,384 | 23.9 | |
| Libertarian | Fred W. Colburn | 6,850 | 2.8 | |
| Total votes | 244,472 | 100.0 | ||
| Turnout | ||||
| Republican hold | ||||
1986
| Party | Candidate | Votes | % | |
|---|---|---|---|---|
| Republican | Norman D. Shumway (Incumbent) | 146,906 | 71.6 | |
| Democratic | Bill Steele | 53,597 | 26.1 | |
| Libertarian | Bruce A. Daniel | 4,658 | 2.3 | |
| Total votes | 205,161 | 100.0 | ||
| Turnout | ||||
| Republican hold | ||||
1988
| Party | Candidate | Votes | % | |
|---|---|---|---|---|
| Republican | Norman D. Shumway (Incumbent) | 173,876 | 62.6 | |
| Democratic | Patricia Malberg | 103,899 | 37.4 | |
| Total votes | 277,775 | 100.0 | ||
| Turnout | ||||
| Republican hold | ||||
1990
| Party | Candidate | Votes | % | |
|---|---|---|---|---|
| Republican | John Doolittle | 128,309 | 51.5 | |
| Democratic | Patricia Malberg | 120,742 | 48.5 | |
| Total votes | 249,051 | 100.0 | ||
| Turnout | ||||
| Republican hold | ||||
1992
| Party | Candidate | Votes | % | |||
|---|---|---|---|---|---|---|
| Democratic | Anna Eshoo | 146,873 | 56.7 | |||
| Republican | Tom Huening | 101,202 | 39.0 | |||
| Libertarian | Chuck Olson | 7,220 | 2.8 | |||
| Peace and Freedom | David Wald | 3,912 | 1.5 | |||
| No party | Sims (write-in) | 12 | 0.0 | |||
| No party | Maginnis (write-in) | 3 | 0.0 | |||
| Total votes | 259,232 | 100.0 | ||||
| Turnout | ||||||
| Democratic gain from Republican | ||||||
1994
| Party | Candidate | Votes | % | |
|---|---|---|---|---|
| Democratic | Anna Eshoo (Incumbent) | 130,713 | 60.60 | |
| Republican | Ben Brink | 78,475 | 39.40 | |
| Total votes | 199,188 | 100.0 | ||
| Turnout | ||||
| Democratic hold | ||||
1996
| Party | Candidate | Votes | % | |
|---|---|---|---|---|
| Democratic | Anna Eshoo (Incumbent) | 149,313 | 64.9 | |
| Republican | Ben Brink | 71,573 | 31.1 | |
| Peace and Freedom | Timothy Thompson | 3,653 | 1.6 | |
| Libertarian | Joseph Dehn | 3,492 | 1.5 | |
| Natural Law | Robert Wells | 2,144 | 0.9 | |
| Total votes | 230,175 | 100.0 | ||
| Turnout | ||||
| Democratic hold | ||||
1998
| Party | Candidate | Votes | % | |
|---|---|---|---|---|
| Democratic | Anna Eshoo (Incumbent) | 129,663 | 68.64 | |
| Republican | Chris Haugen | 53,719 | 28.44 | |
| Libertarian | Joseph W. Dehn III | 3,166 | 1.68 | |
| Natural Law | Anna Currivan | 2,362 | 1.25 | |
| Total votes | 188,910 | 100.0 | ||
| Turnout | ||||
| Democratic hold | ||||
2000
| Party | Candidate | Votes | % | |
|---|---|---|---|---|
| Democratic | Anna Eshoo (Incumbent) | 161,720 | 70.3 | |
| Republican | Bill Quraishi | 59,338 | 25.8 | |
| Libertarian | Joseph W. Dehn III | 4,715 | 2.0 | |
| Natural Law | John Black | 4,489 | 1.9 | |
| Total votes | 230,262 | 100.0 | ||
| Turnout | ||||
| Democratic hold | ||||
2002
| Party | Candidate | Votes | % | |
|---|---|---|---|---|
| Democratic | Anna Eshoo (Incumbent) | 117,055 | 68.2 | |
| Republican | Joe Nixon | 48,346 | 28.2 | |
| Libertarian | Andrew B. Carver | 6,277 | 3.6 | |
| Total votes | 171,678 | 100.0 | ||
| Turnout | ||||
| Democratic hold | ||||
2004
| Party | Candidate | Votes | % | |
|---|---|---|---|---|
| Democratic | Anna Eshoo (Incumbent) | 182,712 | 69.8 | |
| Republican | Chris Haugen | 69,564 | 26.6 | |
| Libertarian | Brian Holtz | 9,588 | 3.6 | |
| No party | Dennis Mitrzyk (write-in) | 24 | 0.0 | |
| Total votes | 262,088 | 100.0 | ||
| Turnout | ||||
| Democratic hold | ||||
2006
| Party | Candidate | Votes | % | |
|---|---|---|---|---|
| Democratic | Anna Eshoo (Incumbent) | 141,153 | 71.1 | |
| Republican | Rob Smith | 48,097 | 24.3 | |
| Libertarian | Brian Holtz | 4,692 | 2.3 | |
| Green | Carol Brouillet | 4,633 | 2.3 | |
| Total votes | 198,575 | 100.0 | ||
| Turnout | ||||
| Democratic hold | ||||
2008
| Party | Candidate | Votes | % | |
|---|---|---|---|---|
| Democratic | Anna Eshoo (Incumbent) | 141,623 | 70.1 | |
| Republican | Ronny Santana | 44,902 | 22.2 | |
| Libertarian | Brian Holtz | 8,670 | 4.2 | |
| Green | Carol Brouillet | 7,090 | 3.5 | |
| Total votes | 202,285 | 100.0 | ||
| Turnout | ||||
| Democratic hold | ||||
2010
| Party | Candidate | Votes | % | |
|---|---|---|---|---|
| Democratic | Anna Eshoo (Incumbent) | 151,217 | 69.09 | |
| Republican | Dave Chapman | 60,917 | 27.83 | |
| Libertarian | Paul Lazaga | 6,735 | 3.08 | |
| Total votes | 218,869 | 100.00 | ||
| Turnout | ||||
| Democratic hold | ||||
2012
| Party | Candidate | Votes | % | |
|---|---|---|---|---|
| Democratic | Jackie Speier | 203,828 | 79% | |
| Republican | Deborah (Debbie) Bacigalupi | 54,455 | 21% | |
| Total votes | 258,283 | 100.00% | ||
| Democratic hold | ||||
2014
| Party | Candidate | Votes | % | |
|---|---|---|---|---|
| Democratic | Jackie Speier | 114,389 | 77% | |
| Republican | Robin Chew | 34,757 | 23% | |
| Total votes | 149,146 | 100.00% | ||
| Democratic hold | ||||
2016
| Party | Candidate | Votes | % | |
|---|---|---|---|---|
| Democratic | Jackie Speier | 231,630 | 81% | |
| Republican | Angel Cardenas | 54,817 | 19% | |
| Total votes | 286,447 | 100% | ||
| Democratic hold | ||||
2018
| Party | Candidate | Votes | % | |
|---|---|---|---|---|
| Democratic | Jackie Speier | 211,384 | 79% | |
| Republican | Cristina Osmeña | 55,439 | 20% | |
| Total votes | 266,823 | 100% | ||
| Democratic hold | ||||
Historical district boundaries

References
- https://www.census.gov/mycd/?st=06&cd=14
- "Citizens Redistricting Commission Final Report, 2011" (PDF).
- "Partisan Voting Index – Districts of the 115th Congress" (PDF). The Cook Political Report. April 7, 2017. Retrieved April 7, 2017.
- "Maps: Final Congressional Districts". Citizens Redistricting Commission. Archived from the original on March 10, 2013. Retrieved February 25, 2013.
- Barr, Andy (February 28, 2006). "Washington Area Tops List for Income". The Hill. Capitol Hill Publishing Corp. Retrieved June 7, 2009.
- https://elections.cdn.sos.ca.gov/sov/1994-general/ssov/governor-congress-district.pdf
- https://elections.cdn.sos.ca.gov/sov/1994-general/ssov/us-senate-congress-district.pdf
- https://elections.cdn.sos.ca.gov/sov/1996-general/ssov/president-congress-district.pdf
- https://web.archive.org/web/20110929224728/http://www.sos.ca.gov/elections/sov/1998-general/ssov/gov-cd.pdf#
- https://web.archive.org/web/20110929224732/http://www.sos.ca.gov/elections/sov/1998-general/ssov/sen-cd.pdf#
- "Statement of Vote (2000 President)" (PDF). Archived from the original (PDF) on June 11, 2007. Retrieved September 17, 2008.
- "Statement of Vote (2000 Senator)" (PDF). Archived from the original (PDF) on June 11, 2007. Retrieved September 17, 2008.
- Statement of Vote (2002 Governor) Archived November 11, 2010, at the Wayback Machine
- "Statement of Vote (2003 Recall Question)" (PDF). Archived from the original (PDF) on May 20, 2011. Retrieved October 8, 2007.
- "Statement of Vote (2003 Governor)" (PDF). Archived from the original (PDF) on May 20, 2011. Retrieved October 8, 2007.
- "Statement of Vote (2004 President)" (PDF). Archived from the original (PDF) on August 1, 2010. Retrieved August 8, 2007.
- Statement of Vote (2004 Senator) Archived August 10, 2011, at the Wayback Machine
- Statement of Vote (2006 Governor) Archived August 10, 2011, at the Wayback Machine
- Statement of Vote (2006 Senator) Archived August 10, 2011, at the Wayback Machine
- "(2008 President)". Archived from the original on February 12, 2009. Retrieved March 5, 2009.
- "Statement of Vote (2010 Governor)" (PDF). Archived from the original (PDF) on June 1, 2011. Retrieved February 7, 2012.
- "Statement of Vote (2010 Senator)" (PDF). Archived from the original (PDF) on June 1, 2011. Retrieved February 7, 2012.
- 1932 election results
- 1934 election results
- 1936 election results
- 1938 election results
- 1940 election results
- 1942 election results
- 1944 election results
- 1946 election results
- 1948 election results
- 1950 election results
- 1952 election results
- 1954 election results
- 1956 election results
- 1958 election results
- 1960 election results
- 1962 election results
- 1964 election results
- 1966 special election results
- 1966 election results
- 1968 election results
- 1970 election results
- 1972 election results
- 1974 election results
- 1976 election results
- 1978 election results
- 1980 election results
- 1982 election results
- 1984 election results
- 1986 election results
- 1988 election results
- 1990 election results
- 1992 election results
- 1994 election results
- 1996 election results
- 1998 election results
- 2000 election results
- 2002 general election results Archived February 3, 2009, at the Wayback Machine
- 2004 general election results Archived August 21, 2008, at the Wayback Machine
- 2006 general election results Archived November 27, 2008, at the Wayback Machine
- 2008 general election results Archived December 21, 2008, at the Wayback Machine
- 2010 general election results
- 2012 general election results Archived October 19, 2013, at the Wayback Machine
- "2014 general election results". Archived from the original on December 21, 2014. Retrieved December 21, 2014.
External links
- GovTrack.us: California's 14th congressional district
- RAND California Election Returns: District Definitions (out of date)
- California Voter Foundation map - CD14 (out of date)