Ashford (UK Parliament constituency)
Ashford is a constituency[n 1] created in 1885 represented in the House of Commons of the UK Parliament since 1997 by Damian Green, a Conservative, who served as First Secretary of State between 11 June and 20 December 2017.[n 2]
| Ashford | |
|---|---|
| County constituency for the House of Commons | |
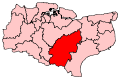 Boundary of Ashford in Kent for the 2010 general election | |
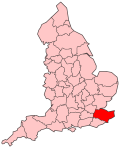 Location of Kent within England | |
| County | Kent |
| Population | 112,940 (2011 census)[1] |
| Electorate | 85,177 (December 2015)[2] |
| Major settlements | Tenterden and Ashford, Kent |
| Current constituency | |
| Created | 1885 |
| Member of Parliament | Damian Green (Conservative) |
| Number of members | One |
| Created from | West Kent |
Boundaries
1885–1918: The Municipal Borough of Tenterden, the Sessional Divisions of Ashford and Cranbrook, the corporate towns of Lydd and New Romney, and part of the Liberty of Romney Marsh.
1918–1950: The Municipal Boroughs of Lydd, New Romney, and Tenterden, the Urban District of Ashford, and the Rural Districts of Cranbrook, East Ashford, Romney Marsh, Tenterden, and West Ashford.
1950–1974: The Municipal Borough of Tenterden, the Urban District of Ashford, and the Rural Districts of Cranbrook, East Ashford, Tenterden, and West Ashford.
1974–1983: The Municipal Borough of Tenterden, the Urban District of Ashford, and the Rural Districts of East Ashford, Tenterden, and West Ashford. Cranbrook Rural District was transferred to the new Royal Tunbridge Wells constituency.
1983–2010: The Borough of Ashford. The constituency boundaries remained unchanged from 1974.
2010–present: The Borough of Ashford wards of Aylesford Green, Beaver, Biddenden, Bockhanger, Boughton Aluph and Eastwell, Bybrook, Charing, Downs North, Downs West, Godinton, Great Chart with Singleton North, Highfield, Isle of Oxney, Kennington, Little Burton Farm, Norman, North Willesborough, Park Farm North, Park Farm South, Rolvenden and Tenterden West, St Michael's, Singleton South, South Willesborough, Stanhope, Stour, Tenterden North, Tenterden South, Victoria, Washford, Weald Central, Weald East, Weald North, Weald South, and Wye.
Ashford constituency has the large town of Ashford which has Ashford International railway station and the smaller town of Tenterden, one of the area's 46 villages, towns or town suburbs which are organised communities into civil parishes. Ashford town centre, its north and its west are the only unparished areas.[3]
Constituency profile
- Political history
Created under the Redistribution of Seats Act 1885, Ashford has been won by a Conservative at every election except that of 1929 when it was won by a Liberal, after that party's turn towards the left marked by the People's Budget in 1911, who won with a majority of less than 1% of the vote.
The most marginal victory since 1929 occurred in 1997 when its voters returned a Conservative who won by a 9.7% majority. The 2015 result made the seat the 106th safest of the Conservative Party's 331 seats by percentage of majority.[4]
In June 2016, an estimated 60% of local adults voting in the EU membership referendum chose to leave the European Union instead of to remain. This was matched in two January 2018 votes in Parliament by its MP.[5]
- Economy
The constituency has its express-enabled station to London, Paris and Brussels leading to a considerable use including by local international employers supporting local shops, leisure facilities and attractions. Its use increased in the seven years to 2012, to 3.3 million entries and exits that year, a rise of more than 1 million. At the end of 2012 the unemployment rate in the area stood at 2.0% of the population claiming jobseekers allowance, compared to the regional average of 2.4% and national average of 3.8%.[6]
Members of Parliament
- Constituency created (1885)
Elections
Elections in the 2010s
| Party | Candidate | Votes | % | ± | |
|---|---|---|---|---|---|
| Conservative | Damian Green | 37,270 | 62.1 | + 3.1 | |
| Labour | Dara Farrell | 13,241 | 22.0 | - 7.7 | |
| Liberal Democrats | Adrian Gee-Turner | 6,048 | 10.1 | + 4.9 | |
| Green | Mandy Rossi | 2,638 | 4.4 | + 2.1 | |
| Independent | Susannah De Sanvil | 862 | 1.4 | N/A | |
| Majority | 24,029 | 40.1 | + 10.9 | ||
| Turnout | 60,059 | 67.1 | - 1.5 | ||
| Conservative hold | Swing | + 5.4 | |||
| Party | Candidate | Votes | % | ± | |
|---|---|---|---|---|---|
| Conservative | Damian Green | 35,318 | 59.0 | + 6.5 | |
| Labour | Sally Gathern | 17,840 | 29.8 | + 11.4 | |
| Liberal Democrats | Adrian Gee-Turner | 3,101 | 5.2 | - 0.8 | |
| UKIP | Gerald O'Brien | 2,218 | 3.7 | - 15.1 | |
| Green | Mandy Rossi | 1,402 | 2.3 | - 2.0 | |
| Majority | 17,478 | 29.2 | - 4.4 | ||
| Turnout | 59,879 | 68.5 | + 1.2 | ||
| Conservative hold | Swing | - 2.5 | |||
| Party | Candidate | Votes | % | ± | |
|---|---|---|---|---|---|
| Conservative | Damian Green | 30,094 | 52.5 | - 1.7 | |
| UKIP | Gerald O'Brien | 10,798 | 18.8 | + 14.3 | |
| Labour | Brendan Chilton | 10,580 | 18.4 | + 1.8 | |
| Liberal Democrats | Debbie Enever | 3,433 | 6.0 | - 16.8 | |
| Green | Mandy Rossi | 2,467 | 4.3 | + 2.5 | |
| Majority | 19,296 | 33.6 | + 2.3 | ||
| Turnout | 57,372 | 67.3 | - 0.6 | ||
| Conservative hold | Swing | - 8.0 | |||
| Party | Candidate | Votes | % | ± | |
|---|---|---|---|---|---|
| Conservative | Damian Green | 29,878 | 54.1 | +2.7 | |
| Liberal Democrats | Chris Took | 12,581 | 22.8 | +7.2 | |
| Labour | Chris Clark | 9,204 | 16.7 | −9.7 | |
| UKIP | Jeffrey Elenor[11] | 2,508 | 4.5 | +1.4 | |
| Green | Steven Campkin | 1,014 | 1.8 | −1.6 | |
| Majority | 17,297 | 31.3 | + 5.6 | ||
| Turnout | 55,185 | 67.9 | + 2.5 | ||
| Conservative hold | Swing | +2.3 | |||
Elections in the 2000s
| Party | Candidate | Votes | % | ± | |
|---|---|---|---|---|---|
| Conservative | Damian Green | 26,651 | 51.6 | +4.2 | |
| Labour | Valerie Whitaker | 13,353 | 25.8 | −6.3 | |
| Liberal Democrats | Chris Took | 8,308 | 16.1 | +1.0 | |
| Green | Richard Boden | 1,753 | 3.4 | +0.6 | |
| UKIP | Bernard Stroud | 1,620 | 3.1 | +0.5 | |
| Majority | 13,298 | 25.7 | + 10.4 | ||
| Turnout | 51,685 | 65.0 | + 2.5 | ||
| Conservative hold | Swing | +5.2 | |||
| Party | Candidate | Votes | % | ± | |
|---|---|---|---|---|---|
| Conservative | Damian Green | 22,739 | 47.4 | +6.0 | |
| Labour | John Adams | 15,380 | 32.1 | +0.4 | |
| Liberal Democrats | Keith Fitchett | 7,236 | 15.1 | −4.6 | |
| Green | Richard Boden | 1,353 | 2.8 | +1.6 | |
| UKIP | David Waller | 1,229 | 2.6 | N/A | |
| Majority | 7,359 | 15.3 | + 5.6 | ||
| Turnout | 47,937 | 62.5 | - 11.7 | ||
| Conservative hold | Swing | +3.2 | |||
Elections in the 1990s
| Party | Candidate | Votes | % | ± | |
|---|---|---|---|---|---|
| Conservative | Damian Green | 22,899 | 41.4 | −13.2 | |
| Labour | John Ennals | 17,554 | 31.7 | +11.7 | |
| Liberal Democrats | John Williams | 10,901 | 19.7 | −4.4 | |
| Referendum | Christopher Cruden | 3,201 | 5.8 | N/A | |
| Green | Richard Boden | 660 | 1.2 | −0.2 | |
| Natural Law | Stephen Tyrell | 89 | 0.2 | N/A | |
| Majority | 5,345 | 9.7 | - 20.8 | ||
| Turnout | 55,302 | 74.2 | - 5.0 | ||
| Conservative hold | Swing | −12.5 | |||
| Party | Candidate | Votes | % | ± | |
|---|---|---|---|---|---|
| Conservative | Keith Speed | 31,031 | 54.6 | −1.9 | |
| Liberal Democrats | Christine Headley | 13,672 | 24.1 | −3.3 | |
| Labour | Doreen Cameron | 11,365 | 20.0 | +5.3 | |
| Green | Charles Porter | 773 | 1.4 | −0.1 | |
| Majority | 17,359 | 30.5 | +1.3 | ||
| Turnout | 56,841 | 79.2 | +3.5 | ||
| Conservative hold | Swing | +0.7 | |||
Elections in the 1980s
| Party | Candidate | Votes | % | ± | |
|---|---|---|---|---|---|
| Conservative | Keith Speed | 29,978 | 56.5 | −0.3 | |
| SDP | Neil Macmillan | 14,490 | 27.3 | −0.5 | |
| Labour | Michael Wiggins | 7,775 | 14.7 | +1.8 | |
| Green | Charles Porter | 778 | 1.5 | +0.3 | |
| Majority | 15,488 | 29.2 | +0.2 | ||
| Turnout | 75.7 | +2.5 | |||
| Conservative hold | Swing | ||||
| Party | Candidate | Votes | % | ± | |
|---|---|---|---|---|---|
| Conservative | Keith Speed | 27,230 | 56.8 | +1.2 | |
| SDP | Jo Hawkes | 13,319 | 27.8 | +11.6 | |
| Labour | P.A. Lewis | 6,167 | 12.9 | −13.8 | |
| Ecology | Charles Porter | 569 | 1.2 | N/A | |
| National Labour | J.W. King | 456 | 0.95 | N/A | |
| BNP | R.E. Lockwood | 195 | 0.4 | N/A | |
| Majority | 13,911 | 29.0 | +0.1 | ||
| Turnout | 73.2 | ||||
| Conservative hold | Swing | ||||
Elections in the 1970s
| Party | Candidate | Votes | % | ± | |
|---|---|---|---|---|---|
| Conservative | Keith Speed | 26,224 | 55.7 | +11.4 | |
| Labour | A.A. Gilbert | 12,586 | 26.7 | −3.8 | |
| Liberal | Alison Wainman | 7,631 | 16.2 | −9.0 | |
| National Front | K.R. McKilliam | 678 | 1.4 | N/A | |
| Majority | 13,638 | 28.9 | +15.1 | ||
| Turnout | 76.7 | +2.2 | |||
| Conservative hold | Swing | ||||
| Party | Candidate | Votes | % | ± | |
|---|---|---|---|---|---|
| Conservative | Keith Speed | 19,294 | 44.3 | −1.9 | |
| Labour | M.B. Jackson | 13,269 | 30.5 | +4.9 | |
| Liberal | Clive G. Dennis | 10,983 | 25.2 | −3.0 | |
| Majority | 6,025 | 13.84 | |||
| Turnout | 74.54 | ||||
| Conservative hold | Swing | ||||
| Party | Candidate | Votes | % | ± | |
|---|---|---|---|---|---|
| Conservative | Bill Deedes | 21,773 | 46.2 | −6.4 | |
| Liberal | Clive G. Dennis | 13,314 | 28.2 | +11.9 | |
| Labour | M.B. Jackson | 12,077 | 25.6 | −5.4 | |
| Majority | 8,459 | 18.0 | |||
| Turnout | 81.5 | ||||
| Conservative hold | Swing | ||||
| Party | Candidate | Votes | % | ± | |
|---|---|---|---|---|---|
| Conservative | Bill Deedes | 26,649 | 54.8 | +4.8 | |
| Labour | John M. Bowyer | 14,037 | 28.9 | −2.1 | |
| Liberal | Charles Truman | 7,902 | 16.3 | −2.7 | |
| Majority | 12,612 | 26.0 | |||
| Turnout | 48,588 | 72.5 | |||
| Conservative hold | Swing | +3.5 | |||
Elections in the 1960s
| Party | Candidate | Votes | % | ± | |
|---|---|---|---|---|---|
| Conservative | Bill Deedes | 21,362 | 50.0 | ||
| Labour | Charles A Thomas | 13,249 | 31.0 | ||
| Liberal | J Gavin W Peck | 8,121 | 19.0 | ||
| Majority | 8,113 | 19.0 | |||
| Turnout | 42,732 | 75.4 | |||
| Conservative hold | Swing | ||||
| Party | Candidate | Votes | % | ± | |
|---|---|---|---|---|---|
| Conservative | Bill Deedes | 21,026 | 49.4 | ||
| Labour | Charles A Thomas | 11,989 | 28.2 | ||
| Liberal | J Gavin W Peck | 9,531 | 22.4 | ||
| Majority | 9,037 | 21.2 | |||
| Turnout | 42,546 | 77.5 | |||
| Conservative hold | Swing | ||||
Elections in the 1950s
| Party | Candidate | Votes | % | ± | |
|---|---|---|---|---|---|
| Conservative | Bill Deedes | 25,383 | 62.88 | ||
| Labour | Reginald Ward | 14,983 | 37.12 | ||
| Majority | 10,400 | 25.76 | |||
| Turnout | 40,366 | 77.48 | |||
| Conservative hold | Swing | ||||
| Party | Candidate | Votes | % | ± | |
|---|---|---|---|---|---|
| Conservative | Bill Deedes | 23,992 | 60.47 | ||
| Labour | Neville Sandelson | 15,685 | 39.53 | ||
| Majority | 8,307 | 20.94 | |||
| Turnout | 78.07 | ||||
| Conservative hold | Swing | ||||
| Party | Candidate | Votes | % | ± | |
|---|---|---|---|---|---|
| Conservative | Bill Deedes | 24,093 | 59.14 | ||
| Labour | Neville Sandelson | 16,645 | 40.86 | ||
| Majority | 7,448 | 18.28 | |||
| Turnout | 81.94 | ||||
| Conservative hold | Swing | ||||
| Party | Candidate | Votes | % | ± | |
|---|---|---|---|---|---|
| Conservative | Bill Deedes | 21,095 | 51.61 | ||
| Labour | Neville Sandelson | 14,948 | 36.57 | ||
| Liberal | H Shirley | 4,828 | 11.81 | ||
| Majority | 6,147 | 15.04 | |||
| Turnout | 84.08 | ||||
| Conservative hold | Swing | ||||
Elections in the 1940s
| Party | Candidate | Votes | % | ± | |
|---|---|---|---|---|---|
| Conservative | Edward Percy Smith | 18,800 | 52.0 | ||
| Labour | Horace W. Lee | 12,575 | 34.8 | ||
| Liberal | Harold Vesey Strong | 4,804 | 13.3 | ||
| Majority | 6,225 | 17.2 | |||
| Turnout | 71.27 | ||||
| Conservative hold | Swing | ||||
| Party | Candidate | Votes | % | ± | |
|---|---|---|---|---|---|
| Conservative | Edward Percy Smith | 9,648 | 69.7 | +10.5 | |
| Common Wealth | Catherine E. Williamson | 4,192 | 30.3 | n/a | |
| Majority | 5,456 | 39.4 | |||
| Turnout | 27.7 | −45.9 | |||
| Conservative hold | Swing | ||||
Election in the 1930s
| Party | Candidate | Votes | % | ± | |
|---|---|---|---|---|---|
| Conservative | Patrick Spens | 21,323 | 59.2 | ||
| Liberal | Borlase Matthews | 8,338 | 23.2 | ||
| Labour | W J Beck | 6,333 | 17.6 | ||
| Majority | 12,985 | 36.1 | |||
| Turnout | 73.6 | ||||
| Conservative hold | Swing | ||||
| Party | Candidate | Votes | % | ± | |
|---|---|---|---|---|---|
| Conservative | Patrick Spens | 16,051 | 47.7 | ||
| Liberal | Roderick Kedward | 11,423 | 33.9 | ||
| Labour | W J Beck | 6,178 | 18.4 | ||
| Majority | 4,628 | 13.8 | |||
| Turnout | 70.9 | ||||
| Conservative hold | Swing | ||||
| Party | Candidate | Votes | % | ± | |
|---|---|---|---|---|---|
| Conservative | Michael Knatchbull | 20,891 | 58.7 | ||
| Liberal National | Roderick Kedward | 14,681 | 41.3 | ||
| Majority | 6,210 | 17.4 | |||
| Turnout | 75.9 | ||||
Election in the 1920s
| Party | Candidate | Votes | % | ± | |
|---|---|---|---|---|---|
| Liberal | Roderick Kedward | 15,753 | 46.0 | +24.2 | |
| Unionist | Samuel Strang Steel | 14,579 | 42.6 | −17.8 | |
| Labour | Mont Follick | 3,885 | 11.4 | −6.4 | |
| Majority | 1,174 | 3.4 | 42.0 | ||
| Turnout | 34,217 | 75.3 | +4.9 | ||
| Registered electors | 45,445 | ||||
| Liberal gain from Unionist | Swing | +21.0 | |||
| Party | Candidate | Votes | % | ± | |
|---|---|---|---|---|---|
| Unionist | Samuel Strang Steel | 15,159 | 60.4 | −1.7 | |
| Liberal | Leonard John Humphrey | 5,487 | 21.8 | N/A | |
| Labour | Basil Noble | 4,473 | 17.8 | −20.1 | |
| Majority | 9,672 | 38.6 | +14.4 | ||
| Turnout | 25,119 | 70.4 | +12.6 | ||
| Registered electors | 35,659 | ||||
| Unionist hold | Swing | +9.2 | |||
| Party | Candidate | Votes | % | ± | |
|---|---|---|---|---|---|
| Unionist | Samuel Strang Steel | 12,644 | 62.1 | −7.0 | |
| Labour | Basil Noble | 7,709 | 37.9 | +7.0 | |
| Majority | 4,935 | 24.2 | −14.0 | ||
| Turnout | 20,353 | 57.8 | −6.4 | ||
| Registered electors | 35,223 | ||||
| Unionist hold | Swing | +7.0 | |||
| Party | Candidate | Votes | % | ± | |
|---|---|---|---|---|---|
| Unionist | Samuel Strang Steel | 15,638 | 69.1 | −11.9 | |
| Labour | Basil Noble | 6,977 | 30.9 | N/A | |
| Majority | 8,661 | 38.2 | −23.8 | ||
| Turnout | 22,615 | 64.2 | +25.0 | ||
| Registered electors | 35,240 | ||||
| Unionist hold | Swing | N/A | |||
Election results 1885–1918
Elections in the 1880s
| Party | Candidate | Votes | % | ± | |
|---|---|---|---|---|---|
| Conservative | William Pomfret | 6,020 | 55.2 | N/A | |
| Liberal | George Crispe Whiteley | 4,895 | 44.8 | N/A | |
| Majority | 1,125 | 10.4 | N/A | ||
| Turnout | 10,915 | 81.5 | N/A | ||
| Registered electors | 13,389 | ||||
| Conservative win (new seat) | |||||
| Party | Candidate | Votes | % | ± | |
|---|---|---|---|---|---|
| Conservative | William Pomfret | Unopposed | |||
| Conservative hold | |||||
Elections in the 1890s
| Party | Candidate | Votes | % | ± | |
|---|---|---|---|---|---|
| Conservative | Laurence Hardy | 5,512 | 56.3 | N/A | |
| Liberal | John U Bugler | 4,281 | 43.7 | N/A | |
| Majority | 1,231 | 12.6 | N/A | ||
| Turnout | 9,793 | 68.4 | N/A | ||
| Registered electors | 14,314 | ||||
| Conservative hold | Swing | N/A | |||
| Party | Candidate | Votes | % | ± | |
|---|---|---|---|---|---|
| Conservative | Laurence Hardy | Unopposed | |||
| Conservative hold | |||||
Elections in the 1900s
| Party | Candidate | Votes | % | ± | |
|---|---|---|---|---|---|
| Conservative | Laurence Hardy | 5,898 | 71.6 | N/A | |
| Independent Protestant | Benjamin Nicholson | 2,343 | 28.4 | N/A | |
| Majority | 3,555 | 43.2 | N/A | ||
| Turnout | 8,241 | 64.8 | N/A | ||
| Registered electors | 12,714 | ||||
| Conservative hold | Swing | N/A | |||
| Party | Candidate | Votes | % | ± | |
|---|---|---|---|---|---|
| Conservative | Laurence Hardy | 5,994 | 51.6 | −20.0 | |
| Liberal | Percy Harris | 5,614 | 48.4 | N/A | |
| Majority | 380 | 3.2 | −40.0 | ||
| Turnout | 11,608 | 83.7 | +18.9 | ||
| Registered electors | 13,864 | ||||
| Conservative hold | Swing | N/A | |||
Elections in the 1910s
| Party | Candidate | Votes | % | ± | |
|---|---|---|---|---|---|
| Conservative | Laurence Hardy | 7,966 | 64.3 | +12.7 | |
| Liberal | Reginald John Farrer | 4,422 | 35.7 | −12.7 | |
| Majority | 3,544 | 28.6 | |||
| Turnout | 87.2 | +3.5 | |||
| Conservative hold | Swing | ||||
| Party | Candidate | Votes | % | ± | |
|---|---|---|---|---|---|
| Conservative | Laurence Hardy | Unopposed | |||
| Conservative hold | |||||
General Election 1914/15:
Another General Election was required to take place before the end of 1915. The political parties had been making preparations for an election to take place and by the July 1914, the following candidates had been selected;
- Unionist: Lawrence Hardy
- Liberal: Arthur Frederick William Johnson[21]
| Party | Candidate | Votes | % | ± | |
|---|---|---|---|---|---|
| C | Unionist | Samuel Strang Steel | 10,258 | 81.0 | N/A |
| Independent Democrat | William H Deedes | 2,408 | 19.0 | N/A | |
| Majority | 7,850 | 62.0 | N/A | ||
| Turnout | 12,666 | 39.2 | N/A | ||
| Registered electors | 32,349 | ||||
| Unionist hold | Swing | N/A | |||
| C indicates candidate endorsed by the coalition government. | |||||
Notes and references
- Notes
- A county constituency (for the purposes of election expenses and type of returning officer)
- As with all constituencies, the constituency elects one Member of Parliament (MP) by the first past the post system of election at least every five years.
- References
- "Usual Resident Population, 2011". Neighbourhood Statistics. Office for National Statistics. Retrieved 26 January 2015.
- "Electorate Figures – Boundary Commission for England". 2011 Electorate Figures. Boundary Commission for England. 4 March 2011. Archived from the original on 6 November 2010. Retrieved 13 March 2011.
- 2011 Census Custom tables: administrative parish hierarchy. Retrieved 17 July 2013
- List of Conservative MPs elected in 2015 by % majority UK Political.info. Retrieved 2017-01-29
- https://www.theyworkforyou.com/mp/10241/damian_green/ashford/divisions?policy=1065
- Unemployment claimants by constituency The Guardian
- Leigh Rayment's Historical List of MPs – Constituencies beginning with "A" (part 3)
- "View the Statement or Persons Nominated as candidates for the Ashford constituency". Ashford Borough Council. Retrieved 14 November 2019.
- "Election Data 2015". Electoral Calculus. Archived from the original on 17 October 2015. Retrieved 17 October 2015.
- "Ashford.gov.uk" (PDF).
- "UKIP: Ashford". UKIP. Archived from the original on 13 April 2010. Retrieved 5 April 2010.
- "Politics Resources". Election 1997. Politics Resources. 1 May 1997. Archived from the original on 11 August 2011. Retrieved 25 December 2010.
- C. Rallings & M. Thrasher, The Media Guide to the New Parliamentary Constituencies, p.120 (Plymouth: LGC Elections Centre, 1995)
- "Politics Resources". Election 1992. Politics Resources. 9 April 1992. Archived from the original on 24 July 2011. Retrieved 6 December 2010.
- British Parliamentary Election Results 1918–1949, FWS Craig
- British Parliamentary Election Results 1885–1918, FWS Craig
- The Liberal Year Book, 1907
- Debrett's House of Commons & Judicial Bench, 1886
- Debrett's House of Commons & Judicial Bench, 1901
- Debrett's House of Commons & Judicial Bench, 1916
- Kent & Sussex Courier 27 Mar 1914
- Debrett's House of Commons & Judicial Bench, 1922
Sources
- British Parliamentary Election Results 1885–1918, compiled and edited by F.W.S. Craig (Macmillan Press 1974)
- Iain Dale, ed. (2003). The Times House of Commons 1929, 1931, 1935. Politico's (reprint). ISBN 1-84275-033-X.
- The Times House of Commons 1945. The Times. 1945.
- The Times House of Commons 1950. The Times. 1950.
- The Times House of Commons 1955. The Times. 1955.