2019 Bassetlaw District Council election
The 2019 Bassetlaw District Council election took place on 2 May 2019 to elect all 48 members of Bassetlaw District Council in England.[1] This was on the same day as other local elections.
| |||||||||||||||||||||||||||||||||
All 48 seats to Bassetlaw District Council 25 seats needed for a majority | |||||||||||||||||||||||||||||||||
|---|---|---|---|---|---|---|---|---|---|---|---|---|---|---|---|---|---|---|---|---|---|---|---|---|---|---|---|---|---|---|---|---|---|
| Turnout | 30% | ||||||||||||||||||||||||||||||||
| |||||||||||||||||||||||||||||||||
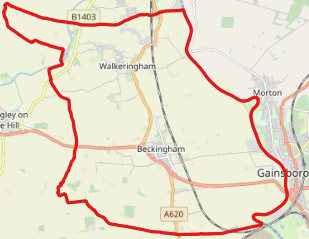
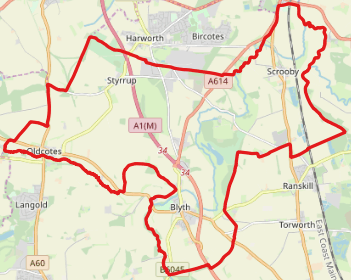
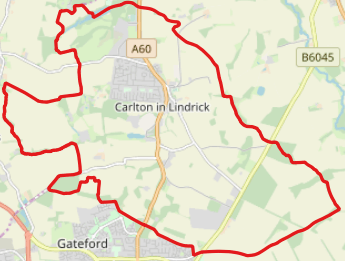
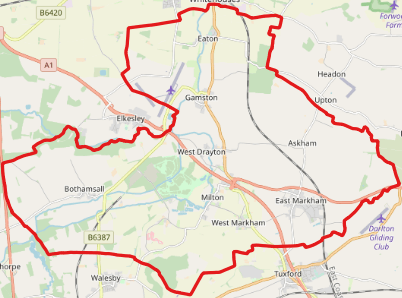
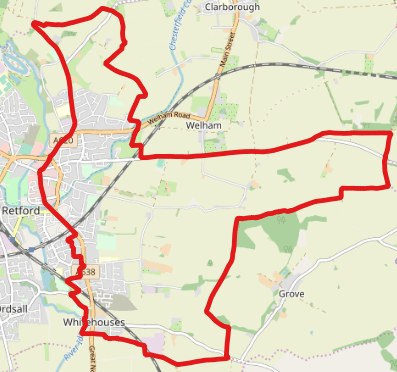
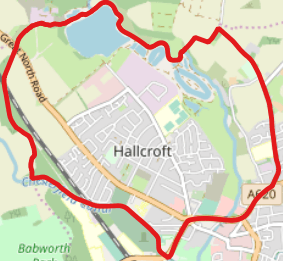
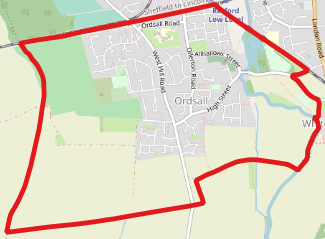
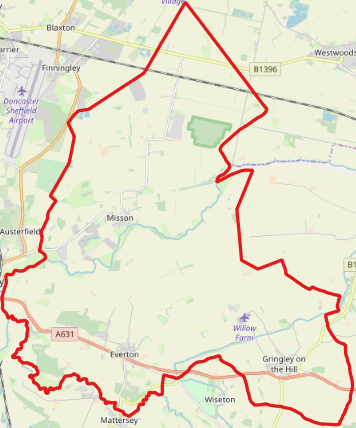
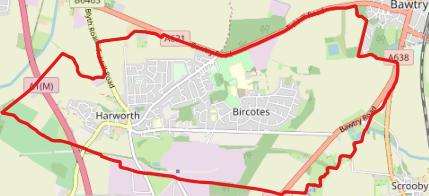
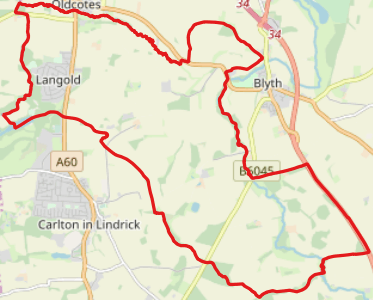
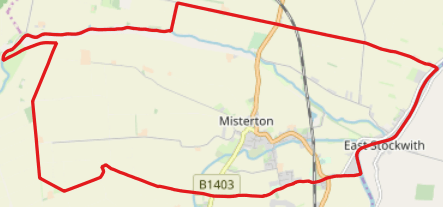
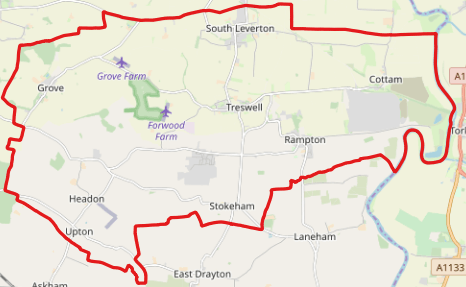
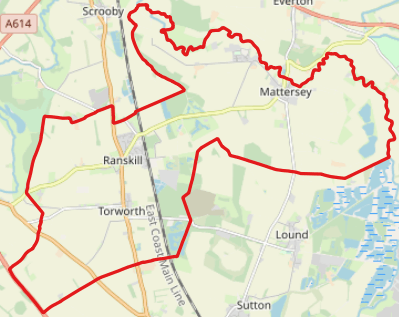
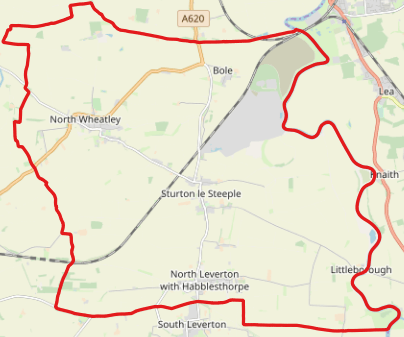
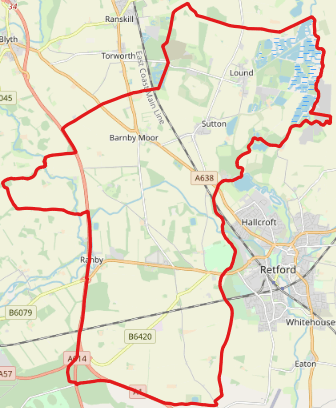
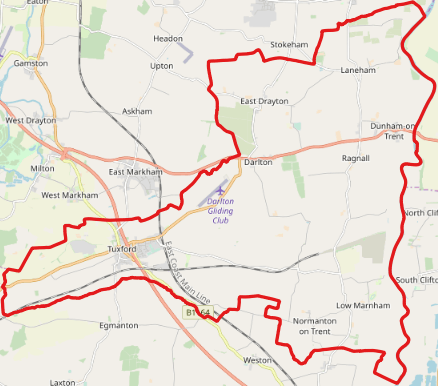
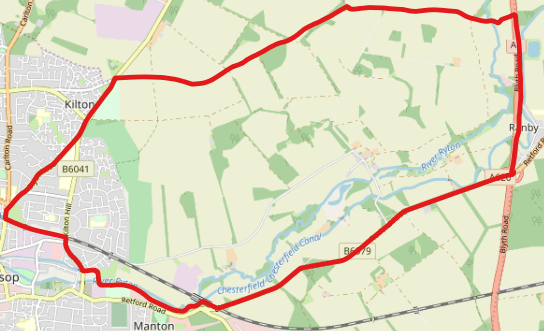
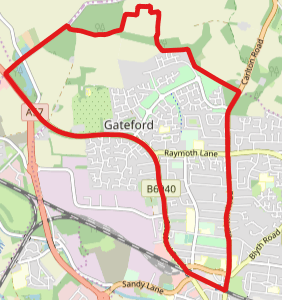
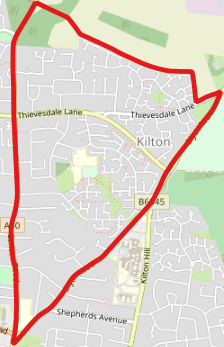
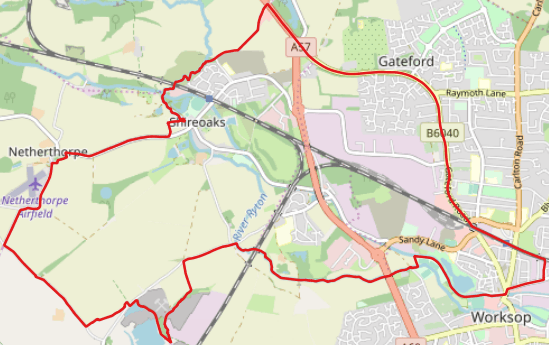
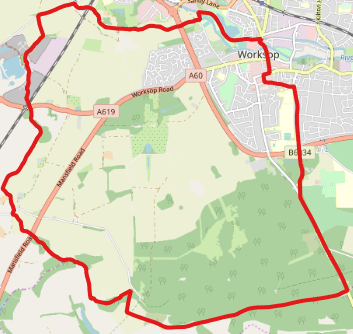
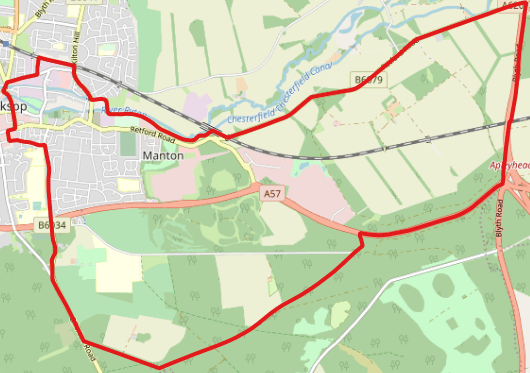
 Map of the results of the election. Colours denote the winning party, as shown in the main table of results. | |||||||||||||||||||||||||||||||||
| |||||||||||||||||||||||||||||||||
The election resulted in the Labour Party retaining its control of the council with an increased majority. The Conservative Party suffered its worst defeat in Bassetlaw since 1973, winning only 5 seats of the 12 seats it was defending. Both Independents and Labour gained seats from the Conservatives. The Liberal Democrats gained a seat from Labour in East Retford West, the first Liberal Democrat elected in Bassetlaw since 2006.[2]
Background
Bassetlaw is a shire district in Nottinghamshire, England. It is predominantly rural, with two towns: Worksop and Retford. The district was formed in 1974 by the Local Government Act 1972. Local Government in Nottinghamshire is organised on a two-tier basis, with local district councils responsible for local services such as housing, local planning and refuse collection and Nottinghamshire County Council responsible for "wide-area" services, including education, social services and public transport. Bassetlaw District Council has been controlled by Labour for most of its existence, except for a brief period from 2006 to 2011 when it was controlled by the Conservatives.[3]
Bassetlaw District Council held local elections on 2 May 2019 along with other councils in England as part of the 2019 local elections. Bassetlaw is divided into 25 wards for electoral purposes, with each ward electing between one and three councillors. Until 2015, the council was elected by thirds, with district elections being held every year except the year in which elections to Nottinghamshire County Council took place. The council resolved in 2014 to hold all-out elections from 2015 onwards, with all 48 councillors elected in all-out elections every four years. Councillors defending their seats in this election were previously elected in 2015. At that election, Labour won a majority of seats and retained its control of the council, which it has controlled since 2011.
Result
The election resulted in the Labour Party retaining its control of the council[4]
| Party | Seats | Gains | Losses | Net gain/loss | Seats % | Votes % | Votes | +/− | |
|---|---|---|---|---|---|---|---|---|---|
| Labour | 37 | 5 | 1 | 45.4% | 11,766 | ||||
| Conservative | 5 | 0 | 7 | 28.9% | 7,484 | ||||
| Independent | 5 | 3 | 1 | 13.0% | 3,366 | ||||
| Liberal Democrats | 1 | 1 | 0 | 4.7% | 1,211 | ||||
| UKIP | 0 | 0 | 0 | 0 | 8.0% | 2,061 | |||
Ward results
Asterisks denote incumbent Councillors seeking re-election.
Beckingham
| Party | Candidate | Votes | % | ± | |
|---|---|---|---|---|---|
| Independent | Joan Sanger* | 558 | 73.1% | ||
| Conservative | Raymond Simpson | 205 | 26.9% | ||
| Turnout | 781 | 41% | |||
| Independent hold | Swing | ||||
Blyth
| Party | Candidate | Votes | % | ± | |
|---|---|---|---|---|---|
| Labour | Jack Bowker | 261 | 38.1% | ||
| Conservative | Barry Bowles* | 237 | 34.6% | ||
| UKIP | John Hudson | 124 | 18.1% | ||
| Liberal Democrats | Peter Thompson | 63 | 9.2% | ||
| Turnout | 693 | 37.2% | |||
| Labour gain from Conservative | Swing | ||||
Carlton
| Party | Candidate | Votes | % | ± | |
|---|---|---|---|---|---|
| Labour | Steve Scotthorne* | 779 | 48.3% | ||
| Labour | David Pidwell* | 644 | |||
| Labour | Robin Carrington-Wilde* | 636 | |||
| Conservative | Val Bowles | 506 | 31.4% | ||
| Conservative | Joanne Morrison | 433 | |||
| UKIP | Kevin "Of the Blackburn family" | 329 | 20.4% | ||
| Conservative | Alexandra Gregory | 324 | |||
| Turnout | 32.8% | 1,457 | |||
| Labour hold | Swing | ||||
| Labour hold | Swing | ||||
| Labour hold | Swing | ||||
Clayworth

| Party | Candidate | Votes | % | ± | |
|---|---|---|---|---|---|
| Independent | Ben Sofflet | 315 | 56.3% | N/A | |
| Conservative | Drew Smith | 245 | 43.8% | ||
| Turnout | 576 | 37.7% | |||
| Independent gain from Conservative | Swing | ||||
East Markham
| Party | Candidate | Votes | % | ± | |
|---|---|---|---|---|---|
| Conservative | John Ogle* | Unopposed | |||
| Turnout | N/A | N/A | N/A | ||
East Retford East
| Party | Candidate | Votes | % | ± | |
|---|---|---|---|---|---|
| Labour | Susan Shaw* | 728 | 43.9% | ||
| Conservative | Mike Quigley* | 704 | 42.5% | ||
| Labour | Bill Tomlinson | 669 | |||
| Conservative | Martin Auckland | 622 | |||
| Conservative | Richard Gill | 620 | |||
| Labour | Fraser Merryweather | 554 | |||
| Liberal Democrats | Karen Costello | 226 | 13.6% | N/A | |
| Turnout | 1,610 | 30.5% | |||
| Labour hold | Swing | ||||
| Conservative hold | Swing | ||||
| Labour hold | Swing | ||||
East Retford North
| Party | Candidate | Votes | % | ± | |
|---|---|---|---|---|---|
| Labour | Graham Oxby* | 895 | 57.1% | ||
| Labour | Jane Plevin | 734 | |||
| Labour | Garry Clarkson* | 667 | |||
| Conservative | Lynda Carter | 466 | 29.7% | ||
| Conservative | Anthony Tromans* | 438 | |||
| Conservative | Donald Clarke | 370 | |||
| Liberal Democrats | Paul Straker | 207 | 13.2% | N/A | |
| Turnout | 1,533 | 30.6% | |||
| Labour hold | Swing | ||||
| Labour hold | Swing | ||||
| Labour gain from Conservative | Swing | ||||
East Retford South
| Party | Candidate | Votes | % | ± | |
|---|---|---|---|---|---|
| Labour | Helen Richards* | 697 | 62.1% | ||
| Labour | Carolyn Troop* | 679 | |||
| UKIP | Martin Introna | 228 | 20.3% | ||
| Conservative | John Manners | 197 | 17.6% | ||
| Conservative | Paul Chambers | 179 | |||
| Turnout | 1,146 | 29.5% | |||
| Labour hold | Swing | ||||
| Labour hold | Swing | ||||
East Retford West

| Party | Candidate | Votes | % | ± | |
|---|---|---|---|---|---|
| Labour | Jim Anderson* | 394 | 33.1% | ||
| Liberal Democrats | Helen Tamblyn-Saville | 371 | 31.1% | ||
| Labour | Matt Callingham | 364 | |||
| Conservative | Ashley Burnell | 236 | 19.8% | ||
| Independent | Marie Critchley | 191 | 16% | N/A | |
| Liberal Democrats | Stephen Ware | 164 | |||
| Conservative | Ashraf Syed Abdul Cader | 142 | |||
| Turnout | 1,062 | 28.4% | |||
| Labour hold | Swing | ||||
| Liberal Democrats gain from Labour | Swing | ||||
Everton
| Party | Candidate | Votes | % | ± | |
|---|---|---|---|---|---|
| Independent | Mark Watson | 405 | 56.8% | N/A | |
| Conservative | Annette Simpson* | 308 | 43.2% | ||
| Turnout | 718 | 36% | |||
| Independent gain from Conservative | Swing | ||||
Harworth
| Party | Candidate | Votes | % | ± | |
|---|---|---|---|---|---|
| Labour | Gloria Evans* | 986 | 72.2% | ||
| Labour | David Challinor* | 961 | |||
| Labour | Beverley Schuller | 940 | |||
| Conservative | Sonia Armstrong | 380 | 27.8% | ||
| Conservative | Leah Davis | 369 | |||
| Conservative | Gavin McGonigle | 322 | |||
| Turnout | 1,532 | 24.9% | |||
| Labour hold | Swing | ||||
| Labour hold | Swing | ||||
| Labour hold | Swing | ||||
Langold
| Party | Candidate | Votes | % | ± | |
|---|---|---|---|---|---|
| Labour | Jill Freeman* | 332 | 76.3% | ||
| Conservative | Stephen Evans | 103 | 23.7% | N/A | |
| Turnout | 456 | 23.5% | |||
| Labour hold | Swing | ||||
Misterton
| Party | Candidate | Votes | % | ± | |
|---|---|---|---|---|---|
| Independent | Hazel Brand* | 473 | 81.4% | ||
| Conservative | Alastair Bowman | 108 | 18.6% | ||
| Turnout | 592 | 29.4% | |||
| Independent hold | Swing | ||||
Rampton
| Party | Candidate | Votes | % | ± | |
|---|---|---|---|---|---|
| Conservative | Anthony Coultate | 372 | 72% | ||
| Labour | Raymond Fielding | 145 | 28% | ||
| Turnout | 550 | 32.6 | |||
| Conservative hold | Swing | ||||
Ranskill
| Party | Candidate | Votes | % | ± | |
|---|---|---|---|---|---|
| Labour | Paul Nicholls | 278 | 39.5% | ||
| Conservative | Beverley Fear | 204 | 29% | ||
| Independent | Michael Gray* | 177 | 25.1% | N/A | |
| Liberal Democrats | Mark Hunter | 45 | 6.4% | ||
| Turnout | 710 | 38.2% | |||
| Labour gain from Conservative | Swing | ||||
Sturton
| Party | Candidate | Votes | % | ± | |
|---|---|---|---|---|---|
| Labour | James Naish | 436 | 62.4% | ||
| Conservative | Daniel Gregory | 263 | 37.6% | N/A | |
| Turnout | 731 | 39.5% | |||
| Labour gain from Independent | Swing | ||||
Sutton
| Party | Candidate | Votes | % | ± | |
|---|---|---|---|---|---|
| Independent | Rob Boeuf | 381 | 61.7% | N/A | |
| Conservative | Emma Auckland | 163 | 26.4% | ||
| Labour | Gary Moore | 74 | 12% | ||
| Turnout | 627 | 37.5% | |||
| Independent gain from Conservative | Swing | ||||
Tuxford and Trent
| Party | Candidate | Votes | % | ± | |
|---|---|---|---|---|---|
| Conservative | Keith Isard* | 453 | 43.5% | ||
| Conservative | Shirley Isard* | 412 | |||
| Independent | Matt Richards | 385 | 36.9% | N/A | |
| Labour | Rebecca Littler-Leigh | 204 | 19.6% | ||
| Labour | Michael Ouzman | 159 | |||
| Turnout | 974 | 27.9% | |||
| Conservative hold | Swing | ||||
| Conservative hold | Swing | ||||
Welbeck

| Party | Candidate | Votes | % | ± | |
|---|---|---|---|---|---|
| Labour | Kevin Dukes* | 324 | 60.3% | ||
| Conservative | Matthew Evans | 213 | 39.7% | ||
| Turnout | 563 | 36.8% | |||
| Labour hold | Swing | ||||
Worksop East
| Party | Candidate | Votes | % | ± | |
|---|---|---|---|---|---|
| Labour | Cliff Entwistle* | 834 | 51.4% | ||
| Labour | Debbie Merryweather* | 785 | |||
| Labour | Jo White* | 767 | |||
| UKIP | David Kirton | 480 | 29.6% | ||
| Conservative | Deidre Vernon | 167 | 10.3% | ||
| Conservative | Arthur Dernie | 161 | |||
| Conservative | Susan Radcliffe | 156 | |||
| Liberal Democrats | Helen Cooper | 143 | 8.8% | N/A | |
| Turnout | 1,481 | 29.5% | |||
| Labour hold | Swing | ||||
| Labour hold | Swing | ||||
| Labour hold | Swing | ||||
Worksop North
| Party | Candidate | Votes | % | ± | |
|---|---|---|---|---|---|
| Labour | Maria Charlesworth | 874 | 49.5% | ||
| Labour | Neil Sanders | 843 | |||
| Labour | Gwynneth Jones | 826 | |||
| UKIP | Glen Marshall | 482 | 27.3% | ||
| Conservative | Neil Dexter | 410 | 23.2% | ||
| Conservative | Alan Tonks | 344 | |||
| Conservative | Roger Vernon | 338 | |||
| Turnout | 1,706 | 24.8% | |||
| Labour hold | Swing | ||||
| Labour hold | Swing | ||||
| Labour hold | Swing | ||||
Worksop North East
| Party | Candidate | Votes | % | ± | |
|---|---|---|---|---|---|
| Labour | Alan Rhodes* | 863 | 71.3% | ||
| Labour | Simon Greaves* | 828 | |||
| Labour | Maddy Richardson* | 774 | |||
| Conservative | Alec Thorpe | 347 | 28.7% | ||
| Conservative | Matthew Peck | 344 | |||
| Conservative | John Anderson | 330 | |||
| Turnout | 1,355 | 27.4% | |||
| Labour hold | Swing | ||||
| Labour hold | Swing | ||||
| Labour hold | Swing | ||||
Worksop North West
| Party | Candidate | Votes | % | ± | |
|---|---|---|---|---|---|
| Labour | Sybil Fielding* | 885 | 67.8% | ||
| Labour | David Pressley* | 830 | |||
| Labour | Dean Brett* | 793 | |||
| Conservative | Richard Barnes | 420 | 32.2% | ||
| Conservative | Tim Chapman | 324 | |||
| Conservative | Pamela Briggs | 317 | |||
| Turnout | 1,477 | 25.3% | |||
| Labour hold | Swing | ||||
| Labour hold | Swing | ||||
| Labour hold | Swing | ||||
Worksop South
| Party | Candidate | Votes | % | ± | |
|---|---|---|---|---|---|
| Labour | Julie Leigh* | 832 | 42.2% | ||
| Labour | Kevin Greaves* | 790 | |||
| Labour | Tony Eaton | 766 | |||
| Conservative | Rachel Briggs | 657 | 33.4% | ||
| Conservative | Helen Colton | 619 | |||
| Conservative | Lewis Stanniland | 608 | |||
| Independent | Nigel Turner | 481 | 24.4% | N/A | |
| Turnout | 1,919 | 34.1% | |||
| Labour gain from Conservative | Swing | ||||
| Labour hold | Swing | ||||
| Labour hold | Swing | ||||
Worksop South East
| Party | Candidate | Votes | % | ± | |
|---|---|---|---|---|---|
| Labour | Josie Potts* | 945 | 57.7% | ||
| Labour | Clayton Tindle* | 815 | |||
| Labour | John Shephard* | 788 | |||
| UKIP | Ash Henderson | 418 | 25.5% | ||
| Liberal Democrats | Leon Duveen | 156 | 9.5% | N/A | |
| Conservative | Colin Barton † | 120 | 7.3% | N/A | |
| Conservative | Ethel Boddy | 88 | |||
| Conservative | Angela Chambers | 74 | |||
| Turnout | 1,462 | 25.9% | |||
| Labour hold | Swing | ||||
| Labour hold | Swing | ||||
| Labour hold | Swing | ||||
- † Colin Barton was expelled from the Conservative Party in April 2019, however he remained a nominated Conservative candidate in this election as the deadline for withdrawals had passed.[5]
References
- "2019 District & Parish Council Elections". Bassetlaw District Council. Retrieved 3 April 2019.
- "Council Results". www.electionscentre.co.uk. Elections Centre. Retrieved 3 May 2019.
- "Elections 2008: Bassetlaw". BBC News. Retrieved 6 April 2019.
- https://www.bbc.co.uk/news/topics/c34kqd05n0mt/bassetlaw-district-council
- "Conservatives bar council candidates over Facebook posts". BBC News. Retrieved 28 April 2019.