2002 Costa Rican general election
General elections were held in Costa Rica on 3 February 2002.[1] For the first time in the country's history, no candidate in the presidential election passed the 40% threshold.[2] This meant a second round of voting had to be held on 7 April which saw Abel Pacheco of the Social Christian Unity Party defeat the National Liberation Party's Rolando Araya Monge.[3]
| |||||||||||||||||||||||||||||||
|
| |||||||||||||||||||||||||||||||
Presidential election | |||||||||||||||||||||||||||||||
| |||||||||||||||||||||||||||||||
| |||||||||||||||||||||||||||||||
Legislative election | |||||||||||||||||||||||||||||||
This lists parties that won seats. See the complete results below. | |||||||||||||||||||||||||||||||
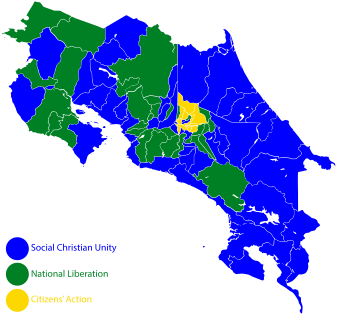
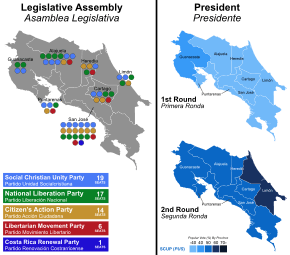 Map on the left shows the seats won by each party by province. The map on the right shows which party won the plurality in each province in both rounds of the Presidential election. | |||||||||||||||||||||||||||||||
.jpg)

 |
|---|
| This article is part of a series on the politics and government of Costa Rica |
|
Legislature
|
|
|
|
|
|
|
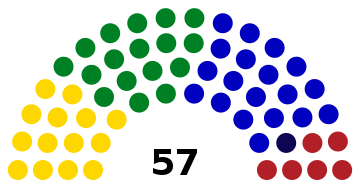
Many analysts consider this election the beginning of the end of Costa Rica’s decades-long two party system.[4][5][6] For the first time in many years alternative political forces become really relevant in the Parliament and the plenary had three large party groups; PUSC (19), PLN (17) and PAC (14).[7]
While PUSC won the presidential election and the majority in Congress, PLN became the primal opposition force in Parliament. Centre-left PAC with a progressive proposal seem to had gravely affected traditional third forces at the left of the spectrum like Democratic Force that fail to win any seat on that election even when for some years was Costa Rica’s main third party.[7] Right-wing Libertarian Movement also increases its representation from one to six deputies[7] while conservative[8] Costa Rican Renewal Party won one seat as usual.[7]
Despite the close contest, voter turnout was only 68.8% on 3 February the lowest since the 1958 elections. For the second round of the presidential elections it fell to 60.2%, the lowest since 1949.[9]
Background
Before the election, the country's Supreme Electoral Tribinal attempted to make several reforms to the electoral system. These included allowing independents to run in local elections, using electronic voting machines, allowing Costa Ricans living abroad to vote, and allowing voters to choose the top two places on parliamentary lists.[2] However, the changes were rejected by the Legislative Assembly, which noted that independent candidature was incompatible with the constitution, and that electronic voting could not be guaranteed to be secure or transparent.[2]
Results
President
| Candidate | Party | First round | Second round | |||
|---|---|---|---|---|---|---|
| Votes | % | Votes | % | |||
| Abel Pacheco | Social Christian Unity Party | 590,277 | 38.58 | 776,278 | 57.95 | |
| Rolando Araya Monge | National Liberation Party | 475,030 | 31.05 | 563,202 | 42.05 | |
| Ottón Solís | Citizens' Action Party | 400,681 | 26.19 | |||
| Otto Guevara | Libertarian Movement | 25,815 | 1.69 | |||
| Justo Orozco Álvarez | Costa Rican Renewal Party | 16,404 | 1.07 | |||
| Walter Muñoz Céspedes | National Integration Party | 6,235 | 0.41 | |||
| Vladimir De la Cruz De Lemos | Democratic Force | 4,121 | 0.27 | |||
| Walter Coto Molina | Coalition Change 2000 | 3,970 | 0.26 | |||
| Rolando Angulo Zeledón | General Union Partyes | 2,655 | 0.17 | |||
| Daniel Reynolds Vargas | National Patriotic Partyes | 1,680 | 0.11 | |||
| Marvin Calvo Montoya | Christian National Alliancees | 1,271 | 0.08 | |||
| José Hine García | National Rescue Party | 905 | 0.06 | |||
| Pablo Galo Angulo Casasola | Independent Workers' Partyes | 801 | 0.05 | |||
| Invalid/blank votes | 39,573 | – | 33,463 | – | ||
| Total | 1,569,418 | 100 | 1,372,943 | 100 | ||
| Registered voters/turnout | 2,279,851 | 68.84 | 2,279,851 | 60.22 | ||
| Source: TSE, TSE | ||||||
By province
First round
| Province % | PUSC % | PLN % | PAC % | ML % | PRC % | PIN % | FD % | Other % |
|---|---|---|---|---|---|---|---|---|
| 36.6 | 28.5 | 31.1 | 1.6 | 0.8 | 0.6 | 0.2 | 0.7 | |
| 37.8 | 34.1 | 24.7 | 1.4 | 0.9 | 0.3 | 0.2 | 0.6 | |
| 35.4 | 31.8 | 28.4 | 1.9 | 0.7 | 0.5 | 0.4 | 1.0 | |
| 36.1 | 26.8 | 33.2 | 1.6 | 1.1 | 0.4 | 0.2 | 0.7 | |
| 45.0 | 33.8 | 15.8 | 2.5 | 1.7 | 0.2 | 0.3 | 0.9 | |
| 48.6 | 28.4 | 14.9 | 2.8 | 3.1 | 0.3 | 0.4 | 1.5 | |
| 44.3 | 40.6 | 12.1 | 0.9 | 1.2 | 0.2 | 0.2 | 0.8 | |
| Total | 38.6 | 31.1 | 26.2 | 1.7 | 1.1 | 0.4 | 0.3 | 0.9 |
Second round
| Province | PUSC % | PLN % |
|---|---|---|
| 57.7 | 42.3 | |
| 56.1 | 43.9 | |
| 55.6 | 44.4 | |
| 58.1 | 41.9 | |
| 59.7 | 40.3 | |
| 67.0 | 33.0 | |
| 57.1 | 42.9 | |
| Total | 58.0 | 42.0 |
Parliament
 | |||||
| Party | Votes | % | Seats | +/– | |
|---|---|---|---|---|---|
| Social Christian Unity Party | 453,201 | 29.8 | 19 | –8 | |
| National Liberation Party | 412,383 | 27.1 | 17 | –6 | |
| Citizens' Action Party | 334,162 | 22.0 | 14 | New | |
| Libertarian Movement | 142,152 | 9.3 | 6 | +5 | |
| Costa Rican Renewal Party | 54,699 | 3.6 | 1 | 0 | |
| Democratic Force | 30,172 | 2.0 | 0 | –3 | |
| National Integration Party | 26,084 | 1.7 | 0 | –1 | |
| Coalition Change 2000 | 12,992 | 0.8 | 0 | New | |
| Agrarian Labour Action Party | 10,890 | 0.7 | 0 | –1 | |
| Workers' Independent Party | 8,044 | 0.5 | 0 | New | |
| National Patriotic Party | 7,123 | 0.5 | 0 | New | |
| Cartago Agrarian Union Party | 6,974 | 0.5 | 0 | 0 | |
| Christian National Alliance Party | 6,825 | 0.4 | 0 | New | |
| General Union Party | 5,883 | 0.4 | 0 | 0 | |
| National Rescue Party | 4,937 | 0.3 | 0 | 0 | |
| National Agrarian Party | 2,595 | 0.2 | 0 | New | |
| Cartago Agrarian Force Party | 1,390 | 0.1 | 0 | New | |
| National Convergence | 1,348 | 0.1 | 0 | New | |
| Invalid/blank votes | 47,484 | – | – | – | |
| Total | 1,569,338 | 100 | 57 | 0 | |
| Registered voters/turnout | 2,279,851 | 68.8 | – | – | |
| Source: Election Resources | |||||
By province
| Province | PUSC | PLN | PAC | ML | PRC | FD | PIN | Other | ||||||||
|---|---|---|---|---|---|---|---|---|---|---|---|---|---|---|---|---|
| % | S | % | S | % | S | % | S | % | S | % | S | % | S | % | S | |
| 27.1 | 6 | 24.2 | 5 | 27.0 | 6 | 11.8 | 2 | 3.6 | 1 | 1.7 | 0 | 1.8 | 0 | 2.8 | 0 | |
| 30.2 | 4 | 30.5 | 4 | 20.7 | 2 | 7.5 | 1 | 2.8 | 0 | 1.3 | 0 | 1.4 | 0 | 5.4 | 0 | |
| 25.7 | 2 | 25.4 | 2 | 20.8 | 2 | 7.3 | 1 | 2.0 | 0 | 3.7 | 0 | 4.5 | 0 | 10.4 | 0 | |
| 27.5 | 1 | 24.3 | 1 | 27.6 | 2 | 10.7 | 1 | 3.5 | 0 | 2.3 | 0 | 1.0 | 0 | 3.0 | 0 | |
| 37.8 | 2 | 29.8 | 1 | 12.9 | 1 | 10.0 | 1 | 4.2 | 0 | 1.8 | 0 | 0.4 | 0 | 3.2 | 0 | |
| 37.3 | 2 | 26.2 | 2 | 12.7 | 1 | 8.1 | 1 | 5.6 | 0 | 2.7 | 0 | 0.8 | 0 | 9.4 | 0 | |
| 37.9 | 2 | 39.1 | 2 | 10.3 | 0 | 2.8 | 0 | 6.2 | 0 | 1.2 | 0 | 0.4 | 0 | 2.2 | 0 | |
| Total | 29.8 | 19 | 27.1 | 17 | 22.0 | 14 | 9.3 | 6 | 3.6 | 1 | 2.0 | 0 | 1.7 | 0 | 4.6 | 0 |
Municipal Councils
The elections of municipal councilors of Costa Rica in 2002 were an electoral process held in parallel with the presidential and legislative elections. In them the 495 tenure aldermen and the 495 alternates that conform the 81 Municipal Councils were chosen.
The Central Canton of San José, the most populous, named 13 aldermen. Desamparados and Alajuela named 11. Others less populated (Puntarenas, Limón, Pococí, Heredia, Cartago, La Unión, San Carlos, Goicoechea, Pérez Zeledón, etc.) named 9. Others even smaller (Tibás, Grecia, Vázquez de Coronado, Montes de Oca, Siquirres, Escazú, Turrialba, etc.) appointed 7 council members. Finally, the smallest (Turrubares, San Mateo, Santa Ana, Mora, Montes de Oro, Talamanca, etc.) named 5.
| Party | Aldermen | Range | |
|---|---|---|---|
 | Social Christian Unity Party | 178 | National |
 | National Liberation Party | 178 | National |
 | Citizens' Action Party | 101 | National |
 | Libertarian Movement | 13 | National |
| Costa Rican Renewal Party | 7 | National | |
 | Democratic Force | 4 | National |
| Escazu's Progressive Yoke | 3 | Escazu Canton | |
| Agrarian Labour Action Party | 2 | National | |
| Quepan Action | 2 | Quepos Canton | |
| Party of the Sun | 2 | Santa Ana Canton | |
| National Agrarian Party | 1 | National | |
| Ecological Garabito Party | 2 | Garabito Canton | |
| 21st Century Curridabat | 1 | Curridabat Canton | |
 | New Alajuelita | 1 | Alajuelita Canton |
| Paraisan Authentic Party | 1 | Paraiso Canton | |
 | Sarapican Authentic Party | 1 | Sarapiqui Canton |
 | Independent Worker's Party | 1 | National |
| National Integration Party | 1 | National | |
| National Rescue | 1 | National | |
| Coalition Change 2000 | 1 | ||
Maps
President
First round
 Voter turnout by canton
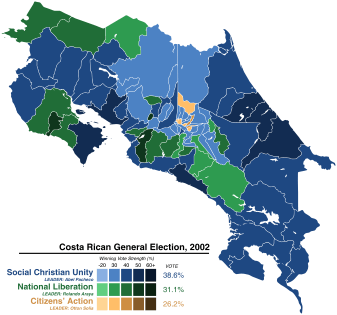 Party placed first by canton
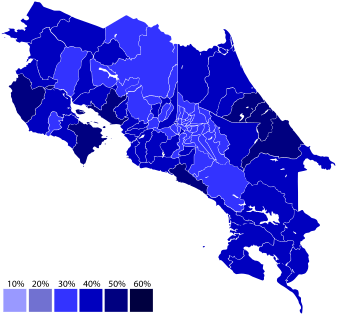 PUSC strength by canton
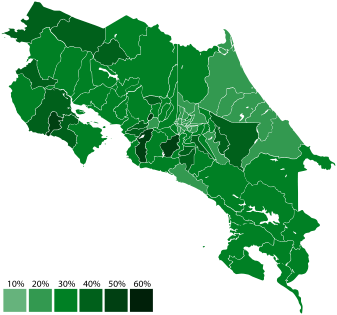 PLN strength by canton
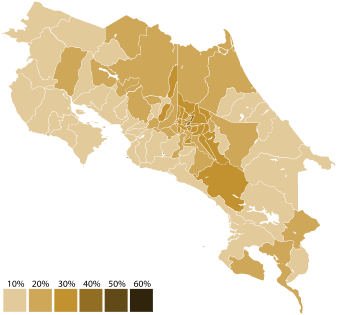 PAC strength by canton
Runoff
 Voter turnout by canton
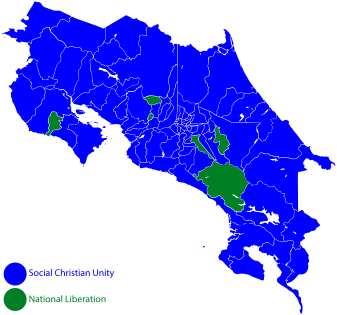 Party placed first by canton
 PUSC strength by canton
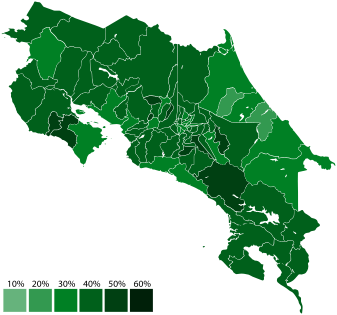 PLN strength by canton
Parliament
 Party placed first by canton
 PUSC strength by canton
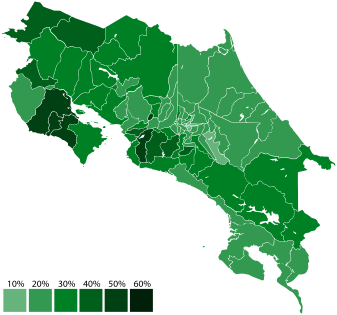 PLN strength by canton
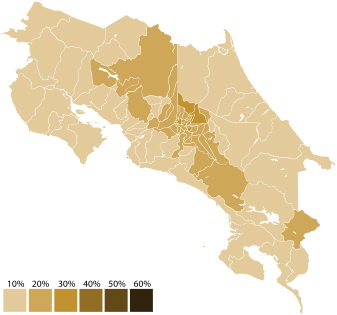 PAC strength by canton
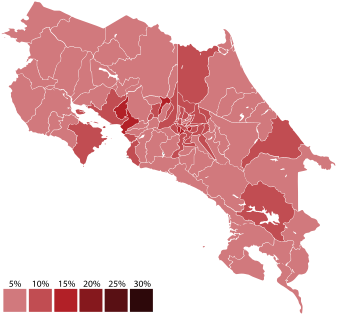 ML strength by canton
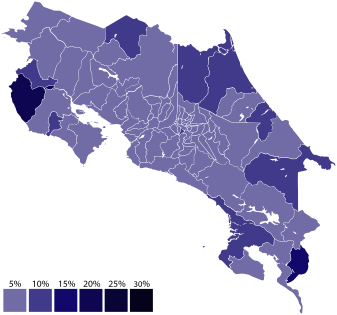 PRC strength by canton
Source: Atlas Electoral
References
- Nohlen, D (2005) Elections in the Americas: A data handbook, Volume I, p155 ISBN 978-0-19-928357-6
- Nohlen, p. 150.
- "Election profile: Costa Rica". International Foundation for Electoral Systems. 1 September 2006. Retrieved 26 June 2011.
- Landsford, Tom. Political Handbook of the World 2014. Retrieved 13 March 2016.
- Landsford, Tom. Political Handbook of the World 2012. Retrieved 13 March 2016.
- Greenspana, Eliot; Gill, Nicholas; O'Malley, Charlie; Gilsenan, Patrick; Perill, Jisel. Elecciones legislativas de Costa Rica de 2002. Frommer's Central America.
- "5 February 2002 Legislative Assembly Election Results - Costa Rica Totals". Election Resources. Retrieved 13 March 2016.
- Lopez, Jaime (July 18, 2013). "Civic Groups Move Against Gay Marriage in Costa Rica". Costa Rica Star. Retrieved 13 March 2016.
- Nohlen, pp. 156–157.
| Head of State elections | |
|---|---|
| Presidential elections | |
| Parliamentary elections | |
| Local elections | |
| Referendums | |
See also: Elections in the Federal Republic of Central America | |