1953 Costa Rican general election
General elections were held in Costa Rica on 26 July 1953.[1] José Figueres Ferrer of the National Liberation Party won the presidential election, whilst his party also won the parliamentary election. Voter turnout was 67.2 percent in the presidential election and 67.5 percent in the parliamentary election.[2]
| ||||||||||||||||||||||||||
| Turnout | 67% | |||||||||||||||||||||||||
|---|---|---|---|---|---|---|---|---|---|---|---|---|---|---|---|---|---|---|---|---|---|---|---|---|---|---|
|
| ||||||||||||||||||||||||||
Presidential election | ||||||||||||||||||||||||||
| ||||||||||||||||||||||||||
 Provinces won by Figueres | ||||||||||||||||||||||||||
| ||||||||||||||||||||||||||
Legislative election | ||||||||||||||||||||||||||
This lists parties that won seats. See the complete results below. | ||||||||||||||||||||||||||

 |
|---|
| This article is part of a series on the politics and government of Costa Rica |
|
Legislature
|
|
|
|
|
|
|
This was Costa Rica’s first election since the end of the 1948 Civil War, and democratic guarantees were not fully restored.
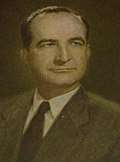
José Figueres, the caudillo of the victorious National Liberation Army faction in the Civil War, was the candidate of the newly founded National Liberation Party (PLN).[3] Liberal Mario Echandi tried to be the candidate from then-ruling National Union Party (PUN), but his candidacy was denied by the Electoral Tribunal due to purported irregularities in the adherents' signatures.[3] This move was highly criticized by Figueres' opponents as an action in favor of Figueres' candidacy.[3]
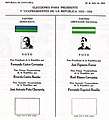
As PUN was unable to participate, the only other candidacy alternate to Figueres was made by the Democratic Party, which nominated wealthy industrial magnate Fernando Castro Cervantes.[3] The three parties—PLN, PUN and Democratic—were all formerly united in opposition against the 1940s governments of Rafael Angel Calderón and his allies, who were viewed as having caused the civil war. Yet, after the war, such unification ceased.[3]
The losing sides in the civil war, mostly the Republicans (Calderón supporters) and the Communists, were unable to participate as the Republicans' party was disbanded and the Communist Party was constitutionally outlawed.[3] The Republicans were nonetheless allowed to participate in the legislative ballot with a provincial party in San José called the "Independent" Republican Party, and thereby gained some seats. As expected, Figueres won by a landslide victory.[3]
Results
President
| Candidate | Party | Votes | % | ||
|---|---|---|---|---|---|
| José Figueres Ferrer | National Liberation Party | 123,444 | 64.7 | ||
| Fernando Castro Cervantes | Democratic Party | 67,324 | 35.3 | ||
| Invalid/blank votes | 6,721 | – | |||
| Total | 197,489 | 100 | |||
| Registered voters/turnout | 295,925 | 67 | |||
| Source: Nohlen | |||||
By province
| Province | Figueres % | Castro % |
|---|---|---|
| 64.1 | 35.9 | |
| 67.8 | 32.2 | |
| 75.0 | 25.0 | |
| 62.5 | 37.5 | |
| 58.4 | 41.6 | |
| 54.4 | 45.6 | |
| 57.9 | 42.1 | |
| Total | 64.7 | 35.3 |
Parliament
 | |||||
| Party | Votes | % | Seats | +/– | |
|---|---|---|---|---|---|
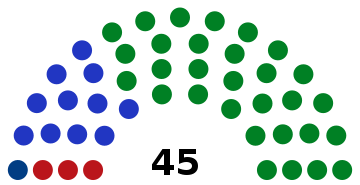
| National Liberation Party | 114,043 | 64.7 | 30 | +27 | |
| Democratic Party | 67,324 | 21.2 | 11 | New | |
| Independent National Republican Party | 12,696 | 7.2 | 3 | New | |
| National Union Party | 12,069 | 6.9 | 1 | –33 | |
| Invalid/blank votes | 22,140 | – | – | – | |
| Total | 198,270 | 100 | 45 | 0 | |
| Registered voters/turnout | 295,925 | 67 | – | – | |
| Source: TSE | |||||
By province
| Province | PLN | PD | PRN | PUN | ||||
|---|---|---|---|---|---|---|---|---|
| % | S | % | S | % | S | % | S | |
| 64.7 | 10 | 11.4 | 2 | 17.3 | 3 | 6.6 | 1 | |
| 67.8 | 6 | 26.4 | 2 | - | - | 5.7 | 0 | |
| 75.5 | 5 | 18.2 | 1 | - | - | 6.3 | 0 | |
| 62.2 | 2 | 31.1 | 1 | - | - | 6.3 | 0 | |
| 59.1 | 3 | 36.0 | 2 | - | - | 4.9 | 0 | |
| 55.0 | 1 | 30.7 | 1 | - | - | 14.3 | 0 | |
| 53.2 | 3 | 36.0 | 2 | - | - | 10.8 | 0 | |
| Total | 64.7 | 30 | 21.2 | 11 | 7.2 | 3 | 6.9 | 1 |
Local governments
| Parties | Popular vote | Alderpeople | Municipal Syndics | |||||||||||
|---|---|---|---|---|---|---|---|---|---|---|---|---|---|---|
| Votes | % | Total | Total | |||||||||||
| National Liberation Party (PLN) | 115,553 | 64,58 | 163 | 310 | ||||||||||
| Democratic Party (PD) | 42,002 | 23,47 | 64 | 14 | ||||||||||
| Independent National Republican Party (PRN) | 10,641 | 5,95 | 5 | 0 | ||||||||||
| National Union Party (PUN) | 10,636 | 5,94 | 5 | 0 | ||||||||||
| Turrialba Independent Union Party (PUIT) | 103 | 0,06 | 0 | 0 | ||||||||||
| Total | 178,935 | 100.00 | 237 | 324 | ||||||||||
| Invalid votes | 19,381 | 6.60 | ||||||||||||
| Votes cast / turnout | 198,316 | 67.53 | ||||||||||||
| Abstentions | 95,362 | 32,47 | ||||||||||||
| Registered voters | 293,678 | 100% | ||||||||||||
| Sources[4] | ||||||||||||||
Ballot
References
- Nohlen, D (2005) Elections in the Americas: A data handbook, Volume I, p155 ISBN 978-0-19-928357-6
- Nohlen, p156
- Hernández Naranjo, Gerardo. "Reseña de las elecciones presidenciales de 1953" (PDF) (in Spanish). Archived from the original (PDF) on 2015-10-01. Retrieved 13 April 2016. Cite journal requires
|journal=(help) - "Elecciones Regidurías 1953". tse.go.cr (in Spanish). Tribunal Supremo de Elecciones. Retrieved 21 May 2020.
| Head of State elections | |
|---|---|
| Presidential elections | |
| Parliamentary elections | |
| Local elections | |
| Referendums | |
See also: Elections in the Federal Republic of Central America | |