1974 Costa Rican general election
General elections were held in Costa Rica on 3 February 1974.[1] Daniel Oduber Quirós of the National Liberation Party won the presidential election, whilst his party also won the parliamentary election. Voter turnout was 79.9%.[2]
| ||||||||||||||||||||||||||||||||||||||||||||||
| Turnout | 79.9% | |||||||||||||||||||||||||||||||||||||||||||||
|---|---|---|---|---|---|---|---|---|---|---|---|---|---|---|---|---|---|---|---|---|---|---|---|---|---|---|---|---|---|---|---|---|---|---|---|---|---|---|---|---|---|---|---|---|---|---|
| ||||||||||||||||||||||||||||||||||||||||||||||
 In green provinces won by Oduber | ||||||||||||||||||||||||||||||||||||||||||||||
| ||||||||||||||||||||||||||||||||||||||||||||||
Legislative election | ||||||||||||||||||||||||||||||||||||||||||||||
This lists parties that won seats. See the complete results below. | ||||||||||||||||||||||||||||||||||||||||||||||
.jpg)


 |
|---|
| This article is part of a series on the politics and government of Costa Rica |
|
Legislature
|
|
|
|
|
|
|
The Left was theoretically outlawed as the Constitution didn't allow the existence of Marxist parties, but the prohibition was not endorsed in practice by that time and even was lifted with a Constitutional reform for the next election.[3]
Campaign
The government was affected in its popularity by the “Vesco Case” a corruption case involving then president José Figueres and his dubious connections with international criminal Robert Vesco, which caused heat for ruling party's candidate Daniel Oduber.[3] Rodrigo Carazo, a former member of PLN and Congressman run as an independent candidate. Carazo had problems with Figueres when they both face each other in a primary election previously. Carazo promised to expel Vesco if he won, he also received the endorsement of former president José Trejos.[3]
Another heated issue was Communism in general, as the election was in the middle of the Cold War. Topics like the diplomatic relationships with the USSR (which candidate Jorge González Martén swear will end in his government). The Catholic Church made a public statement criticizing both Communism and savage Capitalism and calling for a third option.[3] Both PLN (Social Democrats) and the Christian Democratic Party claim to be that option. The traditional Left represented by Manuel Mora’s Socialist Action Party defended itself arguing that a previous archbishop Victor Manuel Sanabria expressed that Costa Rican Catholics had no quarrel in being members of the Communist Party.[3] The far-right Free Costa Rica Movement also made a very expensive campaign against Mora's party on the media at the time.[3]
Another notorious candidate was Gerardo Wenceslao Villalobos, aka GW, a very eccentric candidate nominated by the Democratic Party. Villalobos did a lot of crazy stunts and unusual activities for a candidate, like boxing and wrestling matches or trying to jump in parachute.[3]
Results
President
| Candidate | Party | Votes | % | ||
|---|---|---|---|---|---|
| Daniel Oduber Quirós | National Liberation Party | 294,609 | 43.4 | ||
| Fernando Trejos Escalante | National Unification Party | 206,149 | 30.4 | ||
| Jorge González Martén | National Independent Partyes | 73,788 | 10.9 | ||
| Rodrigo Carazo Odio | Democratic Renewal Partyes | 61,820 | 9.2 | ||
| Gerardo Villalobos Garita | Democratic Party | 18,832 | 2.8 | ||
| Manuel Mora Valverde | Socialist Action Partyes | 16,081 | 2.4 | ||
| Jorge Arturo Monge Zamora | Christian Democratic Partyes | 3,461 | 0.5 | ||
| José Francisco Aguilar Bulgarelli | Costa Rican Socialist Partyes | 3,417 | 0.5 | ||
| Invalid/blank votes | 21,163 | – | |||
| Total | 699,340 | 100 | |||
| Registered voters/turnout | 875,041 | 79.9 | |||
| Source: Nohlen; Election Resources | |||||
By province
| Province | Oduber % | Trejos % | González % | Carazo % | Villalobos % | Mora % | Monge % | Aguilar % |
|---|---|---|---|---|---|---|---|---|
| 42.7 | 29.4 | 9.0 | 12.2 | 3.8 | 2.0 | 0.5 | 0.5 | |
| 45.6 | 28.4 | 12.5 | 9.8 | 1.7 | 1.1 | 0.4 | 0.5 | |
| 43.6 | 29.4 | 15.9 | 5.9 | 2.7 | 1.5 | 0.6 | 0.5 | |
| 42.9 | 29.9 | 11.0 | 9.5 | 3.0 | 2.5 | 0.7 | 0.4 | |
| 39.5 | 36.3 | 11.0 | 4.5 | 2.2 | 5.5 | 0.5 | 0.5 | |
| 38.8 | 39.4 | 7.7 | 3.4 | 2.4 | 7.1 | 0.5 | 0.6 | |
| 49.6 | 30.0 | 11.5 | 4.9 | 0.8 | 2.0 | 0.8 | 0.5 | |
| Total | 43.4 | 30.4 | 10.9 | 9.1 | 2.8 | 2.4 | 0.5 | 0.5 |
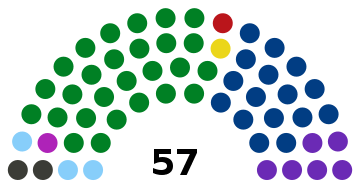
Parliament
 | |||||
| Party | Votes | % | Seats | +/– | |
|---|---|---|---|---|---|
| National Liberation Party | 271,867 | 40.9 | 27 | -5 | |
| National Unification Party | 164,323 | 24.7 | 16 | -6 | |
| National Independent Partyes | 66,222 | 10.0 | 6 | New | |
| Democratic Renewal Partyes | 51,082 | 7.7 | 3 | New | |
| National Republican Party | 32,475 | 4.9 | 1 | New | |
| Socialist Action Partyes | 29,310 | 4.4 | 2 | 0 | |
| Democratic Party | 14,161 | 2.1 | 1 | New | |
| Christian Democratic Partyes | 13,880 | 2.1 | 0 | -1 | |
| Cartago Agrarian Union Party | 8,074 | 1.2 | 1 | +1 | |
| Costa Rican Socialist Partyes | 6,032 | 0.9 | 0 | New | |
| Costa Rican Peoples' Front | 4,448 | 0.7 | 0 | New | |
| Independent Party | 3,282 | 0.5 | 0 | New | |
| Invalid/blank votes | 34,078 | – | – | – | |
| Total | 699,042 | 100 | 57 | 0 | |
| Registered voters/turnout | 875,041 | 79.9 | – | – | |
| Source: TSE; Election Resources | |||||
By province
| Province | PLN | PUN | PNI | PRD | PRN | PASO | PD | PDC | PUAC | PSC | FPCR | PI | ||||||||||||
|---|---|---|---|---|---|---|---|---|---|---|---|---|---|---|---|---|---|---|---|---|---|---|---|---|
| % | S | % | S | % | S | % | S | % | S | % | S | % | S | % | S | % | S | % | S | % | S | % | S | |
| 40.1 | 9 | 23.4 | 5 | 8.7 | 2 | 10.1 | 2 | 5.6 | 1 | 4.3 | 1 | 2.8 | 1 | 1.7 | 0 | - | - | 1.4 | 0 | 1.4 | 0 | 0.6 | 0 | |
| 44.3 | 5 | 25.1 | 3 | 11.9 | 2 | 9.2 | 1 | 2.7 | 0 | 1.9 | 0 | 3.0 | 0 | 0.8 | 0 | - | - | 0.8 | 0 | - | - | 0.3 | 0 | |
| 38.1 | 3 | 23.6 | 2 | 11.9 | 1 | 3.9 | 0 | 2.7 | 0 | 2.3 | 0 | 1.3 | 0 | 3.8 | 0 | 11.1 | 1 | 0.6 | 0 | - | - | 0.7 | 0 | |
| 41.1 | 2 | 22.7 | 1 | 9.8 | 0 | 7.4 | 0 | 7.4 | 0 | 5.7 | 0 | 1.5 | 0 | 3.5 | 0 | - | - | 0.7 | 0 | - | - | 0.3 | 0 | |
| 38.3 | 3 | 29.8 | 2 | 10.6 | 1 | 4.0 | 0 | 5.7 | 0 | 7.3 | 1 | 1.1 | 0 | 1.4 | 0 | - | - | 0.5 | 0 | 0.8 | 0 | 0.6 | 0 | |
| 36.9 | 2 | 32.6 | 1 | 7.1 | 0 | 2.3 | 0 | 5.0 | 0 | 13.9 | 0 | 0.9 | 0 | 0.8 | 0 | - | - | - | - | - | - | 0.5 | 0 | |
| 46.0 | 3 | 23.9 | 2 | 10.4 | 1 | 5.1 | 0 | 5.8 | 0 | 3.2 | 0 | 0.4 | 0 | 4.4 | 0 | - | - | 0.3 | 0 | - | - | 0.3 | 0 | |
| Total | 40.9 | 27 | 24.7 | 16 | 10.0 | 6 | 7.7 | 3 | 4.9 | 1 | 4.4 | 2 | 2.1 | 1 | 2.1 | 0 | 1.2 | 1 | 0.9 | 0 | 0.7 | 0 | 0.5 | 0 |
Local governments
Vote percentage
| Parties | Popular vote | Alderpeople | Municipal Syndics | |||||||||||
|---|---|---|---|---|---|---|---|---|---|---|---|---|---|---|
| Votes | % | ±pp | Total | +/- | Total | +/- | ||||||||
| National Liberation Party (PLN) | 281,067 | 42.44 | -9.56 | 225 | +38 | 350 | +34 | |||||||
| National Unification Party (PUN) | 174,178 | 26.30 | -11.08 | 150 | +17 | 37 | -9 | |||||||
| National Independent Party (PNI) | 67,802 | 10.24 | New | 48 | New | 2 | New | |||||||
| Democratic Renewal Party (PRD) | 57,036 | 8.61 | New | 24 | New | 0 | New | |||||||
| National Republican Party (PRN) | 30,551 | 4.61 | New | 12 | New | 1 | New | |||||||
| Socialist Action Party (PASO) | 27,614 | 4.17 | +0.40 | 8 | +4 | 0 | 0 | |||||||
| Christian Democratic Party (PDC) | 14,215 | 2.15 | -0.34 | 0 | -2 | 0 | 0 | |||||||
| Costa Rican Socialist Party (PSC) | 4,720 | 0.71 | New | 0 | New | 0 | New | |||||||
| Democratic Party (PD) | 2,456 | 0.37 | New | 0 | New | 0 | New | |||||||
| Costa Rican Peoples' Front (FPCR) | 1,588 | 0.24 | New | 0 | New | 0 | New | |||||||
| Independent Party (PI) | 1,035 | 0.16 | New | 0 | New | 0 | New | |||||||
| Total | 662,262 | 100.00 | - | 467 | +138 | 390 | +27 | |||||||
| Invalid votes | 36,949 | 5.28 | ||||||||||||
| Votes cast / turnout | 699,211 | 79.02 | ||||||||||||
| Abstentions | 175,830 | 20.98 | ||||||||||||
| Registered voters | 875,041 | 100% | ||||||||||||
| Sources[4] | ||||||||||||||
Ballot
References
- Nohlen, D (2005) Elections in the Americas: A data handbook, Volume I, p155 ISBN 978-0-19-928357-6
- Nohlen, p157
- Hernández Naranjo, Gerardo. "Reseña de las elecciones presidenciales de 1974" (PDF) (in Spanish). Archived from the original (PDF) on 2016-02-16. Retrieved 13 April 2016. Cite journal requires
|journal=(help) - "Elecciones Regidurías 1974". tse.go.cr (in Spanish). Tribunal Supremo de Elecciones. Retrieved 21 May 2020.
| Head of State elections | |
|---|---|
| Presidential elections | |
| Parliamentary elections | |
| Local elections | |
| Referendums | |
See also: Elections in the Federal Republic of Central America | |