1970 Costa Rican general election
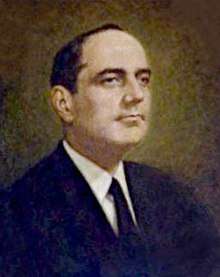
General elections were held in Costa Rica on 1 February 1970.[1] Former President José Figueres Ferrer of the National Liberation Party won the presidential election, whilst his party also won the parliamentary election. Voter turnout was 83.3%.[2]
| ||||||||||||||||||||||||||
| Turnout | 83.3% | |||||||||||||||||||||||||
|---|---|---|---|---|---|---|---|---|---|---|---|---|---|---|---|---|---|---|---|---|---|---|---|---|---|---|
| ||||||||||||||||||||||||||
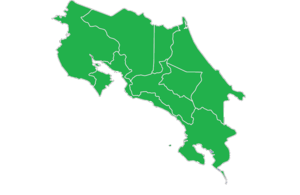 In green provinces won by Figueres | ||||||||||||||||||||||||||
| ||||||||||||||||||||||||||
Legislative election | ||||||||||||||||||||||||||
This lists parties that won seats. See the complete results below. | ||||||||||||||||||||||||||

 |
|---|
| This article is part of a series on the politics and government of Costa Rica |
|
Legislature
|
|
|
|
|
|
|
On 25 June 1969, the Legislative Assembly of Costa Rica reformed the Constitution to prohibit presidential reelection, but as any legal reform was retroactive, all previous presidents could be candidates one more time.[3] Two former presidents José Figueres Ferrer and Mario Echandi Jiménez were the two main candidates in the election.
Echandi was nominated by then ruling party National Unification (PUN), a right-wing conservative party made out of the merger of the Republicans (Calderonistas) and the National Union (Ulatistas). However, the union was starting to break and Ulate unsuccessfully presented a separate list of Unification candidates for Congress.[3] In the main opposition force and by then dominant-party PLN, the nominee had been the historical leader and twice president before José Figueres. Figueres was selected after a primary election (or National Convention as they're known in Costa Rica) in which he defeated then Congressman and former Secretary General of the party, Rodrigo Carazo. The convention was particularly harsh and after the results, Figueres did not include any of Carazo supporters in power positions (as was a traditional courtesy), something that future president Carazo resented and which caused him to eventually leave the party.[3]
National Unification’s forces, however, weren’t in better conditions. Ulate did not endorse Echandi and left the coalition.[3] Others that left were Virgilio Calvo and Mariano Zúñiga from the Calderonist faction that made their own new party, the National Front (aka “Third Front”). Ulate promised them the support of this party, but PUN’s General Assembly did not follow his lead and endorsed Echandi’s candidacy. The group had minimal impact in the election.[3]
Other minor parties were the Christian Democratic Party, led by physician Jorge Arturo Monge Zamora, and the Socialist Action Party led by former PLN member Marcial Aguiluz Orellana and historical Communist leader Manuel Mora. Communism was still illegal at the time, but the prohibition was flexible on non-explicitly Marxist parties, and several leaders were already questioning the antidemocratic nature of the measure and calling for it to be lifted, including Figueres himself.
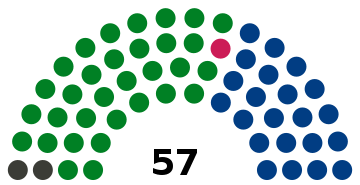
Figueres won by a very broad margin over Echandi, 54% over 41%, and his party, the PLN, won a majority in Parliament. Socialists and Christian Democrats also achieved representation.
Results
President
| Candidate | Party | Votes | % | ||
|---|---|---|---|---|---|
| José Figueres Ferrer | National Liberation Party | 295,883 | 54.8 | ||
| Mario Echandi Jiménez | National Unification Party | 222,372 | 41.2 | ||
| Virgilio Calvo Sánchez | National Frontes | 9,554 | 1.8 | ||
| Lisímaco Leiva Cubillo | Socialist Action Partyes | 7,221 | 1.3 | ||
| Jorge Arturo Monge Zamora | Christian Democratic Partyes | 5,015 | 0.9 | ||
| Invalid/blank votes | 22,721 | – | |||
| Total | 562,766 | 100 | |||
| Registered voters/turnout | 675,285 | 83.3 | |||
| Source: Nohlen; Election Resources | |||||
By province
| Province | Figueres % | Echandi % | Calvo % | Leiva % | Monge % |
|---|---|---|---|---|---|
| 55.1 | 40.3 | 1.8 | 1.6 | 1.3 | |
| 54.6 | 42.2 | 2.0 | 0.7 | 0.6 | |
| 59.6 | 37.2 | 1.5 | 0.9 | 0.8 | |
| 52.3 | 42.9 | 2.0 | 1.3 | 1.5 | |
| 50.6 | 44.9 | 1.8 | 2.4 | 0.4 | |
| 48.1 | 47.5 | 1.7 | 2.4 | 0.3 | |
| 57.0 | 40.5 | 1.4 | 0.7 | 0.4 | |
| Total | 54.8 | 41.2 | 1.8 | 1.3 | 0.9 |
Parliament
 | |||||
| Party | Votes | % | Seats | +/– | |
|---|---|---|---|---|---|
| National Liberation Party | 269,038 | 50.7 | 32 | +3 | |
| National Unification Party | 190,387 | 35.9 | 22 | -4 | |
| Socialist Action Partyes | 29,133 | 5.5 | 2 | New | |
| National Frontes | 16,392 | 3.1 | 0 | New | |
| Christian Democratic Partyes | 13,489 | 2.5 | 1 | New | |
| National Union Party | 6,105 | 1.2 | 0 | New | |
| Costa Rican Renewal Movement | 3,279 | 0.6 | 0 | New | |
| Cartago Agrarian Union Party | 2,394 | 0.5 | 0 | New | |
| Puntarenense Renewal Party | 208 | 0.1 | 0 | New | |
| Invalid/blank votes | 32,253 | – | – | – | |
| Total | 562,678 | 100 | 57 | 0 | |
| Registered voters/turnout | 675,285 | 83.3 | – | – | |
| Source: TSE; Election Resources | |||||
By province
| Province | PLN | PUN | PASO | FN | PDC | PUN | MRC | PUAC | PRP | |||||||||
|---|---|---|---|---|---|---|---|---|---|---|---|---|---|---|---|---|---|---|
| % | S | % | S | % | S | % | S | % | S | % | S | % | S | % | S | % | S | |
| 50.3 | 11 | 33.8 | 7 | 7.9 | 2 | 2.5 | 0 | 3.5 | 1 | 1.4 | 0 | 0.7 | 0 | - | - | - | - | |
| 52.3 | 6 | 38.5 | 4 | 2.4 | 0 | 3.9 | 0 | 1.4 | 0 | 1.3 | 0 | 0.2 | 0 | - | - | - | - | |
| 53.8 | 4 | 32.0 | 3 | 3.0 | 0 | 2.4 | 0 | 3.4 | 0 | 0.7 | 0 | 0.7 | 0 | 4.0 | 0 | - | - | |
| 48.2 | 2 | 37.2 | 1 | 5.4 | 0 | 4.3 | 0 | 4.0 | 0 | 0.4 | 0 | 0.4 | 0 | - | - | - | - | |
| 47.1 | 4 | 40.1 | 3 | 6.2 | 0 | 3.2 | 0 | 0.7 | 0 | 0.8 | 0 | 1.1 | 0 | - | - | 0.4 | 0 | |
| 44.2 | 2 | 41.3 | 1 | 9.9 | 0 | 3.2 | 0 | 0.4 | 0 | 0.7 | 0 | 0.3 | 0 | - | - | - | - | |
| 54.0 | 3 | 37.5 | 3 | 1.5 | 0 | 4.1 | 0 | 0.8 | 0 | 1.3 | 0 | 0.9 | 0 | - | - | - | - | |
| Total | 50.7 | 32 | 35.9 | 22 | 5.5 | 2 | 3.1 | 0 | 2.5 | 1 | 1.2 | 0 | 0.6 | 0 | 0.5 | 0 | 0.1 | 0 |
Local governments
Vote percentage
| Parties | Popular vote | Alderpeople | Municipal Syndics | |||||||||||
|---|---|---|---|---|---|---|---|---|---|---|---|---|---|---|
| Votes | % | ±pp | Total | +/- | Total | +/- | ||||||||
| National Liberation Party (PLN) | 276,124 | 52.00 | +2.68 | 189 | +37 | 316 | +114 | |||||||
| National Unification Party (PUN) | 198,520 | 37.38 | -8.91 | 133 | -7 | 46 | -86 | |||||||
| Socialist Action Party (PASO) | 20,043 | 3.77 | New | 4 | New | 0 | New | |||||||
| National Front (FN) | 15,704 | 2.96 | New | 1 | New | 1 | New | |||||||
| Christian Democratic Party (PDC) | 13,249 | 2.49 | New | 2 | New | 0 | New | |||||||
| National Union Party (PUN) | 3,908 | 0.74 | New | 0 | New | 0 | New | |||||||
| Costa Rican Renewal Movement (MRC) | 2,192 | 0.41 | New | 0 | New | 0 | New | |||||||
| Desamparadenean Independent Union Party (PUDI) | 1,244 | 0.23 | New | 0 | New | 0 | New | |||||||
| Puntarenense Renewal Party (PRP) | 64 | 0.01 | New | 0 | New | 0 | New | |||||||
| Total | 531,048 | 100.00 | - | 329 | +36 | 363 | +29 | |||||||
| Invalid votes | 31,681 | 5.63 | ||||||||||||
| Votes cast / turnout | 562,729 | 83.39 | ||||||||||||
| Abstentions | 112,056 | 16.61 | ||||||||||||
| Registered voters | 674,785 | 100% | ||||||||||||
| Sources[4] | ||||||||||||||
Ballot

References
- Nohlen, D (2005) Elections in the Americas: A data handbook, Volume I, p155 ISBN 978-0-19-928357-6
- Nohlen, p156
- Hernández Naranjo, Gerardo. "Reseña de las elecciones presidenciales de 1970" (PDF) (in Spanish). Archived from the original (PDF) on 2016-03-04. Retrieved 13 April 2016. Cite journal requires
|journal=(help) - "Elecciones Regidurías 1970". tse.go.cr (in Spanish). Tribunal Supremo de Elecciones. Retrieved 21 May 2020.
| Head of State elections | |
|---|---|
| Presidential elections | |
| Parliamentary elections | |
| Local elections | |
| Referendums | |
See also: Elections in the Federal Republic of Central America | |