West Coast-Tasman
West Coast-Tasman is a New Zealand parliamentary electorate. Since its formation for the 1996 election, it has been held by Damien O'Connor of the Labour Party apart from one parliamentary term, when National's Chris Auchinvole was the representative from 2008 to 2011.
Population centres
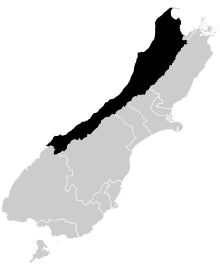
West Coast-Tasman is the second-largest general electorate in New Zealand, behind Clutha-Southland. It is one of the longest. The Representation Commission last adjusted the boundaries in the 2007 review, which first applied at the 2008 election, when the northern boundary moved closer to Nelson, and Wakefield, Foxhill and Belgrove were added.[1] The electorate was not changed in the 2013/14 review.[2]
The electorate includes the following population centres:
History
The electorate was formed in 1996 for the Mixed Member Proportional (MMP) voting system by combining the former Tasman and West Coast electorates.
Damien O'Connor was the first representative and he held the electorate until the 2008 general election, when he was beaten by National candidate Chris Auchinvole, who had previously been a list MP. Auchinvole's majority was 971.[3] His position on the Labour Party list meant that O'Connor couldn't return to Parliament immediately. When the list MP Michael Cullen retired in May 2009, O'Connor regained his position as Member of the House of Representatives because he was the highest-ranked candidate on the list not already an MP.[4] In contrast to the overall trend, he regained the electorate in the 2011 election.[5]
Auchinvole retired from politics at the end of the 2011–2014 parliamentary term, and former Mayor of Westland District, Maureen Pugh, gained the nomination for the National Party.[6][7] O'Connor was once again successful. Based on preliminary results for the 2014 election, Pugh was the lowest-ranked National Party list member who was returned to Parliament,[8][9] but when the final results were released two weeks later, National had lost one list seat and Pugh did not get returned to Parliament.[10]
Members of Parliament
West Coast-Tasman has been represented by two electorate MPs so far:
Key
| Election | Winner | |
|---|---|---|
| 1996 election | Damien O'Connor | |
| 1999 election | ||
| 2002 election | ||
| 2005 election | ||
| 2008 election | Chris Auchinvole | |
| 2011 election | Damien O'Connor | |
| 2014 election | ||
| 2017 election | ||
List MPs
Members of Parliament elected from party lists in elections where that person also unsuccessfully contested the West Coast-Tasman electorate. Unless otherwise stated, all MPs terms began and ended at general elections.
| Election | Winner | |
|---|---|---|
| 2005 election | Chris Auchinvole | |
| 2008 election | Kevin Hague | |
| 2009 | Damien O'Connor1 | |
| 2011 election | Chris Auchinvole | |
| Kevin Hague | ||
| 2014 election | Kevin Hague | |
| 2016 | Maureen Pugh2 | |
| 2018 | Maureen Pugh3 | |
1In the 2008 election Damien O'Connor's list position of 37 meant he was not returned until Michael Cullen resigned in May 2009.
2Maureen Pugh's list position of 52 meant she became elected after Tim Groser resigned in December 2015. She assumed office in early 2016 and was not returned to Parliament at the 2017 election, until the resignation of Bill English.
3Maureen Pugh's list position of 44 meant she became elected after Bill English resigned in February 2018. She assumed office in early 2018.
Election results
2017 election
| General election, 2017: West Coast-Tasman[11] | |||||||||
|---|---|---|---|---|---|---|---|---|---|
| Notes: |
Blue background denotes the winner of the electorate vote.
| ||||||||
| Party | Candidate | Votes | % | ±% | Party votes | % | ±% | ||
| Labour | 18,488 | 49.54 | +2.74 | 14,015 | 37.0 | +3.75 | |||
| National | Maureen Pugh[lower-alpha 1] | 12,895 | 34.55 | -0.81 | 15,122 | 39.9 | -4.45 | ||
| Green | Kate Fulton | 2,230 | 5.98 | -0.69 | 3,117 | 8.26 | -4.66 | ||
| NZ First | Jackie Farrelly | 1,787 | 4.79 | — | 3,536 | 9.37 | +0.61 | ||
| Ban 1080 | Pete Salter | 1,470 | 3.94 | -2.54 | 359 | 0.95 | -0.66 | ||
| ACT | Zeb Markland | 154 | 0.41 | — | 137 | 0.36 | +0.10 | ||
| Independent | Steven Wilkinson | 137 | 0.37 | -0.27 | |||||
| GOdsownNZ | Claire Holley | 72 | 0.19 | -2.69[lower-alpha 2] | |||||
| Money Free | Liam Anderson | 50 | 0.13 | — | |||||
| Democrats | Jack Collin | 38 | 0.10 | — | 21 | 0.06 | -0.01 | ||
| Opportunities | 982 | 2.60 | — | ||||||
| Legalise Cannabis | 173 | 0.46 | -0.12 | ||||||
| Conservative | 97 | 0.26 | -2.62 | ||||||
| Māori | 73 | 0.19 | -0.09 | ||||||
| Outdoors | 36 | 0.10 | - | ||||||
| United Future | 26 | 0.07 | -0.13 | ||||||
| People's Party | 18 | 0.05 | — | ||||||
| Mana | 10 | 0.03 | -0.72[lower-alpha 3] | ||||||
| Internet | 2 | 0.01 | -0.74[lower-alpha 4] | ||||||
| Informal votes | 302 | 149 | |||||||
| Total Valid votes | 37,321 | 37,724 | |||||||
| Turnout | 37,873 | ||||||||
| Labour hold | Majority | 5,593 | 14.99 | +3.55 | |||||
2014 election
| General election, 2014: West Coast-Tasman[12] | |||||||||
|---|---|---|---|---|---|---|---|---|---|
| Notes: |
Blue background denotes the winner of the electorate vote.
| ||||||||
| Party | Candidate | Votes | % | ±% | Party votes | % | ±% | ||
| Labour | 16,747 | 46.80 | -0.71 | 8,438 | 23.40 | -3.85 | |||
| National | Maureen Pugh | 12,653 | 35.36 | -4.49 | 16,058 | 44.54 | -1.25 | ||
| Green | Kevin Hague | 2,385 | 6.67 | +0.23 | 4,658 | 12.92 | -1.26 | ||
| Ban 1080 | Pete Salter | 2,318 | 6.48 | +6.48 | 942 | 2.61 | +2.61 | ||
| Conservative | Claire Holley | 1,031 | 2.88 | +1.00 | 1,837 | 5.10 | +1.92 | ||
| Independent | Steven Wilkinson | 228 | 0.64 | -0.72[lower-alpha 5] | |||||
| Money Free | Laurence Bloomert | 50 | 0.14 | +0.14 | |||||
| NZ First | 3,123 | 8.66 | +2.94 | ||||||
| Internet Mana | 271 | 0.75 | +0.48 | ||||||
| Legalise Cannabis | 210 | 0.58 | -0.16 | ||||||
| Māori | 102 | 0.28 | -0.15 | ||||||
| ACT | 94 | 0.26 | -0.56 | ||||||
| United Future | 71 | 0.20 | -1.19 | ||||||
| Democrats | 25 | 0.07 | -0.03 | ||||||
| Independent Coalition | 14 | 0.04 | +0.04 | ||||||
| Civilian | 11 | 0.03 | +0.03 | ||||||
| Focus | 7 | 0.02 | +0.02 | ||||||
| Informal votes | 373 | 192 | |||||||
| Total Valid votes | 35,785 | 36,053 | |||||||
| Labour hold | Majority | 4,094 | 11.44 | +3.78 | |||||
2011 election
| General election, 2011: West Coast-Tasman[13] | |||||||||
|---|---|---|---|---|---|---|---|---|---|
| Notes: |
Blue background denotes the winner of the electorate vote.
| ||||||||
| Party | Candidate | Votes | % | ±% | Party votes | % | ±% | ||
| Labour | Damien O'Connor | 15,753 | 47.51 | +3.85 | 9,200 | 27.25 | -6.22 | ||
| National | 13,214 | 39.85 | -6.66 | 15,462 | 45.79 | +1.72 | |||
| Green | Kevin Hague | 2,123 | 6.40 | +0.23 | 4,787 | 14.18 | +3.32 | ||
| Conservative | Claire Holley | 623 | 1.88 | +1.88 | 1,075 | 3.18 | +3.18 | ||
| ACT | Allan Birchfield | 487 | 1.47 | +1.47 | 278 | 0.82 | -1.34 | ||
| United Future | Clyde Graf | 454 | 1.37 | +0.63 | 468 | 1.39 | +0.23 | ||
| Legalise Cannabis | Steven Wilkinson | 450 | 1.36 | -0.47 | 249 | 0.74 | +0.14 | ||
| Youth | Robert Terry | 52 | 0.16 | +0.01 | |||||
| NZ First | 1,931 | 5.72 | +1.91 | ||||||
| Māori | 145 | 0.43 | -0.20 | ||||||
| Mana | 91 | 0.27 | +0.27 | ||||||
| Democrats | 33 | 0.10 | -0.01 | ||||||
| Libertarianz | 31 | 0.09 | +0.03 | ||||||
| Alliance | 16 | 0.05 | -0.04 | ||||||
| Informal votes | 628 | 288 | |||||||
| Total Valid votes | 33,156 | 33,766 | |||||||
| Labour gain from National | Majority | 2,539 | 7.66 | +10.51 | |||||
Electorate (as at 26 November 2011): 44,556[14]
2008 election
| General election, 2008: West Coast-Tasman[15] | |||||||||
|---|---|---|---|---|---|---|---|---|---|
| Notes: |
Blue background denotes the winner of the electorate vote.
| ||||||||
| Party | Candidate | Votes | % | ±% | Party votes | % | ±% | ||
| National | Chris Auchinvole | 15,844 | 46.51 | +5.59 | 15,187 | 44.07 | |||
| Labour | 14,873 | 43.66 | -4.03 | 11,532 | 33.46 | ||||
| Green | Kevin Hague | 2,102 | 6.17 | +1.38 | 3,740 | 10.85 | |||
| Legalise Cannabis | Steven Wilkinson | 623 | 1.83 | +0.21 | 206 | 0.60 | |||
| McGillicuddy Serious | Steve Richards | 259 | 0.76 | ||||||
| United Future | Jocelyn Smith | 252 | 0.74 | -1.33 | 398 | 1.15 | |||
| NZ Representative Party | Reg Turner | 62 | 0.18 | ||||||
| Aotearoa NZ Youth Party | Robert Terry | 50 | 0.15 | ||||||
| NZ First | 1,313 | 3.81 | |||||||
| ACT | 744 | 2.16 | |||||||
| Kiwi | 349 | 1.01 | |||||||
| Progressive | 292 | 0.85 | |||||||
| Bill and Ben | 243 | 0.71 | |||||||
| Māori | 216 | 0.63 | |||||||
| Family Party | 122 | 0.35 | |||||||
| Democrats | 37 | 0.11 | |||||||
| Alliance | 29 | 0.08 | |||||||
| Libertarianz | 20 | 0.06 | |||||||
| Workers Party | 14 | 0.04 | |||||||
| Pacific | 10 | 0.03 | |||||||
| RAM | 5 | 0.01 | |||||||
| RONZ | 3 | 0.01 | |||||||
| Informal votes | 366 | 223 | |||||||
| Total Valid votes | 34,065 | 34,460 | |||||||
| National gain from Labour | Majority | 971 | 2.85 | ||||||
2005 election
| General election, 2005: West Coast-Tasman[16] | |||||||||
|---|---|---|---|---|---|---|---|---|---|
| Notes: |
Blue background denotes the winner of the electorate vote.
| ||||||||
| Party | Candidate | Votes | % | ±% | Party votes | % | ±% | ||
| Labour | 15,178 | 47.69 | -6.14 | 12,012 | 37.22 | ||||
| National | Chris Auchinvole | 13,024 | 40.93 | +13.05 | 12,776 | 39.59 | |||
| Green | Richard Davies | 1,526 | 4.80 | 2,913 | 9.03 | ||||
| United Future | Milton Osborne | 658 | 2.07 | 977 | 3.03 | ||||
| Legalise Cannabis | Steve Wilkinson | 515 | 1.62 | 174 | 0.54 | ||||
| Progressive | Lew Holland | 358 | 1.12 | 558 | 1.73 | ||||
| Christian Heritage | Derek Blight | 314 | 0.99 | 131 | 0.41 | ||||
| ACT | Kevin Gill | 251 | 0.79 | 348 | 1.08 | ||||
| NZ First | 2,029 | 6.29 | |||||||
| Māori | 118 | 0.37 | |||||||
| Destiny | 111 | 0.34 | |||||||
| Democrats | 30 | 0.09 | |||||||
| Libertarianz | 21 | 0.07 | |||||||
| Alliance | 20 | 0.06 | |||||||
| Family Rights | 12 | 0.04 | |||||||
| One NZ | 11 | 0.03 | |||||||
| 99 MP | 10 | 0.03 | |||||||
| Direct Democracy | 10 | 0.03 | |||||||
| RONZ | 10 | 0.03 | |||||||
| Informal votes | 354 | 131 | |||||||
| Total Valid votes | 31,824 | 32,271 | |||||||
| Labour hold | Majority | 2,154 | 6.77 | -19.18 | |||||
1999 election
Refer to Candidates in the New Zealand general election 1999 by electorate#West Coast-Tasman for a list of candidates.
Table footnotes
- ↑ Maureen Pugh's list position of 44 meant she became elected after Bill English resigned in February 2018. She assumed office in early 2018.
- ↑ Claire Holley contested the electorate in 2014 as a candidate for the Conservative Party
- ↑ 2017 Mana Party swing is relative to the votes for Internet-Mana in 2014; it shared a party list with the Internet Party in the 2014 election
- ↑ 2017 Internet Party swing is relative to the votes for Internet-Mana in 2014; it shared a party list with Mana Party in the 2014 election
- ↑ Steven Wilkinson contested the electorate in 2011 as a candidate for the Aotearoa Legalise Cannabis Party
References
- ↑ Report of the Representation Commission 2007 (PDF). Representation Commission. 14 September 2007. p. 9. ISBN 978-0-477-10414-2. Retrieved 26 September 2014.
- ↑ Report of the Representation Commission 2014 (PDF). Representation Commission. 4 April 2014. p. 10. ISBN 978-0-477-10414-2. Retrieved 26 September 2014.
- ↑ "Official Count Results -- West Coast-Tasman". Chief Electoral Office, Wellington. Retrieved 21 November 2011.
- ↑ "O'Connor to return to Parliament". Radio New Zealand. 13 April 2009. Archived from the original on 2009-05-05.
- ↑ "O'Connor on course to grab West Coast seat". AAP. Retrieved 26 November 2011.
- ↑ "Pugh to seek Coast seat". The Nelson Mail. 16 December 2013. Retrieved 1 January 2014.
- ↑ Conway, Glenn (16 December 2013). "Former Westland mayor to stand for National". The Press.
- ↑ Mathewson, Nicole; Stylianou, Georgina; Fulton, Tim (21 September 2014). "Election 2014: Canterbury decides". The Press. Retrieved 21 September 2014.
- ↑ Farrar, David (21 September 2014). "Election 2014: All the MPs for each party, plus those who failed to make the cut". National Business Review. Retrieved 29 September 2014.
- ↑ Rutherford, Hamish (4 October 2014). "National loses majority, Greens pick up one". Stuff.co.nz. Retrieved 4 October 2014.
- ↑ "Official Count Results -- West Coast-Tasman (2017)". Electoral Commission. 7 October 2017. Retrieved 24 October 2017.
- ↑ "Official Count Results -- West Coast-Tasman (2014)". Electoral Commission. 4 October 2014. Retrieved 24 October 2017.
- ↑ "Official Count Results -- West Coast-Tasman (2011)". Electoral Commission. Retrieved 24 October 2017.
- ↑ "Enrolment statistics". Electoral Commission. 26 November 2011. Retrieved 28 November 2011.
- ↑ "Official Count Results -- West Coast-Tasman (2008)". Electoral Commission. Retrieved 24 October 2017.
- ↑ "Official Count Results -- West Coast-Tasman (2005)". Electoral Commission. Retrieved 24 October 2017.
External links
- Profile Parliamentary Library