United States presidential election in Maine, 1980
|
| |||||||||||||||||||||||||||||||||
| |||||||||||||||||||||||||||||||||
| |||||||||||||||||||||||||||||||||
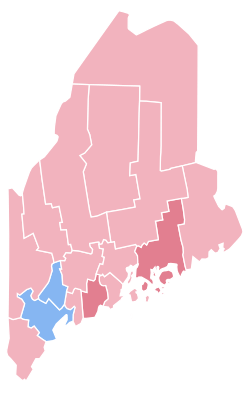 Results by county
| |||||||||||||||||||||||||||||||||
| |||||||||||||||||||||||||||||||||


| Elections in Maine | ||||
|---|---|---|---|---|
 | ||||
|
||||
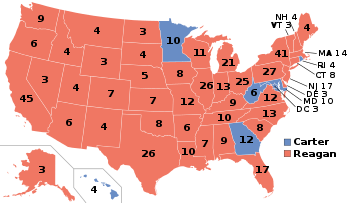
The 1980 United States presidential election in Maine took place on November 4, 1980. All fifty states and The District of Columbia were part of the 1980 United States presidential election. Maine voters chose four electors to the Electoral College, who voted for president and vice president.
Maine was won by former California Governor Ronald Reagan (R) by a slim margin of 3 percentage points,[1] carrying fourteen out of sixteen counties. In recent years, however, the state has grown much more liberal, and no Republican presidential nominee has carried it since 1988.[2]
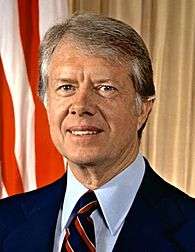
The already embattled incumbent Democratic president Carter was hurt in the state by the strong third party candidacy of John Anderson, a liberal Republican Congressman who ran in 1980 as an independent after failing to win the Republican Party's own presidential nomination. Anderson proved very popular with liberal and moderate voters in New England who normally leaned Democratic but were dissatisfied with the policies of the Carter Administration and viewed Reagan as too far to the right. New England overall would prove to be Anderson's strongest region in the nation, with all six New England states giving double-digit percentages to Anderson. However, Maine would prove to be Anderson's weakest state in New England with only 10.20% of the popular vote.
Results
| Presidential candidate | Party | Home state | Popular vote | Electoral vote |
Running mate | |||
|---|---|---|---|---|---|---|---|---|
| Count | Percentage | Vice-presidential candidate | Home state | Electoral vote | ||||
| Ronald Reagan | Republican | California | 238,522 | 45.61% | 4 | George H.W. Bush | Texas | 4 |
| Jimmy Carter | Democrat | Georgia | 220,974 | 42.25% | 0 | Walter Mondale | Minnesota | 0 |
| John B. Anderson | Independent | Illinois | 53,327 | 10.20% | 0 | Patrick Lucey | Wisconsin | 0 |
| Ed Clark | Libertarian | California | 5,119 | 0.98% | 0 | David Koch | New York | 0 |
| Barry Commoner | Citizens | New York | 4,394 | 0.84% | 0 | LaDonna Harris | Oklahoma | 0 |
| Gus Hall | Communist | New York | 591 | 0.11% | 0 | Angela Davis | California | 0 |
| Write-in candidates | — | — | 84 | 0.02% | 0 | — | — | 0 |
| Total | 523,011 | 100% | 4 | 4 | ||||
| Needed to win | 270 | 270 | ||||||
Results by county
| Ronald Wilson Reagan Republican |
James Earl Carter Democratic |
John B. Anderson Independent |
Various candidates Other parties |
Margin | Total votes cast | ||||||
|---|---|---|---|---|---|---|---|---|---|---|---|
| County | # | % | # | % | # | % | # | % | # | % | # |
| Androscoggin | 18,399 | 39.93% | 22,715 | 49.29% | 4,300 | 9.33% | 666 | 1.45% | -4,316 | -9.37% | 46,080 |
| Aroostook | 16,343 | 48.29% | 14,492 | 42.82% | 2,528 | 7.47% | 483 | 1.43% | 1,851 | 5.47% | 33,846 |
| Cumberland | 45,820 | 42.64% | 47,337 | 44.05% | 12,214 | 11.37% | 2,090 | 1.94% | -1,517 | -1.41% | 107,461 |
| Franklin | 5,680 | 46.83% | 4,979 | 41.05% | 1,205 | 9.94% | 264 | 2.18% | 701 | 5.78% | 12,128 |
| Hancock | 11,435 | 53.60% | 7,027 | 32.94% | 2,300 | 10.78% | 572 | 2.68% | 4,408 | 20.66% | 21,334 |
| Kennebec | 21,517 | 43.84% | 20,943 | 42.67% | 5,553 | 11.31% | 1,064 | 2.17% | 574 | 1.17% | 49,077 |
| Knox | 7,631 | 48.98% | 5,732 | 36.79% | 1,842 | 11.82% | 376 | 2.41% | 1,899 | 12.19% | 15,581 |
| Lincoln | 7,434 | 52.14% | 4,776 | 33.49% | 1,556 | 10.91% | 493 | 3.46% | 2,658 | 18.64% | 14,259 |
| Oxford | 11,041 | 47.04% | 9,914 | 42.23% | 2,063 | 8.79% | 456 | 1.94% | 1,127 | 4.80% | 23,474 |
| Penobscot | 28,869 | 45.97% | 26,519 | 42.23% | 6,287 | 10.01% | 1,118 | 1.78% | 2,350 | 3.74% | 62,793 |
| Piscataquis | 4,015 | 46.93% | 3,550 | 41.50% | 781 | 9.13% | 209 | 2.44% | 465 | 5.44% | 8,555 |
| Sagadahoc | 5,946 | 45.23% | 5,663 | 43.08% | 1,252 | 9.52% | 284 | 2.16% | 283 | 2.15% | 13,145 |
| Somerset | 9,286 | 47.59% | 8,115 | 41.59% | 1,673 | 8.57% | 439 | 2.25% | 1,171 | 6.00% | 19,513 |
| Waldo | 6,514 | 49.57% | 4,883 | 37.16% | 1,304 | 9.92% | 439 | 3.34% | 1,631 | 12.41% | 13,140 |
| Washington | 7,180 | 48.55% | 6,050 | 40.91% | 1,301 | 8.80% | 257 | 1.74% | 1,130 | 7.64% | 14,788 |
| York | 31,412 | 46.31% | 28,279 | 41.69% | 7,168 | 10.57% | 978 | 1.44% | 3,133 | 4.62% | 67,837 |
| Totals | 238,522 | 45.61% | 220,974 | 42.25% | 53,327 | 10.20% | 10,188 | 1.95% | 17,548 | 3.36% | 523,011 |
References
- ↑ "1980 Presidential General Election Results – Maine". uselectionatlas.org.
- ↑ Brownstein, Ronald (May 10, 2012). "Playing Their Hand". National Journal. Retrieved May 24, 2015.
| Candidates |
|  |
|---|---|---|
| General articles | ||
| Local results |
| |
| Other 1980 elections | ||