United States Senate elections, 1978
|
| |||||||||||||||||||||||||||||||||||||||||||||||||||||||||||||||||
| |||||||||||||||||||||||||||||||||||||||||||||||||||||||||||||||||
33 of the 100 seats in the United States Senate (plus 2 special elections) 51 seats needed for a majority | |||||||||||||||||||||||||||||||||||||||||||||||||||||||||||||||||
|---|---|---|---|---|---|---|---|---|---|---|---|---|---|---|---|---|---|---|---|---|---|---|---|---|---|---|---|---|---|---|---|---|---|---|---|---|---|---|---|---|---|---|---|---|---|---|---|---|---|---|---|---|---|---|---|---|---|---|---|---|---|---|---|---|---|
| |||||||||||||||||||||||||||||||||||||||||||||||||||||||||||||||||
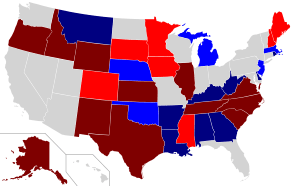 Results, with special elections Democratic gain Democratic hold Republican gain Republican hold | |||||||||||||||||||||||||||||||||||||||||||||||||||||||||||||||||
| |||||||||||||||||||||||||||||||||||||||||||||||||||||||||||||||||

The United States Senate elections, 1978 in the middle of Democratic President Jimmy Carter's term. Thirteen seats changed hands between parties. The Democrats at first lost a net of two seats to the Republicans, and then one more in a special election. Democrats nevertheless retained a 58-41 majority.
Results summary
| Parties | Total Seats | Popular Vote | ||||
|---|---|---|---|---|---|---|
| 1976 | 1978 | +/- | Vote | % | ||
| Democratic Party | 61 | 58 | 14,362,402 | 50.60% | ||
| Republican Party | 38 | 41 | 13,520,147 | 47.63% | ||
| Independent | 1 | 1 | 299,624 | 1.06% | ||
| American Party | 0 | 0 | 35,168 | 0.12% | ||
| Prohibition Party | 0 | 0 | 34,951 | 0.12% | ||
| Socialist Worker's Party | 0 | 0 | 29,796 | 0.10% | ||
| Libertarian Party | 0 | 0 | 25,071 | 0.09% | ||
| Others | 0 | 0 | 79,479 | 0.28% | ||
| Total | 100 | 100 | 28,386,638 | 100.0% | ||
Source: "Election Statistics - Office of the Clerk". Clerk of the United States House of Representatives – via clerk.house.gov.
Gains and losses
Republican gains
Republicans took three open seats, including one special election in Minnesota, as well as regular elections in Mississippi and South Dakota. They also defeated five Democratic incumbents: Floyd Haskell (Colorado), Dick Clark (Iowa), William Hathaway (Maine), Wendell Anderson (Minnesota), and Thomas McIntyre (New Hampshire). The two Republican victories in Minnesota saw the state's Senate delegation change from two Democrats to two Republicans in the same election.
Democratic gains
The Republican gains were offset by Democratic defeats of Edward Brooke (Massachusetts) and Robert Griffin (Michigan), and captures of Republican open seats in Nebraska, New Jersey, and Oklahoma.
Change in Senate composition
Before the elections
| D1 | D2 | D3 | D4 | D5 | D6 | D7 | D8 | D9 | D10 |
| D20 | D19 | D18 | D17 | D16 | D15 | D14 | D13 | D12 | D11 |
| D21 | D22 | D23 | D24 | D25 | D26 | D27 | D28 | D29 | D30 |
| D40 | D39 | D38 | D37 | D36 | D35 | D34 | D33 | D32 | D31 |
| D41 | D42 | D43 | D44 | D45 | D46 Ran |
D47 Ran |
D48 Ran |
D49 Ran |
D50 Ran |
| Majority → | D51 Ran | ||||||||
| D60 Retired |
D59 Retired |
D58 Retired |
D57 Ran |
D56 Ran |
D55 Ran |
D54 Ran |
D53 Ran |
D52 Ran | |
| D61 Retired |
I1 | R38 Retired |
R37 Retired |
R36 Retired |
R35 Ran |
R34 Ran |
R33 Ran |
R32 Ran |
R31 Ran |
| R21 | R22 Ran |
R23 Ran |
R24 Ran |
R25 Ran |
R26 Ran |
R27 Ran |
R28 Ran |
R29 Ran |
R30 Ran |
| R20 | R19 | R18 | R17 | R16 | R15 | R14 | R13 | R12 | R11 |
| R1 | R2 | R3 | R4 | R5 | R6 | R7 | R8 | R9 | R10 |
After the general elections
| D1 | D2 | D3 | D4 | D5 | D6 | D7 | D8 | D9 | D10 |
| D20 | D19 | D18 | D17 | D16 | D15 | D14 | D13 | D12 | D11 |
| D21 | D22 | D23 | D24 | D25 | D26 | D27 | D28 | D29 | D30 |
| D40 | D39 | D38 | D37 | D36 | D35 | D34 | D33 | D32 | D31 |
| D41 | D42 | D43 | D44 | D45 | D46 Ran |
D47 Ran |
D48 Ran |
D49 Ran |
D50 Ran |
| Majority → | D51 Ran | ||||||||
| I1 | D59 Gain |
D58 Gain |
D57 Gain |
D56 Gain |
D55 Gain |
D54 Hold |
D53 Hold |
D52 Hold | |
| R40 Gain |
R39 Gain |
R38 Gain |
R37 Gain |
R36 Gain |
R35 Gain |
R34 Gain |
R33 Hold |
R32 Hold |
R31 Hold |
| R21 | R22 Ran |
R23 Ran |
R24 Ran |
R25 Ran |
R26 Ran |
R27 Ran |
R28 Ran |
R29 Ran |
R30 Ran |
| R20 | R19 | R18 | R17 | R16 | R15 | R14 | R13 | R12 | R11 |
| R1 | R2 | R3 | R4 | R5 | R6 | R7 | R8 | R9 | R10 |
After the special elections
| D1 | D2 | D3 | D4 | D5 | D6 | D7 | D8 | D9 | D10 |
| D20 | D19 | D18 | D17 | D16 | D15 | D14 | D13 | D12 | D11 |
| D21 | D22 | D23 | D24 | D25 | D26 | D27 | D28 | D29 | D30 |
| D40 | D39 | D38 | D37 | D36 | D35 | D34 | D33 | D32 | D31 |
| D41 | D42 | D43 | D44 | D45 | D46 | D47 | D48 | D49 | D50 |
| Majority → | D51 | ||||||||
| R41 Gain |
I1 | D58 Hold |
D57 | D56 | D55 | D54 | D53 | D52 | |
| R40 | R39 | R38 | R37 | R36 | R35 | R34 | R33 | R32 | R31 |
| R21 | R22 | R23 | R24 | R25 | R26 | R27 | R28 | R29 | R30 |
| R20 | R19 | R18 | R17 | R16 | R15 | R14 | R13 | R12 | R11 |
| R1 | R2 | R3 | R4 | R5 | R6 | R7 | R8 | R9 | R10 |
| Key: |
|
|---|
Race summary
Special elections during the 95th Congress
In these special elections, the winner was seated during 1978 or before January 3, 1979; ordered by election date, then state.
| State (linked to summaries below) |
Incumbent | Results | Candidates | ||
|---|---|---|---|---|---|
| Senator | Party | Electoral history | |||
| Alabama (Class 3) |
Maryon Pittman Allen | Democratic | 1978 (Appointed) | Interim appointee lost nomination to finish term. New senator elected November 7, 1978. Democratic hold. |
√ Donald W. Stewart (Democratic) 55.1% James D. Martin (Republican) 43.3% Michael R. A. Erdey (Libertarian) 0.8% A. J. Killingsworth (Prohibition) 0.8% |
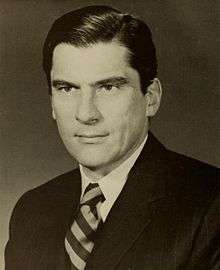
| Minnesota (Class 1) |
Muriel Humphrey | Democratic | 1978 (Appointed) | Appointee retired. New senator elected November 7, 1978. Republican gain |
√ David Durenberger (Republican) 61.4% Bob Short (Democratic) 34.6% Paul Helm (American) 2.9% Christine Frank (Socialist) 0.7% Frederick Hewitt (Libertarian) 0.3% |
Elections leading to the next Congress
In these general elections, the winners were elected for the term beginning January 3, 1979; ordered by state.
All of the elections involved the Class 2 seats.
| State (linked to summaries below) |
Incumbent | Results | Candidates | ||
|---|---|---|---|---|---|
| Senator | Party | Electoral history | |||
| Alabama | John Sparkman | Democratic | 1946 (Special) 1948 1954 1960 1966 1972 |
Incumbent retired. New senator elected. Democratic hold |
√ Howell Heflin (Democratic) 94.0% Jerome B. Couch (Prohibition) 6.0% |
| Alaska | Ted Stevens | Republican | 1968 (Appointed) 1970 1972 |
Incumbent re-elected. | √ Ted Stevens (Republican) 75.6% Donald W. Hobbs (Democratic) 24.1% |
| Arkansas | Kaneaster Hodges, Jr. | Democratic | 1977 (Appointed) | Interim appointee retired. New senator elected. Democratic hold |
√ David Pryor (Democratic) 76.5% Tom Kelly (Republican) 16.3% John J. Black (Independent) 7.2% |
| Colorado | Floyd K. Haskell | Democratic | 1972 | Incumbent lost re-election. New senator elected. Republican gain |
√ William L. Armstrong (Republican) 58.7% Floyd K. Haskell (Democratic) 40.3% Vedder V. Dorn (United States Party) 0.7% John Shue (National Statesman) 0.3% |
| Delaware | Joe Biden | Democratic | 1972 | Incumbent re-elected. | √ Joe Biden (Democratic) 58.0% James H. Baxter (Republican) 41.0% Donald G. Gies (American) 1.0% |
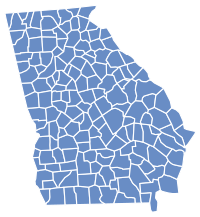
| Georgia | Sam Nunn | Democratic | 1972 (Special) 1972 |
Incumbent re-elected. | √ Sam Nunn (Democratic) 83.1% John W. Stokes (Republican) 16.9% |
| Idaho | James A. McClure | Republican | 1972 | Incumbent re-elected. | √ James A. McClure (Republican) 68.4% Dwight Jensen (Democratic) 31.6% |
| Illinois | Charles H. Percy | Republican | 1966 1972 |
Incumbent re-elected. | √ Charles H. Percy (Republican) 53.3% Alex Seith (Democratic) 45.5% William R. Roy (Libertarian) 0.5% Patricia Grogan (Socialist Workers) 0.5% Gerald Rose (Socialist Labor) 0.2% |
| Iowa | Dick Clark | Democratic | 1972 | Incumbent lost re-election. New senator elected. Republican gain |
√ Roger Jepsen (Republican) 51.1% Dick Clark (Democratic) 47.9% Gerald Leo Baker (Independent) 0.5% Ben L. Olson (Libertarian) 0.4% |
| Kansas | James B. Pearson | Republican | 1962 (Appointed) 1962 (Special) 1966 |
Incumbent retired. New senator elected. Republican hold. Incumbent resigned December 23, 1978 to give successor preferential seniority. Winner appointed December 23, 1978 to finish the term. |
√ Nancy Kassebaum (Republican) 53.9% William R. Roy (Democratic) 42.4% James R. Maher (Conservative) 3.0% Russell Mikels (Prohibition) 0.7% |
| Kentucky | Walter Huddleston | Democratic | 1972 | Incumbent re-elected. | √ Walter Huddleston (Democratic) 61.0% Louis Guenthner (Republican) 36.9% Anthony A. McCord (American) 2.1% |
| Louisiana | J. Bennett Johnston | Democratic | 1972 (Appointed) 1972 |
Incumbent re-elected. | √ J. Bennett Johnston (Democratic) 59.4% Woody Jenkins (Democratic) 40.6% |
| Maine | William Hathaway | Democratic | 1972 | Incumbent lost re-election. New senator elected. Republican gain |
√ William Cohen (Republican) 56.6% William Hathaway (Democratic) 33.9% Hayes E. Gahagan (Independent) 7.4% John J. Jannace (Independent) 1.5% Plato Truman (Independent) 0.6% |
| Massachusetts | Edward Brooke | Republican | 1966 1972 |
Incumbent lost re-election. New senator elected. Democratic gain |
√ Paul Tsongas (Democratic) 55.1% Edward Brooke (Republican) 44.9% |
| Michigan | Robert P. Griffin | Republican | 1966 (Appointed) 1966 1972 |
Incumbent lost re-election. New senator elected. Democratic gain |
√ Carl Levin (Democratic) 52.1% Robert P. Griffin (Republican) 47.9% |
| Minnesota | Wendell Anderson | Democratic | 1976 (Appointed) | Interim appointee lost election. New senator elected.. Republican gain. Incumbent resigned December 29, 1978 to give successor preferential seniority. Winner appointed December 30, 1978 to finish the term. |
√ Rudy Boschwitz (Republican) 56.6% Wendell Anderson (Democratic) 40.4% Sal Carlone (American) 1.5% William Peterson (Socialist Workers) 0.6% Brian Coyle (Public Interest Independent) 0.5% Jean T. Brust (Workers) 0.2% Leonard Richards (Libertarian) 0.2% |
| Mississippi | James O. Eastland | Democratic | 1942 1948 1954 1960 1972 |
Incumbent retired. New senator elected. Republican gain. Incumbent resigned December 27, 1978 to give successor preferential seniority. Winner appointed December 27, 1978 to finish the term. |
√ Thad Cochran (Republican) 45.3% Maurice Dantin (Democratic) 31.8% Charles Evers (Independent) 22.6% Henry Kirksey (Independent) 0.3% |
| Montana | Paul G. Hatfield | Democratic | 1978 (Appointed) | Interim appointee lost nomination. New senator elected. Democratic hold. Incumbent resigned December 12, 1978 to give successor preferential seniority. Winner appointed December 15, 1978 to finish the term. |
√ Max Baucus (Democratic) 55.7% Larry Williams (Republican) 44.3% |
| Nebraska | Carl Curtis | Republican | 1954 1960 1966 1972 |
Incumbent retired. New senator elected. Democratic gain |
√ J. James Exon (Democratic) 67.6% Donald Shasteen (Republican) 32.3% |
| New Hampshire | Thomas J. McIntyre | Democratic | 1962 (Special) 1966 1972 |
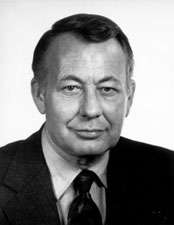
Incumbent lost re-election. New senator elected. Republican gain |
√ Gordon J. Humphrey (Republican) 50.7% Thomas J. McIntyre (Democratic) 48.5% Craig Franklin (Libertarian) 0.8% |
| New Jersey | Clifford P. Case | Republican | 1954 1960 1966 1972 |
Incumbent lost renomination. New senator elected. Democratic gain |
√ Bill Bradley (Democratic) 55.3% Jeffrey Bell (Republican) 43.1% Herbert Harry Shaw (Independent) 0.2% Bill Gahres (Independent) 0.2% Jack Moyers (Independent) 0.2% Robert Bowen (Labor) 0.2% J.M. Carter, Jr. (Independent) 0.2% Jasper C. Gould (Independent) 0.2% William R. Thorn (Independent) 0.1% Paul Ferguson (Independent) 0.1% Alice Conner (Independent) 0.1% |
| New Mexico | Pete Domenici | Republican | 1972 | Incumbent re-elected. | √ Pete Domenici (Republican) 53.4% Toney Anaya (Democratic) 46.6% |
| North Carolina | Jesse Helms | Republican | 1972 | Incumbent re-elected. | √ Jesse Helms (Republican) 54.5% John Ingram (Democratic) 45.5% |
| Oklahoma | Dewey F. Bartlett | Republican | 1972 | Incumbent retired. New senator elected. Democratic gain |
√ David L. Boren (Democratic) 65.5% Robert B. Kamm (Republican) 32.9% Glenn E. Hager (Independent) 0.5% Riley Donica (Independent) 0.4% Paul Edward Trent (Independent) 0.4% Richard King Carter (Independent) 0.3% |
| Oregon | Mark Hatfield | Republican | 1966 1972 |
Incumbent re-elected. | √ Mark Hatfield (Republican) 61.6% Vernon Cook (Democratic) 38.3% |
| Rhode Island | Claiborne Pell | Democratic | 1960 1966 1972 |
Incumbent re-elected. | √ Claiborne Pell (Democratic) 75.1% James G. Reynolds (Republican) 24.9% |
| South Carolina | Strom Thurmond | Republican | 1954 1954 (Appointed) 1956 (Resigned) 1956 (Special) 1960 1966 1972 |
Incumbent re-elected. | √ Strom Thurmond (Republican) 55.6% Charles D. Ravenel (Democratic) 44.4% |
| South Dakota | James Abourezk | Democratic | 1972 | Incumbent retired. New senator elected. Republican gain |
√ Larry Pressler (Republican) 66.8% Don Barnett (Democratic) 33.2% |
| Tennessee | Howard Baker | Republican | 1966 1972 |
Incumbent re-elected. | √ Howard Baker (Republican) 55.5% Jane Eskind (Democratic) 40.3% Thomas Anderson (Independent) 4.0% Fern Lucius Keasler (Independent) 0.2% |
| Texas | John Tower | Republican | 1961 (Special) 1966 1972 |
Incumbent re-elected. | √ John Tower (Republican) 49.8% Bob Krueger (Democratic) 49.3% Luis A. Diaz de Leon (La Raza Unida) 0.8% Miguel Pendas (Socialist Workers) 0.2% |
| Virginia | William L. Scott | Republican | 1972 | Incumbent retired. New senator elected. Republican hold. Incumbent resigned January 1, 1979 to give successor preferential seniority. Winner appointed January 2, 1979 to finish the term. |
√ John Warner (Republican) 50.2% Andrew P. Miller (Democratic) 49.8% |
| West Virginia | Jennings Randolph | Democratic | 1958 (Special) 1960 1966 1972 |
Incumbent re-elected. | √ Jennings Randolph (Democratic) 50.5% Arch A. Moore, Jr. (Republican) 49.5% |
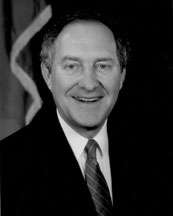
| Wyoming | Clifford Hansen | Republican | 1966 1972 |
Incumbent retired. New senator elected. Republican hold. Incumbent resigned December 31, 1978 to give successor preferential seniority. Winner appointed January 1, 1979 to finish the term. |
√ Alan K. Simpson (Republican) 62.2% Raymond B. Whitaker (Democratic) 37.8% |
Alabama
Incumbent Democratic Senator John Sparkman retired and was succeeded by Howell Heflin, the former Chief Justice of the Supreme Court of Alabama. Heflin, the Democratic candidate, faced no Republican opponent in the general election, defeating Prohibition Party nominee Jerome B. Couch.
|
| |||||||||||||||||
| |||||||||||||||||
| |||||||||||||||||
| Party | Candidate | Votes | % | ± | |
|---|---|---|---|---|---|
| Democratic | Howell Heflin | 547,054 | 93.99% | ||
| Prohibition | Jerome B. Couch | 34,951 | 6.01% | ||
| Majority | 512,103 | 87.98% | |||
| Turnout | 582,005 | ||||
| Democratic hold | Swing | ||||
Alabama (Special)
Following the death of Senator Jim Allen, his widow Maryon was appointed by governor George Wallace to fill the vacancy until a special election could be held. In this election, Democratic state senator Donald W. Stewart defeated former Republican Congressman James D. Martin to serve the remaining two years of the term.
|
| |||||||||||||||||
| |||||||||||||||||
| |||||||||||||||||

| Party | Candidate | Votes | % | ± | |
|---|---|---|---|---|---|
| Democratic | Donald W. Stewart | 401,852 | 55.06% | ||
| Republican | James D. Martin | 316,170 | 43.32% | ||
| Libertarian | Michael R. A. Erdey | 6,006 | 0.08% | ||
| Prohibition | A. J. Killinsworth | 5,814 | 0.08% | ||
| Majority | 85,682 | 11.74% | |||
| Turnout | 729,842 | ||||
| Democratic hold | Swing | ||||
Alaska
Incumbent Republican Senator Ted Stevens won reelection, defeating Democrat Donald Hobbs.
| Party | Candidate | Votes | % | ± | |
|---|---|---|---|---|---|
| Republican | Ted Stevens (Incumbent) | 92,783 | 75.59% | ||
| Democratic | Donald Hobbs | 29,574 | 24.09% | ||
| Write-ins | Write-ins | 384 | 0.31% | ||
| Majority | 63,209 | 51.50% | |||
| Turnout | 122,741 | ||||
| Republican hold | Swing | ||||
Arkansas
Colorado
Delaware
|
| |||||||||||||||||
| |||||||||||||||||
 County results | |||||||||||||||||
| |||||||||||||||||
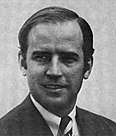

Incumbent Democrat United States Senator Joe Biden won re-election to a second term, defeating Republican challenger James H. Baxter Jr., the Delaware Secretary of Agriculture.[3]
| Party | Candidate | Votes | % | ± | |
|---|---|---|---|---|---|
| Democratic | Joe Biden (Incumbent) | 93,930 | 57.96% | +7.48% | |
| Republican | James H. Baxter Jr. | 66,479 | 41.02% | -8.08% | |
| American | Donald G. Gies | 1,663 | 1.02% | +0.68% | |
| Majority | 27,451 | 16.94% | +15.56% | ||
| Turnout | 162,072 | ||||
| Democratic hold | Swing | ||||
Georgia
|
| |||||||||||||||||
| |||||||||||||||||
 County results | |||||||||||||||||
| |||||||||||||||||
Incumbent Democrat Sam Nunn won re-election to a second term.[4]
| Party | Candidate | Votes | % | ± | |
|---|---|---|---|---|---|
| Democratic | Sam Nunn | 536,320 | 83.13% | +29.17% | |
| Republican | John W. Stokes | 108,808 | 16.87% | -29.14% | |
| Majority | 427,512 | 66.27% | +58.32% | ||
| Turnout | 645,128 | ||||
| Democratic hold | Swing | ||||
Idaho
|
| |||||||||||||||||
| |||||||||||||||||
| |||||||||||||||||
Incumbent Republican Senator James A. McClure was elected to a second term in office.
| Party | Candidate | Votes | % | ± | |
|---|---|---|---|---|---|
| Republican | James A. McClure (Incumbent) | 194,412 | 68.44% | ||
| Democratic | Dwight Jensen | 89,635 | 31.56% | ||
| Majority | 104,777 | 36.88% | |||
| Turnout | 284,047 | ||||
| Republican hold | Swing | ||||
Illinois
|
| |||||||||||||||||
| |||||||||||||||||
| |||||||||||||||||
Incumbent Republican Charles H. Percy ran for re-election to a third term in the United States Senate. Percy was opposed by Democratic nominee Alex Seith (D), attorney and former member of the Cook County Zoning Board of Appeals. Though Percy had been expected to coast to re-election over Seith, a first-time candidate, the election quickly became competitive. In the last few days of the campaign, a desperate Percy ran a television advertisement that featured him apologizing and acknowledging that, "I got your message and you're right."[6] Percy's last-ditch effort appeared to have paid off, as he was able to edge out Seith to win what would end up being his third and final term in the Senate.
| Party | Candidate | Votes | % | ± | |
|---|---|---|---|---|---|
| Republican | Charles H. Percy (Incumbent) | 1,698,711 | 53.34% | -8.88% | |
| Democratic | Alex Seith | 1,448,187 | 45.47% | +8.13% | |
| Libertarian | Bruce Lee Green | 16,320 | 0.51% | ||
| Socialist Workers | Patricia Grogan | 15,922 | 0.50% | ||
| Socialist Labor | Gerald Rose | 5,465 | 0.18% | ||
| Write-ins | 159 | 0.00% | |||
| Majority | 250,524 | 7.87% | -17.00% | ||
| Turnout | 3,184,764 | ||||
| Republican hold | Swing | ||||
Iowa
Kansas
Kentucky
Louisiana
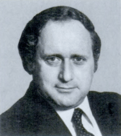
Maine
|
| |||||||||||||||||||||||||||||||||||||
| |||||||||||||||||||||||||||||||||||||
| |||||||||||||||||||||||||||||||||||||
.jpg)
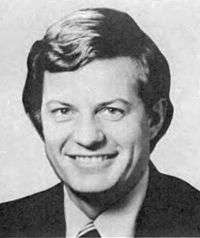
Incumbent Democrat William Hathaway decided to run for re-election to a second term, but was defeated by William Cohen, the Republican nominee and the United States Congressman from Maine's 2nd congressional district and Hayes Gahagan, former Maine State Senator
| Party | Candidate | Votes | % | ± | |
|---|---|---|---|---|---|
| Republican | William Cohen | 212,294 | 56.59% | +9.83% | |
| Democratic | William Hathaway (Incumbent) | 127,327 | 33.94% | -19.29% | |
| Independent | Hayes E. Gahagan | 27,824 | 7.42% | ||
| Independent | John J. Jannace | 5,553 | 1.48% | ||
| Independent | Plato Truman | 2,116 | 0.56% | ||
| Majority | 84,967 | 22.65% | +16.19% | ||
| Turnout | 375,114 | ||||
| Republican gain from Democratic | Swing | ||||
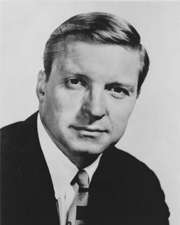
Massachusetts
|
| |||||||||||||||||
| |||||||||||||||||
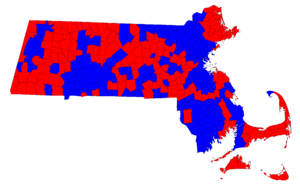 Results by town. Red indicates towns carried by Edward Brooke, blue indicates towns carried by Paul Tsongas. | |||||||||||||||||
| |||||||||||||||||
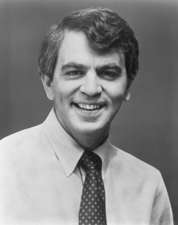

Incumbent Republican Senator Edward Brooke was defeated by Democratic Congressman Paul E. Tsongas.
| Party | Candidate | Votes | % | |
|---|---|---|---|---|
| Republican | Edward Brooke | 146,351 | 53.25% | |
| Republican | Avi Nelson | 128,388 | 46.72% | |
| All others | 78 | 0.03% | ||
| Party | Candidate | Votes | % | |
|---|---|---|---|---|
| Democratic | Paul Tsongas | 296,915 | 35.55% | |
| Democratic | Paul Guzzi | 258,960 | 31.01% | |
| Democratic | Kathleen Sullivan Alioto | 161,036 | 19.28% | |
| Democratic | Howard Phillips | 65,397 | 7.83% | |
| Democratic | Elaine Noble | 52,464 | 6.28% | |
| All others | 379 | 0.05% | ||
| Party | Candidate | Votes | % | |
|---|---|---|---|---|
| Democratic | Paul E. Tsongas | 1,093,283 | 55.06% | |
| Republican | Edward Brooke | 890,584 | 44.85% | |
| All others | 1,833 | 0.09% | ||
| Total votes | 1,985,700 | 68.01% | ||
Michigan
|
| |||||||||||||||||
| |||||||||||||||||
| |||||||||||||||||

Incumbent Republican Robert P. Griffin ran for re-election to a third term, but was defeated by the Democratic candidate, and former Michigan Attorney General Carl Levin.
| Party | Candidate | Votes | % | ± | |
|---|---|---|---|---|---|
| Democratic | Carl Levin | 1,484,193 | 52.1% | N/A | |
| Republican | Robert P. Griffin (Incumbent) | 1,362,165 | 47.8% | -4.29% | |
| Independent | Others | 272 | 0.01% | -52.13% | |
Minnesota
|
| |||||||||||||||||
| |||||||||||||||||
| |||||||||||||||||

Incumbent Democrat Wendell Anderson was defeated by Republican challenger businessman Rudy Boschwitz.
In 1978, all three key statewide races in Minnesota were up for election—the Governorship, and both Senate Seats (the other Senate seat belonged to Hubert Humphrey, who died in 1978). But, there was a particular oddity to the three races—all three had incumbents who were never elected to the office in the first place. This became a well played issue by the Republicans—a billboard put up across the state read, "The DFL is going to face something scary -- an election".
When Walter Mondale ascended to the Vice Presidency in 1976, sitting Governor Wendell Anderson appointed himself to the open seat. This act did not sit well with the electorate. Plywood magnate Rudy Boschwitz campaigned as a liberal Republican and spent freely of his own money, but all that seemed to really matter was that he was neither a DFLer or Wendell Anderson in an election cycle where both were rejected by the voters. The end result was not even close—the challenger Boschwitz won in a 16-point landslide as all three statewide offices switched into Republican hands.
| Party | Candidate | Votes | % | |
|---|---|---|---|---|
| DFL | Wendell Anderson (Incumbent) | 286,209 | 56.9% | |
| DFL | John S. Connolly | 159,974 | 31.8% | |
| DFL | Daryl W. Anderson | 23,159 | 4.6% | |
| DFL | Lloyd M. Roberts | 12,709 | 2.5% | |
| DFL | Dick Bullock | 11,485 | 2.3% | |
| DFL | Emil L. Moses | 9,580 | 1.9% | |
| Party | Candidate | Votes | % | |
|---|---|---|---|---|
| Independent-Republican | Rudy Boschwitz | 185,393 | 86.8% | |
| Independent-Republican | Harold Stassen | 28,170 | 13.2% | |
| Party | Candidate | Votes | % | |
|---|---|---|---|---|
| Independent-Republican | Rudy Boschwitz | 894,092 | 56.57% | |
| DFL | Wendell Anderson | 638,375 | 40.39% | |
| American | Sal Carlone | 23,261 | 1.47% | |
| Socialist Workers | William Peterson | 9,856 | 0.62% | |
| Independent | Brian J. Coyle | 8,083 | 0.51% | |
| Workers League | Jean T. Brust | 3,891 | 0.25% | |
| Libertarian | Leonard J. Richards | 2,992 | 0.19% | |
| Others | Write-ins | 72 | 0.01% | |
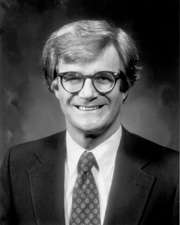
Minnesota (Special)
|
| |||||||||||||||||
| |||||||||||||||||
| |||||||||||||||||
.jpg)
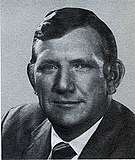
Incumbent Muriel Humphrey retired. Democratic candidate Bob Short was defeated by Republican candidate David Durenberger.
In 1978, all three key statewide races in Minnesota were up for election—the Governorship, and both Senate Seats (the other Senate seat belonged to Wendell Anderson, who, as Governor of Minnesota, appointed himself to fill the seat vacated by Walter Mondale, when Mondale ascended to the Vice Presidency in 1976). But, there was a particular oddity to the three races—all three had incumbents who were never elected to the office in the first place. This became a well played issue by the Republicans—a billboard put up across the state read, "The DFL is going to face something scary -- an election".
When Hubert H. Humphrey died in office in January 1978, sitting Governor Rudy Perpich appointed Humphrey's widow, Muriel to sit until a special election could be held later that year. However, Muriel Humphrey opted not to seek election to the seat in her own right, and the DFL nominated former Texas Rangers owner Bob Short to run in the subsequent special election. The Independent-Republicans, on their part, nominated the liberal Republican David Durenberger, creating an unusual race in which the DFL candidate was positioned to the right of the Independent-Republican candidate. In addition to the general sense of dissatisfaction voters felt for the DFL, the DFL also had to contend with a large number of liberal members of the DFL, who were dissatisfied with Short's positions on hot button issues such as abortion, motorboat usage in the Boundary Waters Canoe area, and government spending, crossing party lines to vote for Durenberger. As a result, Durenberger won in a 26.9-percent landslide as the governorship and both U.S. Senate seats switched into Republican hands.
| Party | Candidate | Votes | % | |
|---|---|---|---|---|
| DFL | Bob Short | 257,289 | 48.0% | |
| DFL | Donald M. Fraser | 253,818 | 47.4% | |
| DFL | Sharon Anderson | 16,094 | 3.0% | |
| DFL | Richard A. Palmer | 8,425 | 1.6% | |
| Party | Candidate | Votes | % | |
|---|---|---|---|---|
| Independent-Republican | David Durenberger | 139,187 | 67.3% | |
| Independent-Republican | Malcolm Moos | 32,314 | 15.6% | |
| Independent-Republican | Ken Nordstrom | 14,635 | 7.1% | |
| Independent-Republican | Will Lundquist | 12,261 | 5.9% | |
| Independent-Republican | Adell H. Campbell | 8,523 | 4.1% | |
| Party | Candidate | Votes | % | |
|---|---|---|---|---|
| Independent-Republican | David Durenberger | 957,908 | 61.47% | |
| DFL | Bob Short | 538,675 | 34.57% | |
| American | Paul Helm | 45,402 | 2.91% | |
| Socialist Workers | Christine Frank | 11,397 | 0.73% | |
| Libertarian | Frederick Hewitt | 4,116 | 0.26% | |
| Others | Write-ins | 878 | 0.06% | |
Mississippi
|
| |||||||||||||||||||||||||||||||||||||
| |||||||||||||||||||||||||||||||||||||
| |||||||||||||||||||||||||||||||||||||
Incumbent Democrat James Eastland decided to retire. Republican Thad Cochran won the open seat over Democrat Maurice Dantin, former District Attorney[13] and Independent Charles Evers, Mayor of Fayette.
Evers was the first African American elected since the Reconstruction era to be mayor in any Mississippi city in 1969. He ran as an independent, and as a result his campaign divided the Democrats and allowed Cochran to win the senate seat with a 45 percent plurality.[14] This made him the first Republican to win a statewide election in Mississippi in a century.[15] Eastland resigned on December 27, 1978 to give Cochran a seniority advantage over new incoming senators.[16]
| Party | Candidate | Votes | % | |
|---|---|---|---|---|
| Republican | Thad Cochran | 267,302 | 45.3% | |
| Democratic | Maurice Dantin | 187,541 | 31.8% | |
| Independent | Charles Evers | 133,646 | 22.6% | |
| Independent | Henry Jay Kirksey | 1,747 | 0.3% | |
Montana
|
| |||||||||||||||||
| |||||||||||||||||
| |||||||||||||||||
Following the death of Senator Lee Metcalf on January 12, 1978, Montana Supreme Court Chief Justice Paul G. Hatfield was appointed to serve for the remainder of Metcalf's term. Hatfield opted to run for re-election, but was overwhelmingly defeated in the Democratic primary by Congressman Max Baucus of the 1st congressional district. Baucus advanced to the general election, where he was opposed by Larry R. Williams, an author and the Republican nominee. Baucus ended up defeating Williams by a solid margin to win his first term in the Senate, and, following Hatfield's resignation on December 12, 1978, he began serving his first term in the Senate.
| Party | Candidate | Votes | % | |
|---|---|---|---|---|
| Democratic | Max Baucus | 87,085 | 65.25% | |
| Democratic | Paul Hatfield (Incumbent) | 25,789 | 19.32% | |
| Democratic | John Driscoll | 18,184 | 13.62% | |
| Democratic | Steve Shugrue | 2,404 | 1.80% | |
| Total votes | 133,462 | 100.00% | ||
| Party | Candidate | Votes | % | |
|---|---|---|---|---|
| Republican | Larry Williams | 35,479 | 61.66% | |
| Republican | Bill Osborne | 16,436 | 28.57% | |
| Republican | Clancy Rich | 5,622 | 9.77% | |
| Total votes | 57,537 | 100.00% | ||
| Party | Candidate | Votes | % | ± | |
|---|---|---|---|---|---|
| Democratic | Max Baucus | 160,353 | 55.69% | +3.74% | |
| Republican | Larry R. Williams | 127,589 | 44.31% | -3.74% | |
| Majority | 32,764 | 11.38% | +7.48% | ||
| Turnout | 287,942 | ||||
| Democratic hold | Swing | ||||
Nebraska
|
| |||||||||||||||||
| |||||||||||||||||
| |||||||||||||||||
Incumbent Republican Carl Curtis decided to retire instead of seeking a fifth term. In the elections, Democratic nominee J. James Exon won the open seat over Republican Donald Eugene Shasteen.
| Party | Candidate | Votes | % | ± | |
|---|---|---|---|---|---|
| Democratic | J. James Exon | 334,096 | 67.66% | +20.82% | |
| Republican | Donald Eugene Shasteen | 159,708 | 32.34% | -20.82% | |
| Majority | 174,390 | 35.32% | +28.99% | ||
| Turnout | 493,802 | ||||
| Democratic gain from Republican | Swing | ||||
New Hampshire
New Jersey
New Mexico
|
| |||||||||||||||||
| |||||||||||||||||
 County results | |||||||||||||||||
| |||||||||||||||||
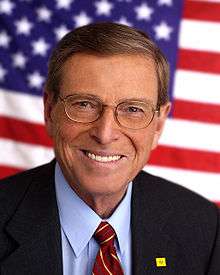

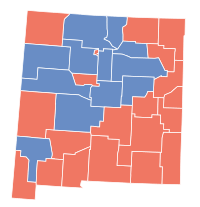
Incumbent Republican U.S. Senator Pete Domenici successfully ran for re-election to a second term, defeating Democrat Toney Anaya, Attorney General of New Mexico.
| Party | Candidate | Votes | % | |
|---|---|---|---|---|
| Republican | Pete Domenici (Incumbent) | 183,442 | 53.41% | |
| Democratic | Toney Anaya | 160,045 | 46.59% | |
| Majority | 23,397 | 6.81% | ||
| Total votes | 343,487 | 100.00% | ||
| Republican hold | ||||
North Carolina
|
| |||||||||||||||||
| |||||||||||||||||
| |||||||||||||||||
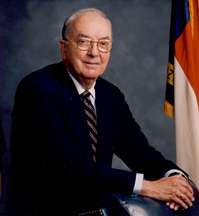
The general election was fought between the Republican Incumbent Jesse Helms and Democrat John Ingram. Helms won re-election, by a slightly wider margin than in 1972.
| Party | Candidate | Votes | % | |
|---|---|---|---|---|
| Democratic | Luther H. Hodges, Jr. | 260,868 | 40.08% | |
| Democratic | John Ingram | 170,715 | 26.23% | |
| Democratic | Lawrence Davis | 105,381 | 16.19% | |
| Democratic | McNeill Smith | 82,703 | 12.71% | |
| Democratic | Dave McKnight | 9,422 | 1.45% | |
| Democratic | William Griffin | 8,907 | 1.37% | |
| Democratic | Tom Sawyer | 8,482 | 1.30% | |
| Turnout | 650,942 | |||
| Party | Candidate | Votes | % | ± | |
|---|---|---|---|---|---|
| Democratic | John Ingram | 244,469 | 54.24% | +28.01% | |
| Democratic | Luther H. Hodges, Jr. | 206,223 | 45.76% | +5.68% | |
| Turnout | 450,692 | ||||
Jesse Helms won the Republican Party's nomination unopposed.
| Party | Candidate | Votes | % | ± | |
|---|---|---|---|---|---|
| Republican | Jesse Helms | 619,151 | 54.51% | +0.50% | |
| Democratic | John Ingram | 516,663 | 45.49% | -0.50% | |
| Turnout | 1,135,814 | ||||
Oklahoma
Oregon
Rhode Island
|
| |||||||||||||||||
| |||||||||||||||||
 County results | |||||||||||||||||
| |||||||||||||||||
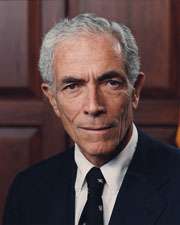
Incumbent Democrat Claiborne Pell successfully sought re-election, defeating Republican James G. Reynolds.
| Party | Candidate | Votes | % | |
|---|---|---|---|---|
| Democratic | Claiborne Pell (Incumbent) | 69,729 | 87.01% | |
| Democratic | Raymond J. Greiner | 6,076 | 7.58% | |
| Democratic | Francis P. Kelley | 4,330 | 5.41% | |
| Majority | 63,653 | 79.43% | ||
| Total votes | 80,135 | 100.00% | ||
| Party | Candidate | Votes | % | |
|---|---|---|---|---|
| Democratic | Claiborne Pell (Incumbent) | 229,557 | 75.11% | |
| Republican | James G. Reynolds | 76,061 | 24.89% | |
| Majority | 153,496 | 50.22% | ||
| Total votes | 305,618 | 100.00% | ||
| Democratic hold | ||||
South Carolina
|
| |||||||||||||||||
| |||||||||||||||||
| |||||||||||||||||
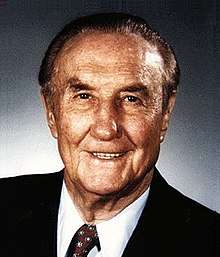
Popular incumbent Republican Strom Thurmond defeated Democratic challenger Charles D. Ravenel.
The South Carolina Democratic Party held their primary for governor on June 13, 1978. Charles D. Ravenel, an unsuccessful candidate in the 1974 gubernatorial contest, originally planned to run for governor again in 1978, but was convinced by Vice President Walter Mondale in 1977 to run for senator. He garnered over 50% of the vote in the primary and avoided a runoff election.
| Democratic Primary | ||
|---|---|---|
| Candidate | Votes | % |
| Charles D. Ravenel | 205,348 | 55.9% |
| John Bolt Culbertson | 69,184 | 18.9% |
| Tom Triplett | 50,957 | 13.9% |
| Tom McElveen | 41,550 | 11.3% |
Senator Strom Thurmond faced no opposition from South Carolina Republicans and avoided a primary election.
Thurmond generally ignored Ravenel on the campaign and refused to debate him. When they did cross paths, Thurmond criticized Ravenel for never having held a political office. Ravenel did not help his cause by his actions in the 1974 gubernatorial race when he refused to endorse the Democratic nominee after he had been disqualified. This irritated many Democrats and they also accused him of being nothing more than a liberal New Yorker. Age was beginning to become an issue with Thurmond, so to combat perceptions of old age, Thurmond often appeared with his children on the campaign trail. While 1978 was generally a Democratic year, Thurmond was able to pull off a commanding victory over Ravenel.
| Party | Candidate | Votes | % | ± | |
|---|---|---|---|---|---|
| Republican | Strom Thurmond | 351,733 | 55.6% | -7.9% | |
| Democratic | Charles D. Ravenel | 281,119 | 44.4% | +7.9% | |
| No party | Write-Ins | 257 | 0.0% | 0.0% | |
| Majority | 70,614 | 11.2% | -15.8% | ||
| Turnout | 633,109 | 57.7% | -7.5% | ||
| Republican hold | |||||
South Dakota
Tennessee
|
| |||||||||||||||||
| |||||||||||||||||
| |||||||||||||||||
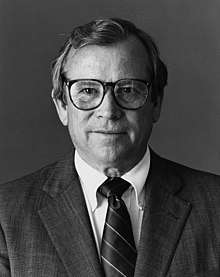
Two-term popular incumbent Howard Baker, who had served as United States Senate Minority Leader since 1977, ran for reelection against first-time candidate and Democratic Party activist Jane Eskind.
In the August 3 Democratic primary Eskind won in an open primary against eight other candidates:[23]
- Eskind - 196,156 (34.52%)
- Bruce - 170,795 (30.06%)
- Lee - 89,939 (15.83%)
- Boyd - 48,458 (8.53%)
- Bradley - 22,130 (3.90%)
- Heinsohn - 17,787 (3.13%)
- Foster - 10,671 (1.88%)
- Nyabongo - 7,682 (1.35%)
- Vick - 4,414 (0.78%)
- Write-in - 147 (0.03%)
In the Republican primary, also held August 3, Baker easily emerged as the winner:[24]
- Baker - 205,680 (83.44%)
- Howard - 21,154 (8.58%)
- Boles - 8,899 (3.61%)
- Patty - 3,941 (1.60%)
- Seiler - 3,831 (1.55%)
- Trapp - 2,994 (1.22%)
Baker won with a 15-point margin in the general election, held on November 7:[25]
| Party | Candidate | Votes | % | |
|---|---|---|---|---|
| Republican | Howard Baker | 642,644 | 55.54% | |
| Democratic | Jane Eskind | 466,228 | 40.30% | |
| Independent | Thomas Jefferson Anderson | 45,908 | 3.97% | |
| Independent | Fern L. Keasler | 2,243 | 0.19% | |
Texas
|
| |||||||||||||||||
| |||||||||||||||||
| |||||||||||||||||
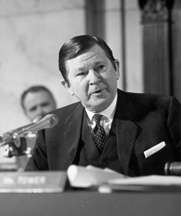
Republican U.S. Senator John G. Tower won re-election to a fourth term over Democrat Bob Krueger, U.S. Congressman of Texas's 21st congressional district.
| Party | Candidate | Votes | % | |
|---|---|---|---|---|
| Republican | John Tower | 1,151,376 | 49.8% | |
| Democratic | Bob Krueger | 1,139,149 | 49.3% | |
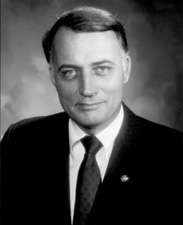
Virginia
|
| |||||||||||||||||
| |||||||||||||||||
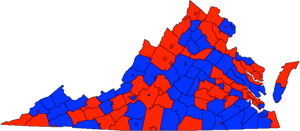 U.S. Senate election results map. Red denotes counties/districts won by Warner. Blue denotes those won by Miller. | |||||||||||||||||
| |||||||||||||||||
Incumbent William L. Scott retired. Former Secretary of the Navy Republican John Warner beat Attorney General of Virginia Andrew P. Miller. Scott then resigned January 1, 1979 and Warner was appointed January 2, 1979 for early seniority purposes.
| Party | Candidate | Votes | % | ± | |
|---|---|---|---|---|---|
| Republican | John Warner | 613,232 | 50.17% | -1.28% | |
| Democratic | Andrew P. Miller | 608,511 | 49.79% | +3.67% | |
| Write-ins | 513 | 0.04% | +0.04% | ||
| Majority | 4,721 | 0.39% | +0.39% | ||
| Turnout | 1,222,256 | ||||
| Republican hold | |||||
West Virginia
Wyoming
See also
References
- ↑ Harry F. Byrd Jr. (VA) was an Independent who caucused with the Democrats. In some circles he is called an "Independent Democrat," but his actual registration was listed as "Independent." See, e.g., United States Congress. "Harry Flood Byrd, Jr. (id: B001209)". Biographical Directory of the United States Congress.
- 1 2 3 4 5 6 7 8 9 10 11 "Statistics of the Congressional Election of November 7, 1978" (PDF). Clerk of the United States House of Representatives. Retrieved July 2, 2014.
- ↑ http://dda.delaware.gov/pressrel/2011/012811_SecAward.pdf
- ↑ "Ourcampaigns.com". Ourcampaigns.com. Retrieved May 23, 2018.
- ↑ http://www.ourcampaigns.com/RaceDetail.html?RaceID=5326
- ↑ "The Message of the 1978 Off-Year Elections". Time.com. November 20, 1978. Retrieved April 4, 2015.
- ↑ http://www.ourcampaigns.com/RaceDetail.html?RaceID=290354
- ↑ http://www.ourcampaigns.com/RaceDetail.html?RaceID=290355
- ↑ Parker, Randy; crickets chirp (July 7, 2003). "Our Campaigns: MI U.S. Senate". Our Campaigns.
- 1 2 3 4 "Minnesota Election Results 1978 (Primary Election)" (PDF). Minnesota Secretary of State. Retrieved October 21, 2017.
- ↑ http://www.ourcampaigns.com/RaceDetail.html?RaceID=5315
- ↑ https://www.ourcampaigns.com/RaceDetail.html?RaceID=6259
- ↑ https://news.google.com/newspapers?id=5ngsAAAAIBAJ&sjid=yvoDAAAAIBAJ&pg=7196,1592291&dq=maurice+dantin&hl=en
- ↑ Black, Earl; Merle Black (2003). The Rise of Southern Republicans. Harvard University Press. p. 118. ISBN 978-0-674-01248-6.
- ↑ "Results of Elections Across the Nation". The Blade. November 7, 1978. Retrieved April 18, 2010.
- ↑ Associated Press (December 27, 1978). "Eastland Quits Early To Aid His Successor". The Blade. Retrieved April 19, 2010.
- ↑ http://www.ourcampaigns.com/RaceDetail.html?RaceID=5320
- 1 2 "Report of the Official Canvass of the Vote Cast at the Primary Election Held in the State of Montana, June 6, 1978". Montana Secretary of State. Retrieved July 2, 2014.
- ↑ "NM US Senate". OurCampaigns. Retrieved March 16, 2014.
- 1 2 3 "North Carolina DataNet #46" (PDF). University of North Carolina. April 2008. Archived from the original (PDF) on July 25, 2008. Retrieved June 12, 2009.
- ↑ "RI US Senate - D Primary". OurCampaigns. Retrieved March 18, 2014.
- ↑ "RI US Senate". OurCampaigns. Retrieved March 18, 2014.
- ↑ "Our Campaigns - TN US Senate - D Primary Race - Aug 03, 1978". ourcampaigns.com. Retrieved November 24, 2014.
- ↑ "Our Campaigns - TN US Senate - R Primary Race - Aug 03, 1978". ourcampaigns.com. Retrieved November 24, 2014.
- ↑ "Our Campaigns - TN US Senate Race - Nov 07, 1978". ourcampaigns.com. Retrieved November 24, 2014.
- ↑ http://www.ourcampaigns.com/RaceDetail.html?RaceID=5309
- ↑ http://www.ourcampaigns.com/RaceDetail.html?RaceID=5329
- Bass, Jack; Marilyn W. Thompson (1998). Ol' Strom: An Unauthorized Biography of Strom Thurmond. Longstreet. pp. 290–292.
- State Election Commission (1979). Report of the South Carolina State Election Commission. Columbia, SC: State Election Commission. p. 54.
- "Challenging a Southern Legend". Time. October 16, 1978. Retrieved February 9, 2008.