United States House of Representatives elections, 1960
|
| ||||||||||||||||||||||||||||||||||
| ||||||||||||||||||||||||||||||||||
All 437 seats to the United States House of Representatives 219 seats needed for a majority | ||||||||||||||||||||||||||||||||||
|---|---|---|---|---|---|---|---|---|---|---|---|---|---|---|---|---|---|---|---|---|---|---|---|---|---|---|---|---|---|---|---|---|---|---|
| ||||||||||||||||||||||||||||||||||
 | ||||||||||||||||||||||||||||||||||
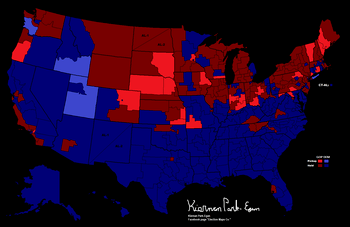
The 1960 United States House of Representatives elections was an election for the United States House of Representatives in 1960, which coincided with the election of President John F. Kennedy and was the first house election to feature all 50 U.S. states. In spite of Kennedy's victory, his Democratic Party lost 20 seats to the Republican Party. That may have been a reaction to the major Democratic gains in the previous election. An end to the economic downturn of the mid-1950s was also a factor. Still, the Democrats retained a clear majority in the House.
There were 437 seats: 435 from the reapportionment in accordance with the 1950 census, and 1 seat for each of the new states of Alaska and Hawaii.
Overall results
| 262 | 175 |
| Democratic | Republican |
| Parties | Seats | Popular Vote | ||||||
|---|---|---|---|---|---|---|---|---|
| 1958 | 1960 | Change | Strength | Vote | % | Change | ||
| Democratic | 283 | 262 | 60.0% | 35,125,032 | 54.8% | |||
| Republican | 153 | 175 | 40.0% | 28,750,866 | 44.8% | |||
| Liberal | 0 | 0 | 126,332 | 0.2% | ||||
| Constitution | 0 | 0 | 61,506 | 0.1% | ||||
| Conservative | 0 | 0 | 15,502 | <0.1% | ||||
| Social Democratic | 0 | 0 | 12,700 | <0.1% | ||||
| Socialist Labor | 0 | 0 | 8,166 | <0.1% | ||||
| Prohibition | 0 | 0 | 4,841 | <0.1% | ||||
| Independent Anti-Tax | 0 | 0 | 1,851 | <0.1% | ||||
| Independent | 1 | 0 | 1,394 | <0.1% | ||||
| Independent American | 0 | 0 | 892 | <0.1% | ||||
| Tax Cut | 0 | 0 | 363 | <0.1% | ||||
| Others | 0 | 0 | 14,865 | <0.1% | ||||
| Total | 437 | 437 | 100.0% | 64,124,310 | 100.0% | |||
Source: Election Statistics - Office of the Clerk
|
[[Image:87 us house membership.png|thumb|400px|
|
[[Image:87 us house changes.png|thumb|400px|
| ||||||||||||||||||
Special elections during the 86th Congress
In these special elections, the winner was seated during 1960 or before January 3, 1961; ordered by election date, then state, then district.
| District | Incumbent | Results | Candidates | ||
|---|---|---|---|---|---|
| Member | Party | Electoral history | |||
| New York 23 | Isidore Dollinger | Democratic | 1948, 1950, 1952, 1954, 1956, 1958 | Incumbent resigned December 31, 1959 to become District Attorney of Bronx County. New member elected March 8, 1960. Democratic hold. Winner was subsequently re-elected in November, see below. |
√ Jacob H. Gilbert (Democratic) 82.4% Simon M. Koenig (Republican) 10.3% Hector Mathew (Liberal) 7.4% |
| Pennsylvania 17 | Alvin R. Bush | Republican | 1950, 1952, 1954, 1956, 1958 | Incumbent died November 3, 1959. New member elected April 26, 1960. Republican hold. Winner was subsequently re-elected in November, see below. |
√ Herman T. Schneebeli (Republican) 52.45% Dean R. Fisher (Democratic) 47.55% |
| Pennsylvania 18 | Richard M. Simpson | Republican | 1936, 1938, 1940, 1942, 1944, 1946, 1948, 1950, 1952, 1954, 1956, 1958 | Incumbent died January 7, 1960. New member elected April 26, 1960. Republican hold. Winner subsequently died June 19, 1960, and the seat remained vacant until another special election in November, see below. |
√ Douglas Elliott (Republican) 61.2% Robert M. Meyers (Democratic) 38.8%[1] |
| North Carolina 12 | David M. Hall | Democratic | 1958 | Incumbent died January 29, 1960. New member elected June 25, 1960. Democratic hold. Winner was subsequently re-elected in November, see below. |
√ Roy A. Taylor (Democratic) 98.6% Heinz Rollman (Republican) 1.4% |
| Pennsylvania 18 | Douglas Elliott | Republican | 1960 (Special) | Incumbent died June 19, 1960. New member elected November 8, 1960. Republican hold. Winner was also elected to the full term, see below. |
√ J. Irving Whalley (Republican) 61.3% Robert M. Meyers (Democratic) 38.1%[1] |
| Washington 3 | Russell V. Mack | Republican | 1947 (Special), 1948, 1950, 1952, 1954, 1956, 1958 | Incumbent died March 28, 1960. New member elected November 8, 1960. Democratic gain. Winner was also elected to the full term, see below. |
√ Julia Butler Hansen (Democratic) 53.4% Dale M. Nordquist (Republican) 46.6%[2] |
Alabama
| District | Incumbent | Results | Candidates | ||
|---|---|---|---|---|---|
| Senator | Party | First elected | |||
| Alabama 1 | Frank W. Boykin | Democratic | 1935 | Incumbent re-elected. | √ Frank W. Boykin (Democratic) Unopposed |
| Alabama 2 | George M. Grant | Democratic | 1938 | Incumbent re-elected. | √ George M. Grant (Democratic) Unopposed |
| Alabama 3 | George W. Andrews | Democratic | 1944 | Incumbent re-elected. | √ George W. Andrews (Democratic) Unopposed |
| Alabama 4 | Kenneth A. Roberts | Democratic | 1950 | Incumbent re-elected. | √ Kenneth A. Roberts (Democratic) Unopposed |
| Alabama 5 | Albert Rains | Democratic | 1944 | Incumbent re-elected. | √ Albert Rains (Democratic) Unopposed |
| Alabama 6 | Armistead I. Selden, Jr. | Democratic | 1952 | Incumbent re-elected. | √ Armistead I. Selden, Jr. (Democratic) Unopposed |
| Alabama 7 | Carl Elliott | Democratic | 1948 | Incumbent re-elected. | √ Carl Elliott (Democratic) Unopposed |
| Alabama 8 | Robert E. Jones, Jr. | Democratic | 1947 | Incumbent re-elected. | √ Robert E. Jones, Jr. (Democratic) 79.2% H. G. Williams (Republican) 20.8% |
| Alabama 9 | George Huddleston, Jr. | Democratic | 1954 | Incumbent re-elected. | √ George Huddleston, Jr. (Democratic) 67.3% William P. Ivey (Republican) 32.7% |
Alaska
| District | Incumbent | Results | Candidates | ||
|---|---|---|---|---|---|
| Senator | Party | First elected | |||
| Alaska at-large | Ralph Julian Rivers | Democratic | 1958 | Incumbent re-elected. | √ Ralph Julian Rivers (Democratic) 56.8% R. L. Rettig (Republican) 43.2% |
Arizona
| District | Incumbent | Results | Candidates | ||
|---|---|---|---|---|---|
| Senator | Party | First elected | |||
| Arizona 1 | John Jacob Rhodes | Republican | 1952 | Incumbent re-elected. | √ John Jacob Rhodes (Republican) 59.2% Richard H. Harless (Democratic) 40.8% |
| Arizona 2 | Stewart Lee Udall | Democratic | 1954 | Incumbent re-elected. | √ Stewart Lee Udall (Democratic) 55.7% Mac C. Matheson (Republican) 44.3% |
Arkansas
| District | Incumbent | Results | Candidates | ||
|---|---|---|---|---|---|
| Senator | Party | First elected | |||
| Arkansas 1 | Ezekiel C. Gathings | Democratic | 1938 | Incumbent re-elected. | √ Ezekiel C. Gathings (Democratic) Unopposed |
| Arkansas 2 | Wilbur Mills | Democratic | 1938 | Incumbent re-elected. | √ Wilbur Mills (Democratic) Unopposed |
| Arkansas 3 | James William Trimble | Democratic | 1944 | Incumbent re-elected. | √ James William Trimble (Democratic) Unopposed |
| Arkansas 4 | Oren Harris | Democratic | 1940 | Incumbent re-elected. | √ Oren Harris (Democratic) Unopposed |
| Arkansas 5 | Dale Alford | Democratic | 1958 | Incumbent re-elected. | √ Dale Alford (Democratic) 82.7% L. J. Churchill (Republican) 17.3% |
| Arkansas 6 | William F. Norrell | Democratic | 1938 | Incumbent re-elected. | √ William F. Norrell (Democratic) Unopposed |
California
| District | Incumbent | Results | Candidates | ||
|---|---|---|---|---|---|
| Senator | Party | First elected | |||
| California 1 | Clement Woodnutt Miller | Democratic | 1958 | Incumbent re-elected. | √ Clement Woodnutt Miller (Democratic) 51.6% Frederick G. Dupuis (Republican) 48.4% |
| California 2 | Harold T. Johnson | Democratic | 1958 | Incumbent re-elected. | √ Harold T. Johnson (Democratic) 62.7% Fredric H. Nagel (Republican) 37.3% |
| California 3 | John E. Moss | Democratic | 1952 | Incumbent re-elected. | √ John E. Moss (Democratic) Unopposed |
| California 4 | William S. Mailliard | Republican | 1952 | Incumbent re-elected. | √ William S. Mailliard (Republican) 65.3% Phillips S. Davies (Democratic) 34.7% |
| California 5 | John F. Shelley | Democratic | 1949 | Incumbent re-elected. | √ John F. Shelley (Democratic) 83.7% Nick Verreos (Republican) 16.3% |
| California 6 | John F. Baldwin, Jr. | Republican | 1954 | Incumbent re-elected. | √ John F. Baldwin, Jr. (Republican) 58.7% Douglas R. Page (Democratic) 41.3% |
| California 7 | Jeffery Cohelan | Democratic | 1958 | Incumbent re-elected. | √ Jeffery Cohelan (Democratic) 57.0% Lewis F. Sherman (Republican) 43.0% |
| California 8 | George Paul Miller | Democratic | 1944 | Incumbent re-elected. | √ George Paul Miller (Democratic) 62.0% Robert E. Hannon (Republican) 38.0% |
| California 9 | J. Arthur Younger | Republican | 1952 | Incumbent re-elected. | √ J. Arthur Younger (Republican) 59.2% John D. Kaster (Democratic) 40.8% |
| California 10 | Charles S. Gubser | Republican | 1952 | Incumbent re-elected. | √ Charles S. Gubser (Republican) 58.9% Russell B. Bryan (Democratic) 41.1% |
| California 11 | John J. McFall | Democratic | 1956 | Incumbent re-elected. | √ John J. McFall (Democratic) 65.4% Clifford B. Bull (Republican) 34.6% |
| California 12 | Bernice F. Sisk | Democratic | 1954 | Incumbent re-elected. | √ Bernice F. Sisk (Democratic) Unopposed |
| California 13 | Charles M. Teague | Republican | 1954 | Incumbent re-elected. | √ Charles M. Teague (Republican) 65.0% L. Boyd Finch (Democratic) 35.0% |
| California 14 | Harlan Hagen | Democratic | 1952 | Incumbent re-elected. | √ Harlan Hagen (Democratic) 56.5% G. Ray Arnett (Republican) 43.5% |
| California 15 | Gordon L. McDonough | Republican | 1944 | Incumbent re-elected. | √ Gordon L. McDonough (Republican) 51.3% Norman H. Martell (Democratic) 48.7% |
| California 16 | Donald L. Jackson | Republican | 1946 | Incumbent retired. New member elected. Republican hold. |
√ Alphonzo E. Bell, Jr. (Republican) 55.4% Jerry Pacht (Democratic) 44.6% |
| California 17 | Cecil R. King | Democratic | 1942 | Incumbent re-elected. | √ Cecil R. King (Democratic) 67.7% Tom Coffee (Republican) 32.3% |
| California 18 | Craig Hosmer | Republican | 1952 | Incumbent re-elected. | √ Craig Hosmer (Republican) 70.0% D. Patrick Ahern (Democratic) 30.0% |
| California 19 | Chet Holifield | Democratic | 1942 | Incumbent re-elected. | √ Chet Holifield (Democratic) 78.2% Gordon S. McWilliams (Republican) 21.8% |
| California 20 | H. Allen Smith | Republican | 1956 | Incumbent re-elected. | √ H. Allen Smith (Republican) 70.1% Gareth W. Sadler (Democratic) 29.9% |
| California 21 | Edgar W. Hiestand | Republican | 1952 | Incumbent re-elected. | √ Edgar W. Hiestand (Republican) 58.4% Rudd Brown (Democratic) 41.6% |
| California 22 | Joseph F. Holt | Republican | 1952 | Incumbent retired. New member elected. Democratic gain. |
√ James C. Corman (Democratic) 51.1% Lemoine Blanchard (Republican) 48.9% |
| California 23 | Clyde Doyle | Democratic | 1948 | Incumbent re-elected. | √ Clyde Doyle (Democratic) 74.2% Emmett A. Schwartz (Republican) 25.8% |
| California 24 | Glenard P. Lipscomb | Republican | 1953 | Incumbent re-elected. | √ Glenard P. Lipscomb (Republican) 59.7% Norman Hass (Democratic) 40.3% |
| California 25 | George A. Kasem | Democratic | 1958 | Incumbent lost re-election. New member elected. Republican gain. |
√ John H. Rousselot (Republican) 53.6% George A. Kasem (Democratic) 46.4% |
| California 26 | James Roosevelt | Democratic | 1954 | Incumbent re-elected. | √ James Roosevelt (Democratic) 73.4% William E. McIntyre (Republican) 26.6% |
| California 27 | Harry R. Sheppard | Democratic | 1936 | Incumbent re-elected. | √ Harry R. Sheppard (Democratic) 66.8% Robert M. Castle (Republican) 33.2% |
| California 28 | James B. Utt | Republican | 1952 | Incumbent re-elected. | √ James B. Utt (Republican) 60.9% Max E. Woods (Democratic) 39.1% |
| California 29 | Dalip Singh Saund | Democratic | 1956 | Incumbent re-elected. | √ Dalip Singh Saund (Democratic) 57.1% Charles H. Jameson (Republican) 42.9% |
| California 30 | Bob Wilson | Republican | 1952 | Incumbent re-elected. | √ Bob Wilson (Republican) 59.3% Walter Wencke (Democratic) 40.7% |
Colorado
| District | Incumbent | Results | Candidates | ||
|---|---|---|---|---|---|
| Senator | Party | First elected | |||
| Colorado 1 | Byron G. Rogers | Democratic | 1950 | Incumbent re-elected. | √ Byron G. Rogers (Democratic) 60.0% Robert D. Rolander (Republican) 40.0% |
| Colorado 2 | Byron L. Johnson | Democratic | 1958 | Incumbent lost re-election. New member elected. Republican gain. |
√ Peter H. Dominick (Republican) 57.6% Byron L. Johnson (Democratic) 42.4% |
| Colorado 3 | John Chenoweth | Republican | 1950 | Incumbent re-elected. | √ John Chenoweth (Republican) 52.0% Franklin R. Stewart (Democratic) 48.0% |
| Colorado 4 | Wayne N. Aspinall | Democratic | 1948 | Incumbent re-elected. | √ Wayne N. Aspinall (Democratic) 68.5% Charles P. Casteel (Republican) 31.5% |
Connecticut
| District | Incumbent | Results | Candidates | ||
|---|---|---|---|---|---|
| Senator | Party | First elected | |||
| Connecticut 1 | Emilio Q. Daddario | Democratic | 1958 | Incumbent re-elected. | √ Emilio Q. Daddario (Democratic) 58.5% Thomas F. Brennan (Republican) 41.5% |
| Connecticut 2 | Chester Bowles | Democratic | 1958 | Incumbent retired. New member elected. Republican gain. |
√ Horace Seely-Brown, Jr. (Republican) 50.1% William L. St. Onge (Democratic) 49.9% |
| Connecticut 3 | Robert Giaimo | Democratic | 1958 | Incumbent re-elected. | √ Robert Giaimo (Democratic) 54.9% Albert W. Cretella (Republican) 45.1% |
| Connecticut 4 | Donald J. Irwin | Democratic | 1958 | Incumbent lost re-election. New member elected. Republican gain. |
√ Abner W. Sibal (Republican) 51.3% Donald J. Irwin (Democratic) 48.0% Jasper McLevy (Soc-Lab) 0.8% |
| Connecticut 5 | John S. Monagan | Democratic | 1958 | Incumbent re-elected. | √ John S. Monagan (Democratic) 55.1% James T. Patterson (Republican) 44.9% |
| Connecticut at-large | Frank Kowalski | Democratic | 1958 | Incumbent re-elected. | √ Frank Kowalski (Democratic) 54.0% Antoni N. Sadlak (Republican) 46.0% |
Delaware
| District | Incumbent | Results | Candidates | ||
|---|---|---|---|---|---|
| Senator | Party | First elected | |||
| Delaware at-large | Harris B. McDowell, Jr. | Democratic | 1958 | Incumbent re-elected. | √ Harris B. McDowell, Jr. (Democratic) 50.5% James T. McKinstry (Republican) 49.5% |
Florida
| District | Incumbent | Results | Candidates | ||
|---|---|---|---|---|---|
| Senator | Party | First elected | |||
| Florida 1 | William C. Cramer | Republican | 1954 | Incumbent re-elected. | √ William C. Cramer (Republican) 58.4% James M. McEwen (Democratic) 41.6% |
| Florida 2 | Charles Edward Bennett | Democratic | 1948 | Incumbent re-elected. | √ Charles Edward Bennett (Democratic) 82.5% J. Edward Musser (Republican) 17.5% |
| Florida 3 | Bob Sikes | Democratic | 1940 | Incumbent re-elected. | √ Bob Sikes (Democratic) Unopposed |
| Florida 4 | Dante Fascell | Democratic | 1954 | Incumbent re-elected. | √ Dante Fascell (Democratic) 70.5% Hugh M. Tartaglia (Republican) 29.5% |
| Florida 5 | Syd Herlong | Democratic | 1948 | Incumbent re-elected. | √ Syd Herlong (Democratic) Unopposed |
| Florida 6 | Paul Rogers | Democratic | 1954 | Incumbent re-elected. | √ Paul Rogers (Democratic) 62.0% John D. Kruse (Republican) 38.0% |
| Florida 7 | James A. Haley | Democratic | 1952 | Incumbent re-elected. | √ James A. Haley (Democratic) 61.4% Henry S. Batholomew (Republican) 38.6% |
| Florida 8 | Donald Ray Matthews | Democratic | 1952 | Incumbent re-elected. | √ Donald Ray Matthews (Democratic) Unopposed |
Georgia
| District | Incumbent | Results | Candidates | ||
|---|---|---|---|---|---|
| Senator | Party | First elected | |||
| Georgia 1 | Prince Hulon Preston, Jr. | Democratic | 1946 | Incumbent lost renomination. New member elected. Democratic hold. |
√ George Elliott Hagan (Democratic) Unopposed |
| Georgia 2 | J. L. Pilcher | Democratic | 1953 | Incumbent re-elected. | √ J. L. Pilcher (Democratic) Unopposed |
| Georgia 3 | Tic Forrester | Democratic | 1950 | Incumbent re-elected. | √ Tic Forrester (Democratic) Unopposed |
| Georgia 4 | John James Flynt, Jr. | Democratic | 1954 | Incumbent re-elected. | √ John James Flynt, Jr. (Democratic) Unopposed |
| Georgia 5 | James C. Davis | Democratic | 1946 | Incumbent re-elected. | √ James C. Davis (Democratic) Unopposed |
| Georgia 6 | Carl Vinson | Democratic | 1914 | Incumbent re-elected. | √ Carl Vinson (Democratic) Unopposed |
| Georgia 7 | Harlan Erwin Mitchell | Democratic | 1958 | Retired to run for Georgia State Senator. New member elected. Democratic hold. |
√ John W. Davis (Democratic) 74.2% E. Ralph Ivey (Republican) 25.8% |
| Georgia 8 | Iris Faircloth Blitch | Democratic | 1954 | Incumbent re-elected. | √ Iris Faircloth Blitch (Democratic) Unopposed |
| Georgia 9 | Phillip M. Landrum | Democratic | 1952 | Incumbent re-elected. | √ Phillip M. Landrum (Democratic) Unopposed |
| Georgia 10 | Paul Brown | Democratic | 1933 | Incumbent retired. New member elected. Democratic hold. |
√ Robert Grier Stephens, Jr. (Democratic) Unopposed |
Hawaii
| District | Incumbent | Results | Candidates | ||
|---|---|---|---|---|---|
| Senator | Party | First elected | |||
| Hawaii at-large | Daniel Inouye | Democratic | 1959 | Incumbent re-elected. | √ Daniel Inouye (Democratic) 74.4% Frederick Titcomb (Republican) 25.6% |
Idaho
| District | Incumbent | Results | Candidates | ||
|---|---|---|---|---|---|
| Senator | Party | First elected | |||
| Idaho 1 | Gracie Pfost | Democratic | 1952 | Incumbent re-elected. | √ Gracie Pfost (Democratic) 60.4% Thomas A. Leupp (Republican) 39.6% |
| Idaho 2 | Hamer H. Budge | Republican | 1950 | Incumbent lost re-election. New member elected. Democratic gain. |
√ Ralph R. Harding (Democratic) 51.2% Hamer H. Budge (Republican) 48.8% |
Illinois
| District | Incumbent | Results | Candidates | ||
|---|---|---|---|---|---|
| Senator | Party | First elected | |||
| Illinois 1 | William L. Dawson | Democratic | 1942 | Incumbent re-elected. | √ William L. Dawson (Democratic) 77.8% Genoa S. Washington (Republican) 22.2% |
| Illinois 2 | Barratt O'Hara | Democratic | 1952 | Incumbent re-elected. | √ Barratt O'Hara (Democratic) 66.6% Bernard E. Epton (Republican) 33.4% |
| Illinois 3 | William T. Murphy | Democratic | 1958 | Incumbent re-elected. | √ William T. Murphy (Democratic) 59.1% Emmet F. Byrne (Republican) 40.9% |
| Illinois 4 | Ed Derwinski | Republican | 1958 | Incumbent re-elected. | √ Ed Derwinski (Republican) 55.9% Frank J. Sulewski (Democratic) 44.1% |
| Illinois 5 | John C. Kluczynski | Democratic | 1950 | Incumbent re-elected. | √ John C. Kluczynski (Democratic) 71.2% Edward J. Tomek (Republican) 28.8% |
| Illinois 6 | Thomas J. O'Brien | Democratic | 1942 | Incumbent re-elected. | √ Thomas J. O'Brien (Democratic) 71.7% Frank S. Estes (Republican) 28.3% |
| Illinois 7 | Roland V. Libonati | Democratic | 1957 | Incumbent re-elected. | √ Roland V. Libonati (Democratic) 80.5% Lawrence J. Blasi (Republican) 19.5% |
| Illinois 8 | Dan Rostenkowski | Democratic | 1958 | Incumbent re-elected. | √ Dan Rostenkowski (Democratic) 67.2% Henry Klinger, Jr. (Republican) 32.8% |
| Illinois 9 | Sidney R. Yates | Democratic | 1948 | Incumbent re-elected. | √ Sidney R. Yates (Democratic) 60.0% Chester E. Emanuelson (Republican) 40.0% |
| Illinois 10 | Harold R. Collier | Republican | 1956 | Incumbent re-elected. | √ Harold R. Collier (Republican) 57.1% Edward V. Hanrahan (Democratic) 42.9% |
| Illinois 11 | Roman C. Pucinski | Democratic | 1958 | Incumbent re-elected. | √ Roman C. Pucinski (Democratic) 54.0% Timothy P. Sheehan (Republican) 46.0% |
| Illinois 12 | Charles A. Boyle | Democratic | 1954 | Incumbent died November 4, 1959. New member elected. Democratic hold. |
√ Edward Rowan Finnegan (Democratic) 50.8% Theodore P. Fields (Republican) 49.2% |
| Illinois 13 | Marguerite S. Church | Republican | 1950 | Incumbent re-elected. | √ Marguerite S. Church (Republican) 66.0% Tyler Thompson (Democratic) 34.0% |
| Illinois 14 | Elmer J. Hoffman | Republican | 1958 | Incumbent re-elected. | √ Elmer J. Hoffman (Republican) 63.8% Hayes Beall (Democratic) 36.2% |
| Illinois 15 | Noah M. Mason | Republican | 1936 | Incumbent re-elected. | √ Noah M. Mason (Republican) 50.5% Dorothy G. O'Brien (Democratic) 49.5% |
| Illinois 16 | Leo E. Allen | Republican | 1932 | Incumbent retired. New member elected. Republican hold. |
√ John B. Anderson (Republican) 62.3% Edwin M. Nelson (Democratic) 37.7% |
| Illinois 17 | Leslie C. Arends | Republican | 1934 | Incumbent re-elected. | √ Leslie C. Arends (Republican) 61.3% William T. Larkin (Democratic) 38.7% |
| Illinois 18 | Robert H. Michel | Republican | 1956 | Incumbent re-elected. | √ Robert H. Michel (Republican) 59.3% Richard A. Estep (Democratic) 40.7% |
| Illinois 19 | Robert B. Chiperfield | Republican | 1938 | Incumbent re-elected. | √ Robert B. Chiperfield (Republican) 50.6% John C. Watson (Democratic) 49.4% |
| Illinois 20 | Edna O. Simpson | Republican | 1958 | Incumbent retired. New member elected. Republican hold. |
√ Paul Findley (Republican) 55.6% Montgomery B. Carrott (Democratic) 44.4% |
| Illinois 21 | Peter F. Mack, Jr. | Democratic | 1948 | Incumbent re-elected. | √ Peter F. Mack, Jr. (Democratic) 54.7% J. Waldo Ackerman, Jr. (Republican) 45.3% |
| Illinois 22 | William L. Springer | Republican | 1950 | Incumbent re-elected. | √ William L. Springer (Republican) 61.4% James T. Nally (Democratic) 38.6% |
| Illinois 23 | George E. Shipley | Democratic | 1958 | Incumbent re-elected. | √ George E. Shipley (Democratic) 51.6% Frank H. Walker (Republican) 48.4% |
| Illinois 24 | Melvin Price | Democratic | 1944 | Incumbent re-elected. | √ Melvin Price (Democratic) 72.2% Phyllis Schlafly (Republican) 27.8% |
| Illinois 25 | Kenneth J. Gray | Democratic | 1954 | Incumbent re-elected. | √ Kenneth J. Gray (Democratic) 57.9% Gordon E. Kerr (Republican) 42.1% |
Indiana
| District | Incumbent | Results | Candidates | ||
|---|---|---|---|---|---|
| Senator | Party | First elected | |||
| Indiana 1 | Ray J. Madden | Democratic | 1942 | Incumbent re-elected. | √ Ray J. Madden (Democratic) 64.7% Philip P. Parker (Republican) 35.1% Vernon N. Sherer (Proh) 0.2% |
| Indiana 2 | Charles A. Halleck | Republican | 1935 | Incumbent re-elected. | √ Charles A. Halleck (Republican) 57.5% George H. Bowers (Democratic) 42.2% Earl F. Dodds (Proh) 0.3% |
| Indiana 3 | John Brademas | Democratic | 1958 | Incumbent re-elected. | √ John Brademas (Democratic) 52.4% F. Jay Nimtz (Republican) 47.6% |
| Indiana 4 | E. Ross Adair | Republican | 1950 | Incumbent re-elected. | √ E. Ross Adair (Republican) 58.2% Byron McCammon (Democratic) 41.8% |
| Indiana 5 | J. Edward Roush | Democratic | 1958 | Incumbent re-elected. | √ J. Edward Roush (Democratic) 50.0% George O. Chambers (Republican) 50.0% |
| Indiana 6 | Fred Wampler | Democratic | 1958 | Incumbent lost re-election. New member elected. Republican gain. |
√ Richard L. Roudebush (Republican) 52.0% Fred Wampler (Democratic) 48.0% |
| Indiana 7 | William G. Bray | Republican | 1950 | Incumbent re-elected. | √ William G. Bray (Republican) 60.1% Thomas C. Cravens (Democratic) 39.9% |
| Indiana 8 | Winfield K. Denton | Democratic | 1954 | Incumbent re-elected. | √ Winfield K. Denton (Democratic) 53.2% Alvan V. Burch (Republican) 46.6% J. C. Kelly (Proh) 0.2% |
| Indiana 9 | Earl Hogan | Democratic | 1958 | Incumbent lost re-election. New member elected. Republican gain. |
√ Earl Wilson (Republican) 50.6% Earl Hogan (Democratic) 49.4% |
| Indiana 10 | Randall S. Harmon | Democratic | 1958 | Incumbent lost re-election. New member elected. Republican gain. |
√ Ralph Harvey (Republican) 57.1% Randall S. Harmon (Democratic) 42.9% |
| Indiana 11 | Joseph W. Barr | Democratic | 1958 | Incumbent lost re-election. New member elected. Republican gain. |
√ Donald Cogley Bruce (Republican) 53.7% Joseph W. Barr (Democratic) 46.2% Frank N. Williams (Proh) 0.1% |
Iowa
| District | Incumbent | Results | Candidates | ||
|---|---|---|---|---|---|
| Senator | Party | First elected | |||
| Iowa 1 | Fred Schwengel | Republican | 1954 | Incumbent re-elected. | √ Fred Schwengel (Republican) 60.9% Walter J. Guenther (Democratic) 39.1% |
| Iowa 2 | Leonard G. Wolf | Democratic | 1958 | Incumbent lost re-election. New member elected. Republican gain. |
√ James E. Bromwell (Republican) 52.6% Leonard G. Wolf (Democratic) 47.4% |
| Iowa 3 | H. R. Gross | Republican | 1948 | Incumbent re-elected. | √ H. R. Gross (Republican) 56.3% Michael Micich (Democratic) 43.7% |
| Iowa 4 | John Henry Kyl | Republican | 1959 | Incumbent re-elected. | √ John Henry Kyl (Republican) 56.6% C. Edwin Gilmour (Democratic) 43.4% |
| Iowa 5 | Neal Smith | Democratic | 1958 | Incumbent re-elected. | √ Neal Smith (Democratic) 53.0% Floyd M. Burgeson (Republican) 47.0% |
| Iowa 6 | Merwin Coad | Democratic | 1956 | Incumbent re-elected. | √ Merwin Coad (Democratic) 53.6% Curtis G. Riehm (Republican) 46.4% |
| Iowa 7 | Ben F. Jensen | Republican | 1938 | Incumbent re-elected. | √ Ben F. Jensen (Republican) 55.8% Duane Orton (Democratic) 44.2% |
| Iowa 8 | Charles B. Hoeven | Republican | 1942 | Incumbent re-elected. | √ Charles B. Hoeven (Republican) 57.5% Donald E. O'Brien (Democratic) 42.5% |
Kansas
| District | Incumbent | Results | Candidates | ||
|---|---|---|---|---|---|
| Senator | Party | First elected | |||
| Kansas 1 | William H. Avery | Republican | 1954 | Incumbent re-elected. | √ William H. Avery (Republican) 63.1% Marshall G. Gardiner (Democratic) 36.9% |
| Kansas 2 | Newell A. George | Democratic | 1958 | Incumbent lost re-election. New member elected. Republican gain. |
√ Robert Fred Ellsworth (Republican) 52.3% Newell A. George (Democratic) 47.7% |
| Kansas 3 | Denver D. Hargis | Democratic | 1958 | Incumbent lost re-election. New member elected. Republican gain. |
√ Walter L. McVey, Jr. (Republican) 51.2% Denver D. Hargis (Democratic) 48.8% |
| Kansas 4 | Edward Herbert Rees | Republican | 1936 | Incumbent retired. New member elected. Republican hold. |
√ Garner E. Shriver (Republican) 55.2% William I. Robinson (Democratic) 44.8% |
| Kansas 5 | James Floyd Breeding | Democratic | 1956 | Incumbent re-elected. | √ James Floyd Breeding (Democratic) 55.5% Joe W. Hunter (Republican) 44.5% |
| Kansas 6 | Wint Smith | Republican | 1946 | Incumbent retired. New member elected. Republican hold. |
√ Bob Dole (Republican) 59.3% William A. Davis (Democratic) 40.7% |
Kentucky
| District | Incumbent | Results | Candidates | ||
|---|---|---|---|---|---|
| Senator | Party | First elected | |||
| Kentucky 1 | Frank Stubblefield | Democratic | 1958 | Incumbent re-elected. | √ Frank Stubblefield (Democratic) Unopposed |
| Kentucky 2 | William Huston Natcher | Democratic | 1953 | Incumbent re-elected. | √ William Huston Natcher (Democratic) Unopposed |
| Kentucky 3 | Frank W. Burke | Democratic | 1958 | Incumbent re-elected. | √ Frank W. Burke (Democratic) 50.3% Henry R. Heyburn (Republican) 49.7% |
| Kentucky 4 | Frank Chelf | Democratic | 1944 | Incumbent re-elected. | √ Frank Chelf (Democratic) Unopposed |
| Kentucky 5 | Brent Spence | Democratic | 1930 | Incumbent re-elected. | √ Brent Spence (Democratic) 55.4% Jule Appel (Republican) 44.6% |
| Kentucky 6 | John C. Watts | Democratic | 1951 | Incumbent re-elected. | √ John C. Watts (Democratic) 54.7% Howard A. Dickey (Republican) 45.3% |
| Kentucky 7 | Carl D. Perkins | Democratic | 1948 | Incumbent re-elected. | √ Carl D. Perkins (Democratic) 56.1% Herbert Rowland (Republican) 43.9% |
| Kentucky 8 | Eugene Siler | Republican | 1954 | Incumbent re-elected. | √ Eugene Siler (Republican) 71.8% Donald R. Shepherd (Democratic) 28.2% |
Louisiana
| District | Incumbent | Results | Candidates | ||
|---|---|---|---|---|---|
| Senator | Party | First elected | |||
| Louisiana 1 | F. Edward Hebert | Democratic | 1940 | Incumbent re-elected. | √ F. Edward Hebert (Democratic) 82.1% Norman W. Prendergast (Republican) 17.9% |
| Louisiana 2 | Hale Boggs | Democratic | 1946 | Incumbent re-elected. | √ Hale Boggs (Democratic) 78.0% Elliott Ross Buckley (Republican) 22.0% (cousin of William F. Buckley, Jr.) |
| Louisiana 3 | Edwin E. Willis | Democratic | 1948 | Incumbent re-elected. | √ Edwin E. Willis (Democratic) 83.6% Floyd J. Duplantis (Republican) 16.4% |
| Louisiana 4 | Overton Brooks | Democratic | 1936 | Incumbent re-elected. | √ Overton Brooks (Democratic) 74.9% Fred Charles McClanahan, Jr. (Republican) 25.1% |
| Louisiana 5 | Otto Passman | Democratic | 1946 | Incumbent re-elected. | √ Otto Passman (Democratic) Unopposed |
| Louisiana 6 | James H. Morrison | Democratic | 1942 | Incumbent re-elected. | √ James H. Morrison (Democratic) 85.6% Charles H. Dillemuth (Republican) 14.4% |
| Louisiana 7 | T. Ashton Thompson | Democratic | 1952 | Incumbent re-elected. | √ T. Ashton Thompson (Democratic) Unopposed |
| Louisiana 8 | Harold B. McSween | Democratic | 1958 | Incumbent re-elected. | √ Harold B. McSween (Democratic) Unopposed |
Maine
| District | Incumbent | Results | Candidates | ||
|---|---|---|---|---|---|
| Senator | Party | First elected | |||
| Maine 1 | James C. Oliver | Democratic | 1958 | Incumbent lost re-election. New member elected. Republican gain. |
√ Peter A. Garland (Republican) 53.8% James C. Oliver (Democratic) 46.2% |
| Maine 2 | Frank M. Coffin | Democratic | 1956 | Retired to run for Governor New member elected. Republican gain. |
√ Stanley R. Tupper (Republican) 53.4% John C. Donovan (Democratic) 46.6% |
| Maine 3 | Clifford McIntire | Republican | 1951 | Incumbent re-elected. | √ Clifford McIntire (Republican) 64.1% David G. Roberts (Democratic) 35.9% |
Maryland
| District | Incumbent | Results | Candidates | ||
|---|---|---|---|---|---|
| Senator | Party | First elected | |||
| Maryland 1 | Thomas F. Johnson | Democratic | 1958 | Incumbent re-elected. | √ Thomas F. Johnson (Democratic) 53.6% Edward T. Miller (Republican) 46.4% |
| Maryland 2 | Daniel Brewster | Democratic | 1958 | Incumbent re-elected. | √ Daniel Brewster (Democratic) 58.6% Fife Symington (Republican) 41.4% |
| Maryland 3 | Edward Garmatz | Democratic | 1947 | Incumbent re-elected. | √ Edward Garmatz (Democratic) 80.3% Robert J. Gerstung (Republican) 19.7% |
| Maryland 4 | George Hyde Fallon | Democratic | 1944 | Incumbent re-elected. | √ George Hyde Fallon (Democratic) 65.5% Melvin R. Kenney (Republican) 34.5% |
| Maryland 5 | Richard E. Lankford | Democratic | 1954 | Incumbent re-elected. | √ Richard E. Lankford (Democratic) 62.2% Carlyle J. Lancaster (Republican) 37.8% |
| Maryland 6 | John R. Foley | Democratic | 1958 | Incumbent lost re-election. New member elected. Republican gain. |
√ Charles Mathias, Jr. (Republican) 52.0% John R. Foley (Democratic) 48.0% |
| Maryland 7 | Samuel Friedel | Democratic | 1952 | Incumbent re-elected. | √ Samuel Friedel (Democratic) 64.5% David M. Blum (Republican) 35.5% |
Massachusetts
| District | Incumbent | Results | Candidates | ||
|---|---|---|---|---|---|
| Senator | Party | First elected | |||
| Massachusetts 1 | Silvio Conte | Republican | 1958 | Incumbent re-elected. | √ Silvio Conte (Republican) 68.5% William H. Burns (Democratic) 31.2% Arthur J. Green (Proh) 0.3% |
| Massachusetts 2 | Edward Boland | Democratic | 1952 | Incumbent re-elected. | √ Edward Boland (Democratic) Unopposed |
| Massachusetts 3 | Philip Philbin | Democratic | 1942 | Incumbent re-elected. | √ Philip Philbin (Democratic) Unopposed |
| Massachusetts 4 | Harold Donohue | Democratic | 1946 | Incumbent re-elected. | √ Harold Donohue (Democratic) 64.5% Robert N. Scola (Republican) 35.5% |
| Massachusetts 5 | Edith Nourse Rogers | Republican | 1925 | Incumbent died September 10, 1960. New member elected. Republican hold. |
√ Frank B. Morse (Republican) 54.5% William C. Madden (Democratic) 45.5% |
| Massachusetts 6 | William H. Bates | Republican | 1950 | Incumbent re-elected. | √ William H. Bates (Republican) 65.9% Mary Kennedy (Democratic) 34.1% |
| Massachusetts 7 | Thomas J. Lane | Democratic | 1941 | Incumbent re-elected. | √ Thomas J. Lane (Democratic) Unopposed |
| Massachusetts 8 | Torbert H. MacDonald | Democratic | 1954 | Incumbent re-elected. | √ Torbert H. MacDonald (Democratic) 65.9% Ward Collins Cramer (Republican) 34.1% |
| Massachusetts 9 | Hastings Keith | Republican | 1958 | Incumbent re-elected. | √ Hastings Keith (Republican) 55.7% Edward F. Harrington (Democratic) 44.3% |
| Massachusetts 10 | Laurence Curtis | Republican | 1952 | Incumbent re-elected. | √ Laurence Curtis (Republican) 58.2% Joseph J. Mulhern, Jr. (Democratic) 41.8% |
| Massachusetts 11 | Tip O'Neill | Democratic | 1952 | Incumbent re-elected. | √ Tip O'Neill (Democratic) Unopposed |
| Massachusetts 12 | John William McCormack | Democratic | 1928 | Incumbent re-elected. | √ John William McCormack (Democratic) Unopposed |
| Massachusetts 13 | James A. Burke | Democratic | 1958 | Incumbent re-elected. | √ James A. Burke (Democratic) 58.5% Charles J. Gabriel (Republican) 41.5% |
| Massachusetts 14 | Joseph William Martin, Jr. | Republican | 1924 | Incumbent re-elected. | √ Joseph William Martin, Jr. (Republican) 60.3% Edward F. Doolan (Democratic) 39.7% |
Michigan
| District | Incumbent | Results | Candidates | ||
|---|---|---|---|---|---|
| Senator | Party | First elected | |||
| Michigan 1 | Thaddeus M. Machrowicz | Democratic | 1950 | Incumbent re-elected. | √ Thaddeus M. Machrowicz (Democratic) 88.4% Walter Czarnecki (Republican) 11.3% Peter Stayanoff (Soc-Lab) 0.1% Adam Kempa (Ind Amer) 0.09% Carroll Ambler (Proh) 0.05% |
| Michigan 2 | George Meader | Republican | 1950 | Incumbent re-elected. | √ George Meader (Republican) 59.6% Thomas P. Payne (Democratic) 40.2% Verdon R. Dunckel (Proh) 0.09% Edmund T. Taylor (Soc-Lab) 0.04% Ray W. Graham (Ind Amer) 0.04% |
| Michigan 3 | August E. Johansen | Republican | 1954 | Incumbent re-elected. | √ August E. Johansen (Republican) 60.5% Samuel I. Clark (Democratic) 39.2% Floyd R. Latta (Proh) 0.2% |
| Michigan 4 | Clare E. Hoffman | Republican | 1934 | Incumbent re-elected. | √ Clare E. Hoffman (Republican) 62.3% Edward Burns (Democratic) 37.5% Jerry Johncock (Proh) 0.2% |
| Michigan 5 | Gerald Ford | Republican | 1948 | Incumbent re-elected. | √ Gerald Ford (Republican) 66.8% William G. Reamon (Democratic) 33.1% LeRoy A. Robert (Proh) 0.06% Donald Teets (Soc-Lab) 0.03% |
| Michigan 6 | Charles E. Chamberlain | Republican | 1956 | Incumbent re-elected. | √ Charles E. Chamberlain (Republican) 56.6% Jerome F. O'Rourke (Democratic) 43.3% Paul H. Kyburz (Proh) 0.09% |
| Michigan 7 | James G. O'Hara | Democratic | 1958 | Incumbent re-elected. | √ James G. O'Hara (Democratic) 53.3% Robert J. McIntosh (Republican) 46.6% Clarence E. Smith (Proh) 0.05% Mary Mills (Soc-Lab) 0.05% Raymond E. Watrous (Ind Amer) 0.03% |
| Michigan 8 | Alvin Morell Bentley | Republican | 1952 | Retired to run for U.S. Senator New member elected. Republican hold. |
√ R. James Harvey (Republican) 62.2% Mary M. Harden (Democratic) 37.6% Herald F. DeWeese (Proh) 0.1% |
| Michigan 9 | Robert P. Griffin | Republican | 1956 | Incumbent re-elected. | √ Robert P. Griffin (Republican) 59.6% Donald G. Jennings (Democratic) 40.3% Carl E. Ruble (Proh) 0.07% |
| Michigan 10 | Elford Albin Cederberg | Republican | 1952 | Incumbent re-elected. | √ Elford Albin Cederberg (Republican) 62.1% Daniel E. Reed (Democratic) 37.8% Mildred Montgomery (Proh) 0.09% |
| Michigan 11 | Victor A. Knox | Republican | 1952 | Incumbent re-elected. | √ Victor A. Knox (Republican) 54.8% Prentiss M. Brown, Jr. (Democratic) 45.1% Elving Thorpe (Proh) 0.05% |
| Michigan 12 | John B. Bennett | Republican | 1946 | Incumbent re-elected. | √ John B. Bennett (Republican) 60.8% Robert C. McCarthy (Democratic) 39.1% Halmer Dahlgren (Proh) 0.05% |
| Michigan 13 | Charles Diggs | Democratic | 1954 | Incumbent re-elected. | √ Charles Diggs (Democratic) 71.4% Robert B. Blackwell (Republican) 28.2% Cleve C. Hull (Ind Amer) 0.1% Peter Goonis (Soc-Lab) 0.1% John T. Wiandt (Tax Cut) 0.09% Vernon Good (Proh) 0.07% |
| Michigan 14 | Louis C. Rabaut | Democratic | 1948 | Incumbent re-elected. | √ Louis C. Rabaut (Democratic) 62.7% Lois V. Nair (Republican) 37.1% C. B. Smith (Tax Cut) 0.09% William Sablich (Soc-Lab) 0.07% Eugene Hopusch (Proh) 0.03% |
| Michigan 15 | John D. Dingell, Jr. | Democratic | 1955 | Incumbent re-elected. | √ John D. Dingell, Jr. (Democratic) 79.4% Robert J. Robbins (Republican) 20.3% Hiram J. Coffman (Proh) 0.1% Joseph Koss (Soc-Lab) 0.08% Curt Engstrom (Ind Amer) 0.06% |
| Michigan 16 | John Lesinski, Sr. | Democratic | 1932 | Incumbent re-elected. | √ John Lesinski, Sr. (Democratic) 66.0% Lee H. Clark (Republican) 33.8% James C. Horvath (Soc-Lab) 0.09% Paul D. Gariepy (Ind Amer) 0.05% Lucy Larkin (Proh) 0.04% |
| Michigan 17 | Martha W. Griffiths | Democratic | 1954 | Incumbent re-elected. | √ Martha W. Griffiths (Democratic) 57.6% Richard E. Morell (Republican) 42.2% William Walbridge (Soc-Lab) 0.07% J. Byron Stover (Ind Amer) 0.05% Sadie Grass (Tax Cut) 0.03% Richard Zeller (Proh) 0.03% |
| Michigan 18 | William Broomfield | Republican | 1956 | Incumbent re-elected. | √ William Broomfield (Republican) 55.8% James Kellis (Democratic) 44.0% Fred Mayers (Soc-Lab) 0.06% Hugh J. Thomas (Ind Amer) 0.04% Phyllis G. Kile (Proh) 0.03% |
Minnesota
| District | Incumbent | Results | Candidates | ||
|---|---|---|---|---|---|
| Senator | Party | First elected | |||
| Minnesota 1 | Al Quie | Republican | 1958 | Incumbent re-elected. | √ Al Quie (Republican) 60.5% George Shepherd (DFL) 39.5% |
| Minnesota 2 | Ancher Nelsen | Republican | 1958 | Incumbent re-elected. | √ Ancher Nelsen (Republican) 57.2% Russel Schwandt (DFL) 42.8% |
| Minnesota 3 | Roy W. Wier | Democratic | 1948 | Incumbent lost re-election. New member elected. Republican gain. |
√ Clark MacGregor (Republican) 52.5% Roy W. Wier (DFL) 47.5% |
| Minnesota 4 | Joseph Karth | Democratic | 1958 | Incumbent re-elected. | √ Joseph Karth (DFL) 61.0% Joseph J. Mitchell (Republican) 39.0% |
| Minnesota 5 | Walter Judd | Republican | 1942 | Incumbent re-elected. | √ Walter Judd (Republican) 60.9% George J. Matthews (DFL) 39.1% |
| Minnesota 6 | Fred Marshall | Democratic | 1948 | Incumbent re-elected. | √ Fred Marshall (DFL) 59.6% Frank L. King (Republican) 40.4% |
| Minnesota 7 | H. Carl Andersen | Republican | 1938 | Incumbent re-elected. | √ H. Carl Andersen (Republican) 52.5% Gordon E. Duenow (DFL) 47.5% |
| Minnesota 8 | John Blatnik | Democratic | 1946 | Incumbent re-elected. | √ John Blatnik (DFL) 69.5% Jerry H. Ketola (Republican) 30.5% |
| Minnesota 9 | Odin Langen | Republican | 1958 | Incumbent re-elected. | √ Odin Langen (Republican) 52.2% Coya Knutson (DFL) 47.8% |
Mississippi
| District | Incumbent | Results | Candidates | ||
|---|---|---|---|---|---|
| Senator | Party | First elected | |||
| Mississippi 1 | Thomas Abernethy | Democratic | 1942 | Incumbent re-elected. | √ Thomas Abernethy (Democratic) 93.6% Edward W. Scott (Republican) 6.4% |
| Mississippi 2 | Jamie L. Whitten | Democratic | 1941 | Incumbent re-elected. | √ Jamie L. Whitten (Democratic) Unopposed |
| Mississippi 3 | Frank E. Smith | Democratic | 1950 | Incumbent re-elected. | √ Frank E. Smith (Democratic) 92.7% W. A. Clark (Republican) 7.3% |
| Mississippi 4 | John Bell Williams | Democratic | 1946 | Incumbent re-elected. | √ John Bell Williams (Democratic) Unopposed |
| Mississippi 5 | W. Arthur Winstead | Democratic | 1942 | Incumbent re-elected. | √ W. Arthur Winstead (Democratic) Unopposed |
| Mississippi 6 | William M. Colmer | Democratic | 1932 | Incumbent re-elected. | √ William M. Colmer (Democratic) Unopposed |
Missouri
| District | Incumbent | Results | Candidates | ||
|---|---|---|---|---|---|
| Senator | Party | First elected | |||
| Missouri 1 | Frank M. Karsten | Democratic | 1946 | Incumbent re-elected. | √ Frank M. Karsten (Democratic) 70.8% Sam J. Kallaos (Republican) 29.2% |
| Missouri 2 | Thomas B. Curtis | Republican | 1950 | Incumbent re-elected. | √ Thomas B. Curtis (Republican) 56.7% Richard L. Carp (Democratic) 43.3% |
| Missouri 3 | Leonor Sullivan | Democratic | 1952 | Incumbent re-elected. | √ Leonor Sullivan (Democratic) 73.3% Morton L. Schwartz (Republican) 26.7% |
| Missouri 4 | William J. Randall | Democratic | 1959 | Incumbent re-elected. | √ William J. Randall (Democratic) 54.0% Kenneth K. Lowe (Republican) 46.0% |
| Missouri 5 | Richard Bolling | Democratic | 1948 | Incumbent re-elected. | √ Richard Bolling (Democratic) 61.0% Clinton H. Gates (Republican) 39.0% |
| Missouri 6 | William Raleigh Hull, Jr. | Democratic | 1954 | Incumbent re-elected. | √ William Raleigh Hull, Jr. (Democratic) 54.6% Ethan H. Campbell (Republican) 45.4% |
| Missouri 7 | Charles Harrison Brown | Democratic | 1956 | Incumbent lost re-election. New member elected. Republican gain. |
√ Durward Gorham Hall (Republican) 54.9% Charles Harrison Brown (Democratic) 45.1% |
| Missouri 8 | A. S. J. Carnahan | Democratic | 1948 | Incumbent lost renomination. New member elected. Democratic hold. |
√ Richard Howard Ichord, Jr. (Democratic) 58.0% Curtis J. Tindel (Republican) 42.0% |
| Missouri 9 | Clarence Cannon | Democratic | 1922 | Incumbent re-elected. | √ Clarence Cannon (Democratic) 59.8% Anthony C. Schroeder (Republican) 40.2% |
| Missouri 10 | Paul C. Jones | Democratic | 1948 | Incumbent re-elected. | √ Paul C. Jones (Democratic) Unopposed |
| Missouri 11 | Morgan M. Moulder | Democratic | 1948 | Incumbent re-elected. | √ Morgan M. Moulder (Democratic) 50.1% Robert A. Bartel (Republican) 49.9% |
Montana
| District | Incumbent | Results | Candidates | ||
|---|---|---|---|---|---|
| Senator | Party | First elected | |||
| Montana 1 | Lee Metcalf | Democratic | 1952 | Retired to run for U.S. Senator. New member elected. Democratic hold. |
√ Arnold Olsen (Democratic) 53.3% George P. Sarsfield (Republican) 46.7% |
| Montana 2 | LeRoy H. Anderson | Democratic | 1956 | Retired to run for U.S. Senator. New member elected. Republican gain. |
√ James Franklin Battin (Republican) 50.9% Leo Graybill, Jr. (Democratic) 49.1% |
Nebraska
| District | Incumbent | Results | Candidates | ||
|---|---|---|---|---|---|
| Senator | Party | First elected | |||
| Nebraska 1 | Phillip Hart Weaver | Republican | 1954 | Incumbent re-elected. | √ Phillip Hart Weaver (Republican) 55.5% Gerald T. Whelan (Democratic) 44.5% |
| Nebraska 2 | Glenn Cunningham | Republican | 1956 | Incumbent re-elected. | √ Glenn Cunningham (Republican) 66.6% Joseph V. Benesch (Democratic) 33.4% |
| Nebraska 3 | Lawrence Brock | Democratic | 1958 | Incumbent lost re-election. New member elected. Republican gain. |
√ Ralph F. Beermann (Republican) 51.3% Lawrence Brock (Democratic) 48.7% |
| Nebraska 4 | Donald Francis McGinley | Democratic | 1958 | Incumbent lost re-election. New member elected. Republican gain. |
√ David T. Martin (Republican) 51.1% Donald Francis McGinley (Democratic) 48.9% |
Nevada
| District | Incumbent | Results | Candidates | ||
|---|---|---|---|---|---|
| Senator | Party | First elected | |||
| Nevada at-large | Walter S. Baring, Jr. | Democratic | 1956 | Incumbent re-elected. | √ Walter S. Baring, Jr. (Democratic) 57.5% George W. Malone (Republican) 42.5% |
New Hampshire
| District | Incumbent | Results | Candidates | ||
|---|---|---|---|---|---|
| Senator | Party | First elected | |||
| New Hampshire 1 | Chester Earl Merrow | Republican | 1942 | Incumbent re-elected. | √ Chester Earl Merrow (Republican) 56.5% Romeo J. Champagne (Democratic) 43.5% |
| New Hampshire 2 | Perkins Bass | Republican | 1954 | Incumbent re-elected. | √ Perkins Bass (Republican) 60.3% Stuart V. Nims (Democratic) 39.7% |
New Jersey
| District | Incumbent | Results | Candidates | ||
|---|---|---|---|---|---|
| Senator | Party | First elected | |||
| New Jersey 1 | William T. Cahill | Republican | 1958 | Incumbent re-elected. | √ William T. Cahill (Republican) 57.6% John A. Healey (Democratic) 42.2% Julius Levin (Soc-Lab) 0.2% |
| New Jersey 2 | Milton W. Glenn | Republican | 1957 | Incumbent re-elected. | √ Milton W. Glenn (Republican) 56.5% John A. Miller (Democratic) 43.2% Morris Karp (Soc-Lab) 0.2% |
| New Jersey 3 | James C. Auchincloss | Republican | 1942 | Incumbent re-elected. | √ James C. Auchincloss (Republican) 53.1% Katharine E. White (Democratic) 46.9% |
| New Jersey 4 | Frank Thompson | Democratic | 1954 | Incumbent re-elected. | √ Frank Thompson (Democratic) 60.2% A. Jerome Moore (Republican) 39.6% Howard G. Frank (Conservative) 0.1% Bernardo S. Doganiero (Soc-Lab) 0.10% |
| New Jersey 5 | Peter Frelinghuysen, Jr. | Republican | 1952 | Incumbent re-elected. | √ Peter Frelinghuysen, Jr. (Republican) 58.6% Jerome H. Taub (Democratic) 41.3% Delmar Calwhite (Soc-Lab) 0.2% |
| New Jersey 6 | Florence P. Dwyer | Republican | 1956 | Incumbent re-elected. | √ Florence P. Dwyer (Republican) 57.7% Jack B. Dunn (Democratic) 41.4% John H. Wisner, Jr. (Conservative) 0.7% Alexander Kudlik (Soc-Lab) 0.1% |
| New Jersey 7 | William B. Widnall | Republican | 1950 | Incumbent re-elected. | √ William B. Widnall (Republican) 63.7% James Dobbins (Democratic) 36.0% Robert A. Kretzer (Conservative) 0.3% |
| New Jersey 8 | Gordon Canfield | Republican | 1940 | Incumbent retired. New member elected. Democratic gain. |
√ Charles S. Joelson (Democratic) 52.0% Walter P. Kennedy (Republican) 43.8% Ronald G. Timm (Conservative) 4.0% Harry Santhouse (Soc-Lab) 0.2% |
| New Jersey 9 | Frank C. Osmers, Jr. | Republican | 1951 | Incumbent re-elected. | √ Frank C. Osmers, Jr. (Republican) 58.1% Vincent T. McKenna (Democratic) 41.6% Arthur A. Wacker (Conservative) 0.3% |
| New Jersey 10 | Peter W. Rodino, Jr. | Democratic | 1948 | Incumbent re-elected. | √ Peter W. Rodino, Jr. (Democratic) 65.3% Alphonse A. Miele (Republican) 33.3% Frank J. DeGeorge (Conservative) 1.5% |
| New Jersey 11 | Hugh Joseph Addonizio | Democratic | 1948 | Incumbent re-elected. | √ Hugh Joseph Addonizio (Democratic) 61.4% Frank A. Palmieri (Republican) 36.2% Josephine Underwood (Conservative) 2.1% Julian E. Whitney (Independent) 0.2% |
| New Jersey 12 | George M. Wallhauser | Republican | 1958 | Incumbent re-elected. | √ George M. Wallhauser (Republican) 50.2% Robert R. Peacock (Democratic) 47.7% Tony Marsella (Soc-Lab) 1.6% Harold Poeschel (Conservative) 0.5% |
| New Jersey 13 | Cornelius Edward Gallagher | Democratic | 1958 | Incumbent re-elected. | √ Cornelius Edward Gallagher (Democratic) 68.3% Samuel F. Kanis (Republican) 31.7% |
| New Jersey 14 | Dominick V. Daniels | Democratic | 1958 | Incumbent re-elected. | √ Dominick V. Daniels (Democratic) 57.3% Frank A. Musto (Republican) 41.7% Patrick J. Loori (Independent) 1.0% |
New Mexico
| District | Incumbent | Results | Candidates | ||
|---|---|---|---|---|---|
| Senator | Party | First elected | |||
| New Mexico at-large | Joseph M. Montoya | Democratic | 1957 | Incumbent re-elected. | √ Joseph M. Montoya (Democratic) 29.5% √ Thomas G. Morris (Democratic) 28.8% John D. Robb (Republican) 20.7% Edward V. Balcomb (Republican) 20.7% Helen Galloway (Proh) 0.1% L. F. Ingram (Proh) 0.1% |
| New Mexico at-large | Thomas G. Morris | Democratic | 1958 | Incumbent re-elected. | |
New York
| District | Incumbent | Results | Candidates | ||
|---|---|---|---|---|---|
| Senator | Party | First elected | |||
| New York 1 | Stuyvesant Wainwright | Republican | 1952 | Incumbent lost re-election. New member elected. Democratic gain. |
√ Otis G. Pike (Democratic) 50.4% Stuyvesant Wainwright (Republican) 49.6% |
| New York 2 | Steven Boghos Derounian | Republican | 1952 | Incumbent re-elected. | √ Steven Boghos Derounian (Republican) 61.0% John J. Drury (Democratic) 39.0% |
| New York 3 | Frank J. Becker | Republican | 1952 | Incumbent re-elected. | √ Frank J. Becker (Republican) 54.1% Julius J. Rosen (Democratic) 45.9% |
| New York 4 | Seymour Halpern | Republican | 1958 | Incumbent re-elected. | √ Seymour Halpern (Republican) 55.1% Bernard A. Helfat (Democratic) 44.9% |
| New York 5 | Albert H. Bosch | Republican | 1952 | Retired to run for judge of Queens County court. New member elected. Democratic gain. |
√ Joseph P. Addabbo (Democratic) 54.2% George Archinal (Republican) 45.8% |
| New York 6 | Lester Holtzman | Democratic | 1952 | Incumbent re-elected. | √ Lester Holtzman (Democratic) 65.6% Vincent L. Pitaro (Republican) 34.4% |
| New York 7 | James J. Delaney | Democratic | 1948 | Incumbent re-elected. | √ James J. Delaney (Democratic) 60.7% Edward V. Lisoski (Republican) 39.3% |
| New York 8 | Victor Anfuso | Democratic | 1954 | Incumbent re-elected. | √ Victor Anfuso (Democratic) 72.9% Leon F. Nadrowski (Republican) 27.1% |
| New York 9 | Eugene James Keogh | Democratic | 1936 | Incumbent re-elected. | √ Eugene James Keogh (Democratic) 72.3% Herman Sanders (Republican) 27.7% |
| New York 10 | Edna F. Kelly | Democratic | 1949 | Incumbent re-elected. | √ Edna F. Kelly (Democratic) 76.6% Jerome P. Schneider (Republican) 23.4% |
| New York 11 | Emanuel Celler | Democratic | 1922 | Incumbent re-elected. | √ Emanuel Celler (Democratic) 81.6% Seymour Besunder (Republican) 18.4% |
| New York 12 | Francis E. Dorn | Republican | 1952 | Incumbent lost re-election. New member elected. Democratic gain. |
√ Hugh L. Carey (Democratic) 50.4% Francis E. Dorn (Republican) 49.6% |
| New York 13 | Abraham J. Multer | Democratic | 1947 | Incumbent re-elected. | √ Abraham J. Multer (Democratic) 75.4% Joseph A. DeMarco (Republican) 24.6% |
| New York 14 | John J. Rooney | Democratic | 1944 | Incumbent re-elected. | √ John J. Rooney (Democratic) 70.6% Carlo G. Colavito (Republican) 29.4% |
| New York 15 | John H. Ray | Republican | 1952 | Incumbent re-elected. | √ John H. Ray (Republican) 48.7% John M. Murphy (Democratic) 47.2% Timothy W. Costello (Liberal) 4.1% |
| New York 16 | Adam Clayton Powell, Jr. | Democratic | 1944 | Incumbent re-elected. | √ Adam Clayton Powell, Jr. (Democratic) 71.6% Joseph A. Bailey (Republican) 17.6% Arthur O. Boyer (Liberal) 10.9% |
| New York 17 | John Lindsay | Republican | 1958 | Incumbent re-elected. | √ John Lindsay (Republican) 60.2% William J. Vanden Heuvel (Democratic) 39.8% |
| New York 18 | Alfred E. Santangelo | Democratic | 1956 | Incumbent re-elected. | √ Alfred E. Santangelo (Democratic) 58.3% Charles Muzzicato (Republican) 33.5% Faustino Louis Garcia (Liberal) 8.2% |
| New York 19 | Leonard Farbstein | Democratic | 1956 | Incumbent re-elected. | √ Leonard Farbstein (Democratic) 72.4% Thomas P. O'Callaghan (Republican) 27.6% |
| New York 20 | Ludwig Teller | Democratic | 1956 | Incumbent lost renomination. New member elected. Defeated as Liberal Democratic hold. |
√ William Fitts Ryan (Democratic) 55.7% Morris Aarons (Republican) 30.3% Ludwig Teller (Liberal) 14.0% |
| New York 21 | Herbert Zelenko | Democratic | 1954 | Incumbent re-elected. | √ Herbert Zelenko (Democratic) 74.6% Thomas H. Bartzos (Republican) 25.4% |
| New York 22 | James C. Healey | Democratic | 1956 | Incumbent re-elected. | √ James C. Healey (Democratic) 65.0% Dominick A. Fusco (Republican) 20.6% David I. Wells (Liberal) 14.4% |
| New York 23 | Jacob H. Gilbert | Democratic | March 8, 1960 (Special) |
Incumbent re-elected. | √ Jacob H. Gilbert (Democratic) 70.6% Benjamin Thornley (Republican) 17.5% Nicholas B. Gyory (Liberal) 12.0% |
| New York 24 | Charles A. Buckley | Democratic | 1934 | Incumbent re-elected. | √ Charles A. Buckley (Democratic) 56.6% Michael R. Cappelli (Republican) 27.4% Murray Koenig (Liberal) 16.0% |
| New York 25 | Paul A. Fino | Republican | 1952 | Incumbent re-elected. | √ Paul A. Fino (Republican) 59.8% Eugene L. Sugarman (Democratic) 35.5% Bernard Tobacman (Liberal) 4.7% |
| New York 26 | Edwin B. Dooley | Republican | 1956 | Incumbent re-elected. | √ Edwin B. Dooley (Republican) 52.6% Phil E. Gilbert, Jr. (Democratic) 47.4% |
| New York 27 | Robert R. Barry | Republican | 1958 | Incumbent re-elected. | √ Robert R. Barry (Republican) 56.3% John R. Harold (Democratic) 40.3% Hermoine P. Mokray (Liberal) 3.3% |
| New York 28 | Katharine St. George | Republican | 1946 | Incumbent re-elected. | √ Katharine St. George (Republican) 58.7% James E. Truex (Democratic) 41.3% |
| New York 29 | J. Ernest Wharton | Republican | 1950 | Incumbent re-elected. | √ J. Ernest Wharton (Republican) 56.7% Gore Vidal (Democratic) 43.3% |
| New York 30 | Leo W. O'Brien | Democratic | 1952 | Incumbent re-elected. | √ Leo W. O'Brien (Democratic) 62.9% Irving I. Waxman (Republican) 37.1% |
| New York 31 | Dean P. Taylor | Republican | 1942 | Incumbent retired. New member elected. Republican hold. |
√ Carleton J. King (Republican) 60.4% Louis E. Wolfe (Democratic) 39.6% |
| New York 32 | Samuel S. Stratton | Democratic | 1958 | Incumbent re-elected. | √ Samuel S. Stratton (Democratic) 62.3% W. Clyde Wright (Republican) 37.7% |
| New York 33 | Clarence E. Kilburn | Republican | 1940 | Incumbent re-elected. | √ Clarence E. Kilburn (Republican) 61.9% Edward J. Gosier (Democratic) 35.9% Winfred Harberson (Liberal) 2.3% |
| New York 34 | Alexander Pirnie | Republican | 1958 | Incumbent re-elected. | √ Alexander Pirnie (Republican) 55.3% Edwin L. Slusarczyk (Democratic) 44.7% |
| New York 35 | R. Walter Riehlman | Republican | 1946 | Incumbent re-elected. | √ R. Walter Riehlman (Republican) 53.8% Jerome M. Wilson (Democratic) 44.6% Gerard J. Felter (Liberal) 1.6% |
| New York 36 | John Taber | Republican | 1922 | Incumbent re-elected. | √ John Taber (Republican) 52.6% Francis J. Souhan (Democratic) 47.4% |
| New York 37 | Howard W. Robison | Republican | 1958 | Incumbent re-elected. | √ Howard W. Robison (Republican) 63.4% Joseph V. Julian (Democratic) 36.6% |
| New York 38 | Jessica M. Weis | Republican | 1958 | Incumbent re-elected. | √ Jessica M. Weis (Republican) 57.6% Arthur B. Curran, Jr. (Democratic) 42.4% |
| New York 39 | Harold C. Ostertag | Republican | 1950 | Incumbent re-elected. | √ Harold C. Ostertag (Republican) 59.7% Henry R. Dutcher, Jr. (Democratic) 40.3% |
| New York 40 | William E. Miller | Republican | 1950 | Incumbent re-elected. | √ William E. Miller (Republican) 53.6% Mariano A. Lucca (Democratic) 43.5% Albert J. Taylor (Liberal) 2.9% |
| New York 41 | Thaddeus J. Dulski | Democratic | 1958 | Incumbent re-elected. | √ Thaddeus J. Dulski (Democratic) 56.2% Ralph J. Radwan (Republican) 43.8% |
| New York 42 | John R. Pillion | Republican | 1952 | Incumbent re-elected. | √ John R. Pillion (Republican) 55.4% Charles J. McCabe (Democratic) 42.4% James A. Peck (Liberal) 2.3% |
| New York 43 | Charles Goodell | Republican | 1959 | Incumbent re-elected. | √ Charles Goodell (Republican) 62.8% T. Joseph Lynch (Democratic) 34.7% Elmer Olson (Liberal) 2.5% |
North Carolina
| District | Incumbent | Results | Candidates | ||
|---|---|---|---|---|---|
| Senator | Party | First elected | |||
| North Carolina 1 | Herbert Covington Bonner | Democratic | 1940 | Incumbent re-elected. | √ Herbert Covington Bonner (Democratic) 86.5% Zeno O. Ratcliff (Republican) 13.5% |
| North Carolina 2 | Lawrence H. Fountain | Democratic | 1952 | Incumbent re-elected. | √ Lawrence H. Fountain (Democratic) 87.8% L. Paul Goodling (Republican) 12.2% |
| North Carolina 3 | Graham Arthur Barden | Democratic | 1934 | Incumbent retired. New member elected. Democratic hold. |
√ David N. Henderson (Democratic) 71.2% Jack D. Brinson (Republican) 28.8% |
| North Carolina 4 | Harold D. Cooley | Democratic | 1934 | Incumbent re-elected. | √ Harold D. Cooley (Democratic) 66.6% Elam Reaumuel Temple, Jr. (Republican) 33.4% |
| North Carolina 5 | Ralph James Scott | Democratic | 1956 | Incumbent re-elected. | √ Ralph James Scott (Democratic) 57.6% Russell F. Biggam (Republican) 42.4% |
| North Carolina 6 | Carl T. Durham | Democratic | 1938 | Incumbent retired. New member elected. Democratic hold. |
√ Horace R. Kornegay (Democratic) 59.6% Holland L. Robb (Republican) 40.4% |
| North Carolina 7 | Alton Lennon | Democratic | 1956 | Incumbent re-elected. | √ Alton Lennon (Democratic) 76.5% Joel C. Clifton (Republican) 23.5% |
| North Carolina 8 | Alvin Paul Kitchin | Democratic | 1956 | Incumbent re-elected. | √ Alvin Paul Kitchin (Democratic) 56.3% A. M. Snipes (Republican) 43.7% |
| North Carolina 9 | Hugh Quincy Alexander | Democratic | 1952 | Incumbent re-elected. | √ Hugh Quincy Alexander (Democratic) 53.1% W. S. Bogle (Republican) 46.9% |
| North Carolina 10 | Charles R. Jonas | Republican | 1952 | Incumbent re-elected. | √ Charles R. Jonas (Republican) 58.6% David Clark (Democratic) 41.4% |
| North Carolina 11 | Basil Lee Whitener | Democratic | 1956 | Incumbent re-elected. | √ Basil Lee Whitener (Democratic) 61.1% Kelly Dixon (Republican) 38.9% |
| North Carolina 12 | Roy A. Taylor | Democratic | June 25, 1960 (Special) |
Incumbent re-elected. | √ Roy A. Taylor (Democratic) 52.0% Heinz Rollman (Republican) 48.0% |
North Dakota
| District | Incumbent | Results | Candidates | ||
|---|---|---|---|---|---|
| Senator | Party | First elected | |||
| North Dakota at-large | Don L. Short | Republican | 1958 | Incumbent re-elected. | √ Don L. Short (Republican) 27.5% √ Hjalmar Carl Nygaard (Republican) 25.8% Raymond Vendsel (Democratic) 24.5% Anson J. Anderson (Democratic) 22.2% |
| North Dakota at-large | Quentin N. Burdick | Democratic | 1958 | Incumbent resigned August 8, 1960 when elected U.S. Senator. New member elected. Republican gain. | |
Ohio
| District | Incumbent | Results | Candidates | ||
|---|---|---|---|---|---|
| Senator | Party | First elected | |||
| Ohio 1 | Gordon H. Scherer | Republican | 1952 | Incumbent re-elected. | √ Gordon H. Scherer (Republican) 58.9% W. Ted Osborne (Democratic) 41.1% |
| Ohio 2 | William E. Hess | Republican | 1950 | Incumbent retired. New member elected. Republican hold. |
√ Donald D. Clancy (Republican) 57.4% H. A. Sand (Democratic) 42.6% |
| Ohio 3 | Paul F. Schenck | Republican | 1951 | Incumbent re-elected. | √ Paul F. Schenck (Republican) 62.0% R. William Patterson (Democratic) 38.0% |
| Ohio 4 | William Moore McCulloch | Republican | 1947 | Incumbent re-elected. | √ William Moore McCulloch (Republican) 65.4% Joseph J. Murphy (Democratic) 34.6% |
| Ohio 5 | Del Latta | Republican | 1958 | Incumbent re-elected. | √ Del Latta (Republican) 67.3% Tom T. McRitchie (Democratic) 32.7% |
| Ohio 6 | James G. Polk | Democratic | 1948 | Incumbent died April 28, 1959. New member elected. Republican gain. |
√ Bill Harsha (Republican) 55.2% Franklin E. Smith (Democratic) 44.8% |
| Ohio 7 | Clarence J. Brown | Republican | 1938 | Incumbent re-elected. | √ Clarence J. Brown (Republican) 65.4% Joseph A. Sullivan (Democratic) 34.6% |
| Ohio 8 | Jackson Edward Betts | Republican | 1950 | Incumbent re-elected. | √ Jackson Edward Betts (Republican) 67.7% Virgil M. Gase (Democratic) 32.3% |
| Ohio 9 | Thomas L. Ashley | Democratic | 1954 | Incumbent re-elected. | √ Thomas L. Ashley (Democratic) 56.9% Howard C. Cook (Republican) 43.1% |
| Ohio 10 | Walter H. Moeller | Democratic | 1958 | Incumbent re-elected. | √ Walter H. Moeller (Democratic) 52.5% Oakley C. Collins (Republican) 47.5% |
| Ohio 11 | Robert E. Cook | Democratic | 1958 | Incumbent re-elected. | √ Robert E. Cook (Democratic) 51.0% David S. Dennison, Jr. (Republican) 49.0% |
| Ohio 12 | Samuel L. Devine | Republican | 1958 | Incumbent re-elected. | √ Samuel L. Devine (Republican) 60.7% Richard E. Liming (Democratic) 39.3% |
| Ohio 13 | A. David Baumhart, Jr. | Republican | 1954 | Incumbent retired. New member elected. Republican hold. |
√ Charles Adams Mosher (Republican) 51.4% J. William McCray (Democratic) 48.6% |
| Ohio 14 | William H. Ayres | Republican | 1950 | Incumbent re-elected. | √ William H. Ayres (Republican) 61.5% John H. Mihaly (Democratic) 38.5% |
| Ohio 15 | John E. Henderson | Republican | 1954 | Incumbent retired. New member elected. Republican hold. |
√ Tom Van Horn Moorehead (Republican) 51.2% Herbert U. Smith (Democratic) 48.8% |
| Ohio 16 | Frank T. Bow | Republican | 1950 | Incumbent re-elected. | √ Frank T. Bow (Republican) 62.5% John G. Freedom (Democratic) 37.5% |
| Ohio 17 | Robert W. Levering | Democratic | 1958 | Incumbent lost re-election. New member elected. Republican gain. |
√ John M. Ashbrook (Republican) 53.0% Robert W. Levering (Democratic) 47.0% |
| Ohio 18 | Wayne L. Hays | Democratic | 1948 | Incumbent re-elected. | √ Wayne L. Hays (Democratic) 65.6% Walter J. Hunston (Republican) 34.4% |
| Ohio 19 | Michael J. Kirwan | Democratic | 1936 | Incumbent re-elected. | √ Michael J. Kirwan (Democratic) 68.9% Paul E. Stevens (Republican) 31.1% |
| Ohio 20 | Michael A. Feighan | Democratic | 1942 | Incumbent re-elected. | √ Michael A. Feighan (Democratic) 67.8% Leonard G. Richter (Republican) 32.2% |
| Ohio 21 | Charles Vanik | Democratic | 1954 | Incumbent re-elected. | √ Charles Vanik (Democratic) 73.0% William O. Walker (Republican) 27.0% |
| Ohio 22 | Frances P. Bolton | Republican | 1940 | Incumbent re-elected. | √ Frances P. Bolton (Republican) 56.9% Chat Paterson (Democratic) 43.1% |
| Ohio 23 | William Edwin Minshall, Jr. | Republican | 1954 | Incumbent re-elected. | √ William Edwin Minshall, Jr. (Republican) 67.3% Daniel Winston (Democratic) 32.7% |
Oklahoma
| District | Incumbent | Results | Candidates | ||
|---|---|---|---|---|---|
| Senator | Party | First elected | |||
| Oklahoma 1 | Page Belcher | Republican | 1950 | Incumbent re-elected. | √ Page Belcher (Republican) 63.8% Yates Land (Democratic) 36.2% |
| Oklahoma 2 | Ed Edmondson | Democratic | 1952 | Incumbent re-elected. | √ Ed Edmondson (Democratic) 57.0% Bill Sharp (Republican) 43.0% |
| Oklahoma 3 | Carl Albert | Democratic | 1946 | Incumbent re-elected. | √ Carl Albert (Democratic) 74.9% George B. Sherritt (Republican) 25.1% |
| Oklahoma 4 | Tom Steed | Democratic | 1948 | Incumbent re-elected. | √ Tom Steed (Democratic) 60.7% Don H. Crall (Republican) 39.3% |
| Oklahoma 5 | John Jarman | Democratic | 1950 | Incumbent re-elected. | √ John Jarman (Democratic) 66.6% Hobart H. Hobbs (Republican) 33.4% |
| Oklahoma 6 | Toby Morris | Democratic | 1956 | Incumbent lost renomination. New member elected. Democratic hold. |
√ Victor Wickersham (Democratic) 50.0% Clyde Wheeler, Jr. (Republican) 50.0% |
Oregon
| District | Incumbent | Results | Candidates | ||
|---|---|---|---|---|---|
| Senator | Party | First elected | |||
| Oregon 1 | A. Walter Norblad | Republican | 1946 | Incumbent re-elected. | √ A. Walter Norblad (Republican) 65.1% Marv Owens (Democratic) 34.9% |
| Oregon 2 | Albert C. Ullman | Democratic | 1956 | Incumbent re-elected. | √ Albert C. Ullman (Democratic) 59.6% Ronald E. Phair (Republican) 40.4% |
| Oregon 3 | Edith Green | Democratic | 1954 | Incumbent re-elected. | √ Edith Green (Democratic) 63.9% Wallace L. Lee (Republican) 36.1% |
| Oregon 4 | Charles O. Porter | Democratic | 1956 | Incumbent lost re-election. New member elected. Republican gain. |
√ Edwin Russell Durno (Republican) 51.1% Charles O. Porter (Democratic) 48.9% |
Pennsylvania
| District | Incumbent | Results | Candidates | ||
|---|---|---|---|---|---|
| Senator | Party | First elected | |||
| Pennsylvania 1 | William A. Barrett | Democratic | 1944 | Incumbent re-elected. | √ William A. Barrett (Democratic) 77.0% Michael Grasso, Jr. (Republican) 23.0% |
| Pennsylvania 2 | Kathryn E. Granahan | Democratic | 1956 | Incumbent re-elected. | √ Kathryn E. Granahan (Democratic) 72.3% Joseph C. Bruno (Republican) 27.7% |
| Pennsylvania 3 | James A. Byrne | Democratic | 1952 | Incumbent re-elected. | √ James A. Byrne (Democratic) 69.7% Joseph P. Gorham (Republican) 30.3% |
| Pennsylvania 4 | Robert N.C. Nix, Sr. | Democratic | 1958 | Incumbent re-elected. | √ Robert N.C. Nix, Sr. (Democratic) 78.4% Clarence M. Smith (Republican) 22.6% |
| Pennsylvania 5 | William J. Green, Jr. | Democratic | 1944 | Incumbent re-elected. | √ William J. Green, Jr. (Democratic) 61.0% James W. Gilmour (Republican) 39.0% |
| Pennsylvania 6 | Herman Toll | Democratic | 1958 | Incumbent re-elected. | √ Herman Toll (Democratic) 59.6% David O. Maxwell (Republican) 40.4% |
| Pennsylvania 7 | William H. Milliken, Jr. | Republican | 1958 | Incumbent re-elected. | √ William H. Milliken, Jr. (Republican) 53.0% Henry Couley (Democratic) 47.0% |
| Pennsylvania 8 | Willard S. Curtin | Republican | 1956 | Incumbent re-elected. | √ Willard S. Curtin (Republican) 56.1% Donald V. Hock (Democratic) 43.9% |
| Pennsylvania 9 | Paul B. Dague | Republican | 1946 | Incumbent re-elected. | √ Paul B. Dague (Republican) 66.6% Howard W. Halsey (Democratic) 33.4% |
| Pennsylvania 10 | Stanley A. Prokop | Democratic | 1958 | Incumbent lost re-election. New member elected. Republican gain. |
√ William W. Scranton (Republican) 54.8% Stanley A. Prokop (Democratic) 45.2% |
| Pennsylvania 11 | Daniel J. Flood | Democratic | 1954 | Incumbent re-elected. | √ Daniel J. Flood (Democratic) 67.1% Donald B. Ayers (Republican) 32.9% |
| Pennsylvania 12 | Ivor D. Fenton | Republican | 1938 | Incumbent re-elected. | √ Ivor D. Fenton (Republican) 52.4% William H. Deitman (Democratic) 47.6% |
| Pennsylvania 13 | John A. Lafore, Jr. | Republican | 1956 | Incumbent lost renomination. New member elected. Republican hold. |
√ Richard S. Schweiker (Republican) 61.8% Warren M. Ballard (Democratic) 38.2% |
| Pennsylvania 14 | George M. Rhodes | Democratic | 1948 | Incumbent re-elected. | √ George M. Rhodes (Democratic) 53.8% James H. Mantis (Republican) 46.2% |
| Pennsylvania 15 | Francis E. Walter | Democratic | 1932 | Incumbent re-elected. | √ Francis E. Walter (Democratic) 55.2% Woodrow A. Horn (Republican) 44.8% |
| Pennsylvania 16 | Walter M. Mumma | Republican | 1950 | Incumbent re-elected. | √ Walter M. Mumma (Republican) 62.5% Miles Albright (Democratic) 37.5% |
| Pennsylvania 17 | Herman T. Schneebeli | Republican | April 26, 1960 (Special) |
Incumbent re-elected. | √ Herman T. Schneebeli (Republican) 56.7% Dean R. Fisher (Democratic) 43.3% |
| Pennsylvania 18 | Douglas Elliott | Republican | 1960 (Special) | Incumbent died June 19, 1960. New member elected. Republican hold. Winner was also elected to finish the term, see above. |
√ J. Irving Whalley (Republican) 62.3% D. Patrick Ahern (Democratic) 37.7% |
| Pennsylvania 19 | James M. Quigley | Democratic | 1958 | Incumbent lost re-election. New member elected. Republican gain. |
√ George A. Goodling (Republican) 53.2% James M. Quigley (Democratic) 46.8% |
| Pennsylvania 20 | James E. Van Zandt | Republican | 1946 | Incumbent re-elected. | √ James E. Van Zandt (Republican) 67.8% Robert N. Hendershot (Democratic) 32.2% |
| Pennsylvania 21 | John H. Dent | Democratic | 1958 | Incumbent re-elected. | √ John H. Dent (Democratic) 56.0% William L. Batten (Republican) 42.3% Angelo P. Vitello (Independent Anti-Tax) 1.7% |
| Pennsylvania 22 | John P. Saylor | Republican | 1948 | Incumbent re-elected. | √ John P. Saylor (Republican) 57.3% William D. Patton (Democratic) 42.7% |
| Pennsylvania 23 | Leon H. Gavin | Republican | 1942 | Incumbent re-elected. | √ Leon H. Gavin (Republican) 62.4% John H. Cartwright (Democratic) 36.8% Eugene Kern (Prohibition) 0.8% |
| Pennsylvania 24 | Carroll D. Kearns | Republican | 1946 | Incumbent re-elected. | √ Carroll D. Kearns (Republican) 51.0% Chester C. Hampton (Democratic) 49.0% |
| Pennsylvania 25 | Frank M. Clark | Democratic | 1954 | Incumbent re-elected. | √ Frank M. Clark (Democratic) 58.1% Fred A. Obley (Republican) 41.9% |
| Pennsylvania 26 | Thomas E. Morgan | Democratic | 1944 | Incumbent re-elected. | √ Thomas E. Morgan (Democratic) 63.6% Bartley P. Osborne (Republican) 36.4% |
| Pennsylvania 27 | James G. Fulton | Republican | 1944 | Incumbent re-elected. | √ James G. Fulton (Republican) 59.1% Margaret L. Walgren (Democratic) 40.9% |
| Pennsylvania 28 | William S. Moorhead | Democratic | 1958 | Incumbent re-elected. | √ William S. Moorhead (Democratic) 67.8% Arthur O. Sharron (Republican) 32.2% |
| Pennsylvania 29 | Robert J. Corbett | Republican | 1944 | Incumbent re-elected. | √ Robert J. Corbett (Republican) 59.2% Russell M. Douthett (Democratic) 40.8% |
| Pennsylvania 30 | Elmer J. Holland | Democratic | 1956 | Incumbent re-elected. | √ Elmer J. Holland (Democratic) 68.6% Jerome M. Meyers (Republican) 31.4% |
Rhode Island
| District | Incumbent | Results | Candidates | ||
|---|---|---|---|---|---|
| Senator | Party | First elected | |||
| Rhode Island 1 | Aime Forand | Democratic | 1940 | Incumbent retired. New member elected. Democratic hold. |
√ Fernand St. Germain (Democratic) 66.2% Theophile Martin (Republican) 33.8% |
| Rhode Island 2 | John E. Fogarty | Democratic | 1940 | Incumbent re-elected. | √ John E. Fogarty (Democratic) 70.4% Robert L. Gammell (Republican) 29.6% |
South Carolina
| District | Incumbent | Results | Candidates | ||
|---|---|---|---|---|---|
| Senator | Party | First elected | |||
| South Carolina 1 | L. Mendel Rivers | Democratic | 1940 | Incumbent re-elected. | √ L. Mendel Rivers (Democratic) Unopposed |
| South Carolina 2 | John J. Riley | Democratic | 1950 | Incumbent re-elected. | √ John J. Riley (Democratic) Unopposed |
| South Carolina 3 | William Jennings Bryan Dorn | Democratic | 1950 | Incumbent re-elected. | √ William Jennings Bryan Dorn (Democratic) Unopposed |
| South Carolina 4 | Robert T. Ashmore | Democratic | 1953 | Incumbent re-elected. | √ Robert T. Ashmore (Democratic) Unopposed |
| South Carolina 5 | Robert W. Hemphill | Democratic | 1956 | Incumbent re-elected. | √ Robert W. Hemphill (Democratic) Unopposed |
| South Carolina 6 | John L. McMillan | Democratic | 1938 | Incumbent re-elected. | √ John L. McMillan (Democratic) Unopposed |
South Dakota
| District | Incumbent | Results | Candidates | ||
|---|---|---|---|---|---|
| Senator | Party | First elected | |||
| South Dakota 1 | George McGovern | Democratic | 1956 | Retired to run for U.S. Senator. New member elected. Republican gain. |
√ Ben Reifel (Republican) 54.8% Ray Fitzgerald (Democratic) 45.2% |
| South Dakota 2 | Ellis Yarnal Berry | Republican | 1950 | Incumbent re-elected. | √ Ellis Yarnal Berry (Republican) 59.7% W. H. Raff (Democratic) 40.3% |
Tennessee
| District | Incumbent | Results | Candidates | ||
|---|---|---|---|---|---|
| Senator | Party | First elected | |||
| Tennessee 1 | B. Carroll Reece | Republican | 1950 | Incumbent re-elected. | √ B. Carroll Reece (Republican) 75.4% Arthur Bright (Democratic) 24.6% |
| Tennessee 2 | Howard Baker, Sr. | Republican | 1950 | Incumbent re-elected. | √ Howard Baker, Sr. (Republican) Unopposed |
| Tennessee 3 | James B. Frazier, Jr. | Democratic | 1948 | Incumbent re-elected. | √ James B. Frazier, Jr. (Democratic) Unopposed |
| Tennessee 4 | Joe L. Evins | Democratic | 1946 | Incumbent re-elected. | √ Joe L. Evins (Democratic) Unopposed |
| Tennessee 5 | Joseph Carlton Loser | Democratic | 1956 | Incumbent re-elected. | √ Joseph Carlton Loser (Democratic) Unopposed |
| Tennessee 6 | Ross Bass | Democratic | 1954 | Incumbent re-elected. | √ Ross Bass (Democratic) Unopposed |
| Tennessee 7 | Tom J. Murray | Democratic | 1942 | Incumbent re-elected. | √ Tom J. Murray (Democratic) Unopposed |
| Tennessee 8 | Fats Everett | Democratic | 1958 | Incumbent re-elected. | √ Fats Everett (Democratic) Unopposed |
| Tennessee 9 | Clifford Davis | Democratic | 1940 | Incumbent re-elected. | √ Clifford Davis (Democratic) Unopposed |
Texas
| District | Incumbent | Results | Candidates | ||
|---|---|---|---|---|---|
| Senator | Party | First elected | |||
| Texas 1 | Wright Patman | Democratic | 1928 | Incumbent re-elected. | √ Wright Patman (Democratic) Unopposed |
| Texas 2 | Jack Brooks | Democratic | 1952 | Incumbent re-elected. | √ Jack Brooks (Democratic) 69.7% Fred S. Naumann (Republican) 29.9% Robert E. Allen (Const) 0.4% |
| Texas 3 | Lindley Beckworth | Democratic | 1956 | Incumbent re-elected. | √ Lindley Beckworth (Democratic) Unopposed |
| Texas 4 | Sam Rayburn | Democratic | 1912 | Incumbent re-elected. | √ Sam Rayburn (Democratic) Unopposed |
| Texas 5 | Bruce R. Alger | Republican | 1954 | Incumbent re-elected. | √ Bruce R. Alger (Republican) 57.3% Joe Pool (Democratic) 42.7% |
| Texas 6 | Olin E. Teague | Democratic | 1946 | Incumbent re-elected. | √ Olin E. Teague (Democratic) Unopposed |
| Texas 7 | John Dowdy | Democratic | 1952 | Incumbent re-elected. | √ John Dowdy (Democratic) Unopposed |
| Texas 8 | Albert Richard Thomas | Democratic | 1936 | Incumbent re-elected. | √ Albert Richard Thomas (Democratic) 68.6% Anthony J. P. Farris (Republican) 21.9% Robert E. Nesmith (Const) 9.5% |
| Texas 9 | Clark W. Thompson | Democratic | 1947 | Incumbent re-elected. | √ Clark W. Thompson (Democratic) 94.0% Paul D. Rogers (Const) 6.0% |
| Texas 10 | Homer Thornberry | Democratic | 1948 | Incumbent re-elected. | √ Homer Thornberry (Democratic) 98.1% Roy R. Brown (Const) 1.9% |
| Texas 11 | William R. Poage | Democratic | 1936 | Incumbent re-elected. | √ William R. Poage (Democratic) Unopposed |
| Texas 12 | Jim Wright | Democratic | 1954 | Incumbent re-elected. | √ Jim Wright (Democratic) Unopposed |
| Texas 13 | Frank N. Ikard | Democratic | 1951 | Incumbent re-elected. | √ Frank N. Ikard (Democratic) Unopposed |
| Texas 14 | John Andrew Young | Democratic | 1956 | Incumbent re-elected. | √ John Andrew Young (Democratic) Unopposed |
| Texas 15 | Joe M. Kilgore | Democratic | 1954 | Incumbent re-elected. | √ Joe M. Kilgore (Democratic) Unopposed |
| Texas 16 | J. T. Rutherford | Democratic | 1954 | Incumbent re-elected. | √ J. T. Rutherford (Democratic) 58.9% Dorothy Wyvell (Const) 23.1% Ford Chapman (Republican) 18.0% |
| Texas 17 | Omar Burleson | Democratic | 1946 | Incumbent re-elected. | √ Omar Burleson (Democratic) 77.8% Max V. Mossholder (Republican) 22.2% |
| Texas 18 | Walter E. Rogers | Democratic | 1950 | Incumbent re-elected. | √ Walter E. Rogers (Democratic) Unopposed |
| Texas 19 | George H. Mahon | Democratic | 1934 | Incumbent re-elected. | √ George H. Mahon (Democratic) 85.7% John R. Anderson (Democratic) 14.3% |
| Texas 20 | Paul J. Kilday | Democratic | 1938 | Incumbent re-elected. | √ Paul J. Kilday (Democratic) Unopposed |
| Texas 21 | O. C. Fisher | Democratic | 1942 | Incumbent re-elected. | √ O. C. Fisher (Democratic) Unopposed |
| Texas 22 | Robert R. Casey | Democratic | 1958 | Incumbent re-elected. | √ Robert R. Casey (Democratic) 58.3% James Carter Noonan (Republican) 39.2% D. F. Vancleve (Const) 2.5% |
Utah
| District | Incumbent | Results | Candidates | ||
|---|---|---|---|---|---|
| Senator | Party | First elected | |||
| Utah 1 | Henry Aldous Dixon | Republican | 1954 | Incumbent retired. New member elected. Democratic gain. |
√ M. Blaine Peterson (Democratic) 50.0% A. Walter Stevenson (Republican) 50.0% |
| Utah 2 | David S. King | Democratic | 1958 | Incumbent re-elected. | √ David S. King (Democratic) 50.8% Sherman P. Lloyd (Republican) 49.2% |
Vermont
| District | Incumbent | Results | Candidates | ||
|---|---|---|---|---|---|
| Senator | Party | First elected | |||
| Vermont at-large | William H. Meyer | Democratic | 1958 | Incumbent lost re-election. New member elected. Republican gain. |
√ Robert Stafford (Republican) 57.2% William H. Meyer (Democratic) 42.8% |
Virginia
| District | Incumbent | Results | Candidates | ||
|---|---|---|---|---|---|
| Senator | Party | First elected | |||
| Virginia 1 | Thomas N. Downing | Democratic | 1958 | Incumbent re-elected. | √ Thomas N. Downing (Democratic) 82.5% Richard A. May (Republican) 17.5% |
| Virginia 2 | Porter Hardy, Jr. | Democratic | 1946 | Incumbent re-elected. | √ Porter Hardy, Jr. (Democratic) 75.9% Louis B. Fine (Republican) 24.1% |
| Virginia 3 | J. Vaughan Gary | Democratic | 1945 | Incumbent re-elected. | √ J. Vaughan Gary (Democratic) 78.0% T. Coleman Andrews (Write-in) 22.0% |
| Virginia 4 | Watkins Moorman Abbitt | Democratic | 1948 | Incumbent re-elected. | √ Watkins Moorman Abbitt (Democratic) Unopposed |
| Virginia 5 | William M. Tuck | Democratic | 1953 | Incumbent re-elected. | √ William M. Tuck (Democratic) Unopposed |
| Virginia 6 | Richard Harding Poff | Republican | 1952 | Incumbent re-elected. | √ Richard Harding Poff (Republican) 82.6% J. B. Brayman (Social-Democrat) 17.4% |
| Virginia 7 | Burr Harrison | Democratic | 1946 | Incumbent re-elected. | √ Burr Harrison (Democratic) Unopposed |
| Virginia 8 | Howard W. Smith | Democratic | 1930 | Incumbent re-elected. | √ Howard W. Smith (Democratic) 76.1% Lawrence M. Traylor (Republican) 23.9% |
| Virginia 9 | William Pat Jennings | Democratic | 1954 | Incumbent re-elected. | √ William Pat Jennings (Democratic) 58.0% E. Summers Sheffey (Republican) 42.0% |
| Virginia 10 | Joel T. Broyhill | Republican | 1952 | Incumbent re-elected. | √ Joel T. Broyhill (Republican) 55.0% Ralph Kaul (Democratic) 45.0% |
Washington
| District | Incumbent | Results | Candidates | ||
|---|---|---|---|---|---|
| Senator | Party | First elected | |||
| Washington 1 | Thomas Pelly | Republican | 1952 | Incumbent re-elected. | √ Thomas Pelly (Republican) 70.2% Carl V. Holman (Democratic) 29.8% |
| Washington 2 | Jack Westland | Republican | 1952 | Incumbent re-elected. | √ Jack Westland (Republican) 60.2% Payson Peterson (Democratic) 39.8% |
| Washington 3 | Russell V. Mack | Republican | 1947 | Incumbent died March 28, 1960. New member elected. Democratic gain. Winner was also elected to finish the term, see above. |
√ Julia Butler Hansen (Democratic) 53.4% Dale M. Nordquist (Republican) 46.6% |
| Washington 4 | Catherine Dean May | Republican | 1958 | Incumbent re-elected. | √ Catherine Dean May (Republican) 58.8% Roy Mundy (Democratic) 41.2% |
| Washington 5 | Walt Horan | Republican | 1942 | Incumbent re-elected. | √ Walt Horan (Republican) 59.4% Bernard J. Gallagher (Democratic) 40.6% |
| Washington 6 | Thor C. Tollefson | Republican | 1946 | Incumbent re-elected. | √ Thor C. Tollefson (Republican) 56.4% John G. McCutcheon (Democratic) 43.6% |
| Washington 7 | Donald H. Magnuson | Democratic | 1952 | Incumbent re-elected. | √ Donald H. Magnuson (Democratic) 50.0% John Stender (Republican) 50.0% |
West Virginia
| District | Incumbent | Results | Candidates | ||
|---|---|---|---|---|---|
| Senator | Party | First elected | |||
| West Virginia 1 | Arch A. Moore, Jr. | Republican | 1956 | Incumbent re-elected. | √ Arch A. Moore, Jr. (Republican) 60.3% Steven D. Narick (Democratic) 39.7% |
| West Virginia 2 | Harley O. Staggers | Democratic | 1948 | Incumbent re-elected. | √ Harley O. Staggers (Democratic) 60.3% Charles J. Whiston (Republican) 39.7% |
| West Virginia 3 | Cleveland M. Bailey | Democratic | 1948 | Incumbent re-elected. | √ Cleveland M. Bailey (Democratic) 59.8% James M. Knowles, Jr. (Republican) 40.2% |
| West Virginia 4 | Ken Hechler | Democratic | 1958 | Incumbent re-elected. | √ Ken Hechler (Democratic) 53.2% Clyde Pinson (Republican) 46.8% |
| West Virginia 5 | Elizabeth Kee | Democratic | 1951 | Incumbent re-elected. | √ Elizabeth Kee (Democratic) 69.5% L. M. LaFollette (Republican) 30.5% |
| West Virginia 6 | John M. Slack, Jr. | Democratic | 1958 | Incumbent re-elected. | √ John M. Slack, Jr. (Democratic) 61.8% George W. King (Republican) 38.2% |
Wisconsin
| District | Incumbent | Results | Candidates | ||
|---|---|---|---|---|---|
| Senator | Party | First elected | |||
| Wisconsin 1 | Gerald T. Flynn | Democratic | 1958 | Incumbent lost re-election. New member elected. Republican gain. |
√ Henry C. Schadeberg (Republican) 52.7% Gerald T. Flynn (Democratic) 47.3% |
| Wisconsin 2 | Robert W. Kastenmeier | Democratic | 1958 | Incumbent re-elected. | √ Robert W. Kastenmeier (Democratic) 53.4% Donald Edgar Tewes (Republican) 46.6% |
| Wisconsin 3 | Gardner R. Withrow | Republican | 1948 | Incumbent retired. New member elected. Republican hold. |
√ Vernon Wallace Thomson (Republican) 54.6% Norman M. Clapp (Democratic) 45.4% |
| Wisconsin 4 | Clement J. Zablocki | Democratic | 1948 | Incumbent re-elected. | √ Clement J. Zablocki (Democratic) 71.7% Samuel P. Murray (Republican) 28.3% |
| Wisconsin 5 | Henry S. Reuss | Democratic | 1954 | Incumbent re-elected. | √ Henry S. Reuss (Democratic) 57.7% Kirby Hendee (Republican) 42.3% |
| Wisconsin 6 | William Van Pelt | Republican | 1950 | Incumbent re-elected. | √ William Van Pelt (Republican) 55.8% James Megellas (Democratic) 44.2% |
| Wisconsin 7 | Melvin R. Laird | Republican | 1952 | Incumbent re-elected. | √ Melvin R. Laird (Republican) 67.1% Kenneth Traeger (Democratic) 32.9% |
| Wisconsin 8 | John W. Byrnes | Republican | 1944 | Incumbent re-elected. | √ John W. Byrnes (Republican) 58.8% Milo Singler (Democratic) 41.2% |
| Wisconsin 9 | Lester Johnson | Democratic | 1953 | Incumbent re-elected. | √ Lester Johnson (Democratic) 56.5% Perry M. Hull (Republican) 43.5% |
| Wisconsin 10 | Alvin E. O'Konski | Republican | 1942 | Incumbent re-elected. | √ Alvin E. O'Konski (Republican) 95.3% John B. Chapple (Write-in) 4.7% |
Wyoming
| District | Incumbent | Results | Candidates | ||
|---|---|---|---|---|---|
| Senator | Party | First elected | |||
| Wyoming at-large | Edwin Keith Thomson | Republican | 1954 | Retired to run for U.S. Senator. New member elected. Republican hold. |
√ William H. Harrison (Republican) 52.3% Hepburn T. Armstrong (Democratic) 47.7% |
See also
References
- 1 2 "PA - District 18 - History" – via OurCampaigns.com.
- ↑ "WA - District 03 - History" – via OurCampaigns.com.
| |
| Presidency (timeline) |
|
| Life | |
| Elections | |
| Legacy | |
| Family |
|
| |