Sunderland City Council election, 2007
|
| |||||||||||||||||||||||||||||||||||||||||||||||
| |||||||||||||||||||||||||||||||||||||||||||||||
One third of 75 seats on Sunderland City Council 38 seats needed for a majority | |||||||||||||||||||||||||||||||||||||||||||||||
|---|---|---|---|---|---|---|---|---|---|---|---|---|---|---|---|---|---|---|---|---|---|---|---|---|---|---|---|---|---|---|---|---|---|---|---|---|---|---|---|---|---|---|---|---|---|---|---|
| |||||||||||||||||||||||||||||||||||||||||||||||
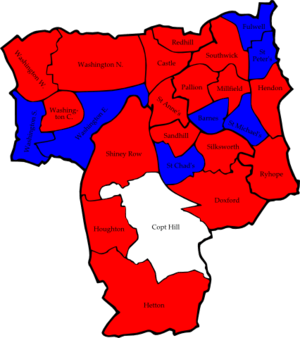 Map of the 2007 Sunderland City Council election results. Labour in red, Conservatives in blue, and Independents in white. | |||||||||||||||||||||||||||||||||||||||||||||||
| |||||||||||||||||||||||||||||||||||||||||||||||
The 2007 Sunderland Council election took place on 3 May 2007 to elect members of Sunderland Metropolitan Borough Council in Tyne and Wear, England. One third of the council was up for election and the Labour party stayed in overall control of the council.[1][2]
Background
Before the election the council had 57 Labour, 13 Conservative, 4 independent and 1 Liberal Democrat councillors. In the period since the previous local elections in May 2006, three councillors had left their parties to sit as Independents: Peter Maddison leaving the Liberal Democrat Group in July 2006, and Bryn Sidaway (Hendon) and George Blyth (Doxford) leaving the Labour Group in November 2006.[3][4] Blyth's ward colleague Mike Tansey had previously left the Labour Group to sit as an Independent in November 2005, and stood for re-election as an Independent candidate in this election.[5]
25 seats were contested in the 2007 elections with a total of 111 candidates standing.[6] These included a full 25 each from the Labour, Conservative and British National Party, as well as 16 independents, 15 Liberal Democrats, 2 Respect, 2 British First Party and 1 from the United Kingdom Independence Party.[6]
As at the 2006 election this election saw Sunderland have three polling stations open for 10 days before election day in an attempt to make voting more convenient for voters.[7]
Election results
The results had Labour stay in control of the council but with a smaller majority.[8] The Conservatives gained 3 seats from Labour in St Chads, Washington East and Washington South to hold 16 seats compared to 54 for Labour.[9] The 2 Conservative gains in Washington were the first time the party had won seats in the town since it became part of Sunderland council.[10] Labour also lost one seat to an independent in Copt Hill, but regained another in Doxford where the sitting independent councillor, Mike Tansey, had originally been elected for the Labour party.[8] This meant there remained 4 Independents on the council, as well as 1 Liberal Democrat who was not defending a seat in the election.[9] Overall turnout in the election was 34%, up on 32% at the 2006 election.[10]
| Party | Seats | Gains | Losses | Net gain/loss | Seats % | Votes % | Votes | +/− | |
|---|---|---|---|---|---|---|---|---|---|
| Labour | 17 | 0 | 4 | 68 | 43.3 | 31,148 | |||
| Conservative | 7 | 3 | 0 | 28 | 28.1 | 20,223 | |||
| Independent | 1 | 1 | 0 | 4 | 8.3 | 5,992 | |||
| BNP | 0 | 0 | 0 | 0 | 10.6 | 7,653 | |||
| Liberal Democrat | 0 | 0 | 0 | 0 | 8.7 | 6,293 | |||
| British First Party | 0 | 0 | 0 | 0 | 0.5 | 335 | |||
| Respect | 0 | 0 | 0 | 0 | 0.3 | 224 | |||
| UKIP | 0 | 0 | 0 | 0 | 0.1 | 72 | |||
This resulted in the following composition of the Council:
| Party | Previous Council | New Council | |
|---|---|---|---|
| Labour | 58 | 54 | |
| Conservatives | 13 | 16 | |
| Independent | 3 | 4 | |
| Liberal Democrats | 1 | 1 | |
| Total | 75 | 75 | |
| Working majority | 41 | 33 | |
Ward by ward results
Barnes ward
| Party | Candidate | Votes | % | ± | |
|---|---|---|---|---|---|
| Conservative | Lee Martin | 1,767 | 53.7 | +7.1 | |
| Labour | Helmut Izaks | 747 | 22.7 | -0.9 | |
| Liberal Democrat | Robert Boyce | 492 | 14.9 | -4.8 | |
| BNP | John McCaffrey | 287 | 8.7 | -1.4 | |
| Majority | 1,020 | 31.0 | +8.0 | ||
| Turnout | 3,293 | 37.7 | +0.4 | ||
| Conservative hold | Swing | ||||
Castle ward
| Party | Candidate | Votes | % | ± | |
|---|---|---|---|---|---|
| Labour | Denny Wilson | 1,675 | 66.0 | +16.3 | |
| BNP | Ian McDonald | 395 | 15.6 | -5.7 | |
| Independent | Ronald McQuillan | 276 | 10.9 | -7.7 | |
| Conservative | Martin Anderson | 191 | 7.5 | -3.0 | |
| Majority | 1,280 | 50.5 | +22.1 | ||
| Turnout | 2,537 | 30.0 | +1.6 | ||
| Labour hold | Swing | ||||
Copt Hill ward
| Party | Candidate | Votes | % | ± | |
|---|---|---|---|---|---|
| Independent | Colin Wakefield | 1,382 | 42.9 | +42.9 | |
| Labour | Juliana Heron | 1,146 | 35.6 | -15.1 | |
| Conservative | Richard Vardy | 358 | 11.1 | -22.1 | |
| BNP | Michael Webb | 176 | 5.5 | -10.7 | |
| Liberal Democrat | Margaret Gibbons | 159 | 4.9 | +4.9 | |
| Majority | 236 | 7.3 | |||
| Turnout | 3,221 | 36.0 | +6.2 | ||
| Independent gain from Labour | Swing | ||||
Doxford ward
| Party | Candidate | Votes | % | ± | |
|---|---|---|---|---|---|
| Labour | David Errington | 1,041 | 35.8 | -3.3 | |
| Independent | Mike Tansey† | 924 | 31.8 | +31.8 | |
| Conservative | Alistair Newton | 701 | 24.1 | -5.0 | |
| BNP | Lesley Dathan | 243 | 8.4 | -6.6 | |
| Majority | 117 | 4.0 | -6.0 | ||
| Turnout | 2,909 | 36.2 | +3.7 | ||
| Labour hold | Swing | ||||
†Mike Tansey had been elected in 2004 as a Labour candidate, but subsequently left the party to sit as an Independent councillor. The result was technically a hold for Labour although Tansey, the incumbent, lost his seat.
Fulwell ward
| Party | Candidate | Votes | % | ± | |
|---|---|---|---|---|---|
| Conservative | John Walton | 2,077 | 53.9 | +1.7 | |
| Labour | Bob Price | 968 | 25.1 | -0.4 | |
| Liberal Democrat | Geofrey Pryke | 507 | 13.1 | +1.1 | |
| BNP | Joseph Dobbie | 304 | 7.9 | -2.4 | |
| Majority | 1,109 | 28.8 | +2.2 | ||
| Turnout | 3,856 | 42.7 | +0.0 | ||
| Conservative hold | Swing | ||||
Hendon ward
| Party | Candidate | Votes | % | ± | |
|---|---|---|---|---|---|
| Labour | Thomas Martin | 1,045 | 43.0 | +1.1 | |
| Independent | Sammy Doran | 453 | 18.6 | +18.6 | |
| Conservative | Deborah Lorraine | 442 | 18.2 | -2.6 | |
| BNP | David Guynan | 362 | 14.9 | -6.2 | |
| Respect | Tafazzal Hussain | 129 | 5.3 | +5.3 | |
| Majority | 592 | 24.4 | +3.6 | ||
| Turnout | 2,431 | 30.2 | -1.2 | ||
| Labour hold | Swing | ||||
Hetton ward
| Party | Candidate | Votes | % | ± | |
|---|---|---|---|---|---|
| Labour | Florence Anderson | 1,506 | 55.3 | -1.5 | |
| Liberal Democrat | Philip Dowell | 489 | 17.9 | +17.9 | |
| BNP | John Richardson | 402 | 14.8 | -7.8 | |
| Conservative | George Brown | 328 | 12.0 | -8.6 | |
| Majority | 1,017 | 37.3 | +3.2 | ||
| Turnout | 2,725 | 31.3 | +3.9 | ||
| Labour hold | Swing | ||||
Houghton ward
| Party | Candidate | Votes | % | ± | |
|---|---|---|---|---|---|
| Labour | Kath Rolph | 1,496 | 50.7 | +0.1 | |
| Independent | John Finn | 544 | 18.4 | +18.4 | |
| Conservative | Douglas Middlemiss | 338 | 11.5 | -5.0 | |
| Liberal Democrat | Avril Snowball | 326 | 11.1 | -7.3 | |
| BNP | Peter Swain | 246 | 8.3 | -6.2 | |
| Majority | 952 | 32.3 | +0.0 | ||
| Turnout | 2,950 | 33.8 | +4.2 | ||
| Labour hold | Swing | ||||
Millfield ward
| Party | Candidate | Votes | % | ± | |
|---|---|---|---|---|---|
| Labour | Kevin O'Connor | 754 | 32.9 | +1.3 | |
| Liberal Democrat | Jim Major | 698 | 30.5 | -10.5 | |
| Conservative | Gwennyth Gibson | 306 | 13.4 | -1.6 | |
| BNP | Christopher Lathan | 198 | 8.7 | -3.7 | |
| Independent | Rachel Moore | 166 | 7.3 | +7.3 | |
| Respect | Keith Adshead | 95 | 4.2 | +4.2 | |
| UKIP | Pauline Featonby-Warren | 72 | 3.1 | +3.1 | |
| Majority | 56 | 2.4 | |||
| Turnout | 2,289 | 31.8 | +2.6 | ||
| Labour hold | Swing | ||||
Pallion ward
| Party | Candidate | Votes | % | ± | |
|---|---|---|---|---|---|
| Labour | Paul Watson | 1,061 | 44.7 | +1.2 | |
| Conservative | Michael Leadbitter | 445 | 18.7 | +0.5 | |
| Independent | Fred Dove | 314 | 13.2 | +13.2 | |
| BNP | James Davison | 279 | 11.7 | -7.2 | |
| Liberal Democrat | Ann Hollern | 277 | 11.7 | -7.7 | |
| Majority | 616 | 25.9 | +1.9 | ||
| Turnout | 2,376 | 30.5 | +0.8 | ||
| Labour hold | Swing | ||||
Redhill ward
| Party | Candidate | Votes | % | ± | |
|---|---|---|---|---|---|
| Labour | Richard Bell | 1,426 | 56.1 | +5.0 | |
| BNP | Ian Leadbitter | 585 | 23.0 | -3.8 | |
| Conservative | Paula Wilkinson | 275 | 10.8 | +0.4 | |
| Independent | Lesley Dixon | 176 | 6.9 | +6.9 | |
| British First Party | Julie Potter | 78 | 3.1 | +3.1 | |
| Majority | 841 | 33.1 | +8.7 | ||
| Turnout | 2,540 | 29.9 | +0.2 | ||
| Labour hold | Swing | ||||
Ryhope ward
| Party | Candidate | Votes | % | ± | |
|---|---|---|---|---|---|
| Labour | Ellen Ball | 1,194 | 41.3 | +0.1 | |
| Conservative | Christopher Fairs | 872 | 30.2 | +1.9 | |
| Independent | Patrick Lavelle | 443 | 15.3 | +15.3 | |
| BNP | Frederick Donkin | 383 | 13.2 | -2.7 | |
| Majority | 322 | 11.1 | -1.8 | ||
| Turnout | 2,892 | 36.1 | +3.5 | ||
| Labour hold | Swing | ||||
Sandhill ward
| Party | Candidate | Votes | % | ± | |
|---|---|---|---|---|---|
| Labour | David Forbes | 1,420 | 56.8 | +14.1 | |
| Conservative | Gordon Newton | 674 | 26.9 | +3.1 | |
| BNP | Joseph Dobbie | 408 | 16.3 | +0.9 | |
| Majority | 746 | 29.8 | +11.0 | ||
| Turnout | 2,502 | 30.4 | +1.4 | ||
| Labour hold | Swing | ||||
Shiney Row ward
| Party | Candidate | Votes | % | ± | |
|---|---|---|---|---|---|
| Labour | John Scott | 1,656 | 54.2 | +4.2 | |
| Conservative | Eddie Wake | 740 | 24.2 | +5.5 | |
| Independent | George Parkin | 353 | 11.5 | +11.5 | |
| BNP | Sharon Leadbitter | 309 | 10.1 | -2.7 | |
| Majority | 916 | 30.0 | -1.3 | ||
| Turnout | 3,058 | 31.7 | +1.2 | ||
| Labour hold | Swing | ||||
Silksworth ward
| Party | Candidate | Votes | % | ± | |
|---|---|---|---|---|---|
| Labour | Peter Gibson | 1,637 | 55.3 | +9.7 | |
| Conservative | Patricia Francis | 929 | 31.4 | +8.0 | |
| BNP | Anthony James | 395 | 13.3 | -1.4 | |
| Majority | 708 | 23.9 | +1.7 | ||
| Turnout | 2,961 | 35.6 | +0.7 | ||
| Labour hold | Swing | ||||
Southwick ward
| Party | Candidate | Votes | % | ± | |
|---|---|---|---|---|---|
| Labour | Christine Shattock | 1,193 | 44.8 | +2.7 | |
| Conservative | Terence Docherty | 541 | 20.3 | -1.0 | |
| BNP | Alan Brettwood | 463 | 17.4 | -3.7 | |
| Liberal Democrat | Anne Griffin | 278 | 10.4 | -5.1 | |
| Independent | Stephen Hanratty | 190 | 7.1 | +7.1 | |
| Majority | 652 | 24.5 | +3.6 | ||
| Turnout | 2,665 | 32.9 | +2.1 | ||
| Labour hold | Swing | ||||
St Anne's ward
| Party | Candidate | Votes | % | ± | |
|---|---|---|---|---|---|
| Labour | Sylvia Old | 1,172 | 50.4 | +4.9 | |
| Conservative | Marjorie Matthews | 399 | 17.2 | -3.3 | |
| BNP | Deborah Boyd | 260 | 11.2 | -5.7 | |
| British First Party | John Martin | 257 | 11.0 | +11.0 | |
| Liberal Democrat | Leslie Wascoe | 238 | 10.2 | -6.9 | |
| Majority | 773 | 33.2 | +8.2 | ||
| Turnout | 2,326 | 29.0 | +1.3 | ||
| Labour hold | Swing | ||||
St Chad's ward
| Party | Candidate | Votes | % | ± | |
|---|---|---|---|---|---|
| Conservative | Michael Dixon | 1,563 | 46.9 | -7.1 | |
| Labour | Stuart Porthouse | 1,348 | 40.4 | +8.9 | |
| BNP | Carol Dobbie | 248 | 7.4 | -0.3 | |
| Independent | Chain Gill | 175 | 5.2 | +5.2 | |
| Majority | 215 | 6.4 | -16.1 | ||
| Turnout | 3,334 | 42.6 | +1.6 | ||
| Conservative gain from Labour | Swing | ||||
St Michael's ward
| Party | Candidate | Votes | % | ± | |
|---|---|---|---|---|---|
| Conservative | Peter Wood | 1,928 | 59.4 | +6.3 | |
| Labour | Michael Mordey | 827 | 25.5 | +5.3 | |
| Independent | Martin Quinn | 293 | 9.0 | +9.0 | |
| BNP | Ian Sayers | 196 | 6.0 | -4.1 | |
| Majority | 1,101 | 33.9 | +1.0 | ||
| Turnout | 3,244 | 39.3 | +0.8 | ||
| Conservative hold | Swing | ||||
St Peter's ward
| Party | Candidate | Votes | % | ± | |
|---|---|---|---|---|---|
| Conservative | Graham Hall | 1,361 | 43.8 | +2.3 | |
| Labour | Linda Mitchell | 968 | 31.2 | +0.7 | |
| Liberal Democrat | Diana Matthew | 417 | 13.4 | -1.7 | |
| BNP | Derek Wright | 275 | 8.9 | -4.0 | |
| Independent | Robbie Menzies | 86 | 2.8 | +2.8 | |
| Majority | 393 | 12.6 | +1.6 | ||
| Turnout | 3,107 | 37.7 | -0.4 | ||
| Conservative hold | Swing | ||||
Washington Central ward
| Party | Candidate | Votes | % | ± | |
|---|---|---|---|---|---|
| Labour | Eric Timmins | 1,522 | 48.6 | +4.5 | |
| Conservative | Jackie Atkinson | 727 | 23.2 | +3.1 | |
| Liberal Democrat | David Snowball | 556 | 17.7 | -4.0 | |
| BNP | Clive Thompson | 329 | 10.5 | -3.6 | |
| Majority | 795 | 25.4 | +3.0 | ||
| Turnout | 3,134 | 35.7 | +3.3 | ||
| Labour hold | Swing | ||||
Washington East ward
| Party | Candidate | Votes | % | ± | |
|---|---|---|---|---|---|
| Conservative | Ian Cuthbert | 1,245 | 40.1 | +5.2 | |
| Labour | Bryan Williams | 1,220 | 39.3 | +1.0 | |
| Liberal Democrat | Malcolm Bannister | 441 | 14.2 | -2.7 | |
| BNP | David Laing | 195 | 6.3 | -3.6 | |
| Majority | 25 | 0.8 | |||
| Turnout | 3,101 | 35.9 | +2.7 | ||
| Conservative gain from Labour | Swing | ||||
Washington North ward
| Party | Candidate | Votes | % | ± | |
|---|---|---|---|---|---|
| Labour | Peter Walker | 1,567 | 58.0 | +3.2 | |
| Liberal Democrat | Paul Hillman | 441 | 16.3 | -2.3 | |
| Conservative | Kathleen Irvine | 441 | 16.3 | +1.9 | |
| BNP | Lynne Hudson | 254 | 9.4 | -2.8 | |
| Majority | 1,126 | 41.7 | +5.5 | ||
| Turnout | 2,703 | 31.3 | +3.2 | ||
| Labour hold | Swing | ||||
Washington South ward
| Party | Candidate | Votes | % | ± | |
|---|---|---|---|---|---|
| Conservative | Kathryn Chamberlin | 1,066 | 37.1 | +7.6 | |
| Labour | Louise Farthing | 1,019 | 35.4 | +4.5 | |
| Liberal Democrat | David Griffin | 444 | 15.4 | -12.9 | |
| BNP | William Ramshaw | 222 | 7.7 | -3.7 | |
| Independent | Walter Scott | 124 | 4.3 | +4.3 | |
| Majority | 47 | 1.6 | |||
| Turnout | 2,875 | 34.8 | +3.9 | ||
| Conservative gain from Labour | Swing | ||||
Washington West ward
| Party | Candidate | Votes | % | ± | |
|---|---|---|---|---|---|
| Labour | Harry Trueman | 1,540 | 52.9 | +1.5 | |
| Liberal Democrat | Irene Bannister | 530 | 18.2 | -3.2 | |
| Conservative | Olwyn Bird | 509 | 17.5 | +1.0 | |
| BNP | Jason Dent | 239 | 8.2 | -2.5 | |
| Independent | Ian Snowball | 93 | 3.2 | +3.2 | |
| Majority | 1,010 | 34.7 | +4.7 | ||
| Turnout | 2,911 | 33.1 | +2.6 | ||
| Labour hold | Swing | ||||
References
- ↑ "Sunderland". BBC News Online. Retrieved 2010-12-26.
- 1 2 "Results". The Times. 2007-05-05. p. 83.
- ↑ "Betrayal call as councillor leaves party". Retrieved 2018-07-02.
- ↑ "Labour could face legal action over cash from councillors scandal". Mail Online. Retrieved 2018-07-02.
- ↑ Administrator, journallive (2006-08-10). "Councillor `treated like a pariah'". journallive. Retrieved 2018-07-02.
- 1 2 "Get ready to cast your vote". Evening Chronicle. 2007-05-02. p. 6.
- ↑ "Going to the polls early". The Northern Echo. 2007-04-23. p. 12.
- 1 2 "Early results give a boost to blues". The Journal. 2007-05-04. p. 4.
- 1 2 Young, Peter (2007-05-04). "Winners and losers". Evening Chronicle. p. 6.
- 1 2 "Labour still in charge - but Tories celebrate too". Sunderland Echo. 2007-05-04. Retrieved 2010-12-29.
- 1 2 3 4 5 6 7 8 9 10 11 12 13 14 15 16 17 18 19 20 21 22 23 24 25 26 "Results of poll". Sunderland City Council. Retrieved 2010-12-26.
- 1 2 3 4 5 6 7 8 9 10 11 12 13 14 15 16 17 18 19 20 21 22 23 24 25 "Thursday night's election results". The Journal. 2007-05-04. Retrieved 2010-12-29.
| Preceded by Sunderland City Council election, 2006 |
Sunderland City Council elections | Succeeded by Sunderland City Council election, 2008 |
| Gateshead Metropolitan Borough Council | |
|---|---|
| Newcastle City Council | |
| North Tyneside Metropolitan Borough Council | |
| South Tyneside Metropolitan Borough Council | |
| Sunderland City Council | |
| Tyne and Wear County Council |
|
| |