Sunderland City Council election, 2012
|
| |||||||||||||||||||||||||||||||||||||||||||||||
| |||||||||||||||||||||||||||||||||||||||||||||||
One third of 75 seats on Sunderland City Council 38 seats needed for a majority | |||||||||||||||||||||||||||||||||||||||||||||||
|---|---|---|---|---|---|---|---|---|---|---|---|---|---|---|---|---|---|---|---|---|---|---|---|---|---|---|---|---|---|---|---|---|---|---|---|---|---|---|---|---|---|---|---|---|---|---|---|
| |||||||||||||||||||||||||||||||||||||||||||||||
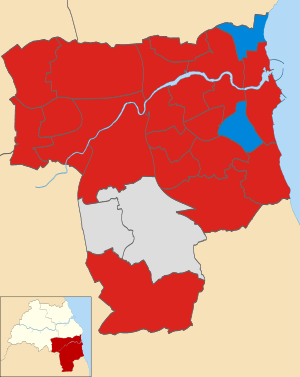 Map of the 2012 Sunderland City Council election results. Labour in red, Independents in grey and Conservatives in blue. | |||||||||||||||||||||||||||||||||||||||||||||||
| |||||||||||||||||||||||||||||||||||||||||||||||
The 2012 Sunderland Council election took place on 3 May 2012 to elect members of Sunderland City Council in England. It was held on the same day as other United Kingdom local elections, 2012.[1]
Election results
Following the election, the Labour Party remained in control of the council with its majority increased by eight. Labour took seats from the Conservatives in Washington East, Washington South, St Peter's, St Chad's, Ryhope, Doxford and Barnes. The Liberal Democrats also lost out to Labour in Millfield.
The Conservatives held two wards – Fulwell and St Michael's. Independents in Copt Hill and Houghton also held their seats.
| Party | Seats | Gains | Losses | Net gain/loss | Seats % | Votes % | Votes | +/− | |
|---|---|---|---|---|---|---|---|---|---|
| Labour | 22 | 8 | 0 | 88 | 61.3 | 43,485 | |||
| Conservative | 2 | 0 | 7 | 8 | 19.4 | 14,783 | |||
| Liberal Democrat | 0 | 0 | 1 | 0 | 5.6 | 3,958 | |||
| UKIP | 0 | 0 | 0 | 0 | 5 | 3,548 | |||
| Independent | 2 | 0 | 0 | 8 | 4.8 | 3,376 | |||
| Green | 0 | 0 | 0 | 0 | 2.3 | 1,620 | |||
| National Front | 0 | 0 | 0 | 0 | 0.2 | 122 | |||
This resulted in the following composition of the council:
| Party | Previous Council | New Council | |
|---|---|---|---|
| Labour | 56 | 64 | |
| Conservatives | 15 | 8 | |
| Independent | 3 | 3 | |
| Liberal Democrats | 1 | 0 | |
| Total | 75 | 75 | |
| Working majority | 37 | 53 | |
Ward by ward results
An asterisk denotes an incumbent.
Barnes ward
| Party | Candidate | Votes | % | ± | |
|---|---|---|---|---|---|
| Labour | Rebecca Atkinson | 2,041 | 55.5 | ||
| Conservative | Anthony Morrissey* | 1,486 | 40.4 | ||
| Liberal Democrat | Gouilnara Dixon | 150 | 4.1 | ||
| Majority | 555 | 15.1 | |||
| Turnout | 3,692 | 40.8 | |||
| Labour gain from Conservative | Swing | ||||
Castle ward
| Party | Candidate | Votes | % | ± | |
|---|---|---|---|---|---|
| Labour | Denny Wilson | 1,978 | 86.1 | ||
| Conservative | Paula Wilkinson | 215 | 9.4 | ||
| Liberal Democrat | Paul Hillman | 104 | 4.5 | ||
| Majority | 1,763 | 76.8 | |||
| Turnout | 2,319 | 26.7 | |||
| Labour hold | Swing | ||||
Copt Hill ward
| Party | Candidate | Votes | % | ± | |
|---|---|---|---|---|---|
| Independent | Derrick Smith* | 1,679 | 55.2 | ||
| Labour | Ann Owen | 1,250 | 41.1 | ||
| Liberal Democrat | Sue Sterling | 111 | 3.7 | ||
| Majority | 429 | 14.1 | |||
| Turnout | 3,052 | 33.6 | |||
| Independent hold | Swing | ||||
†Swing to the Independent candidate from the Conservatives, who had stood last time this seat was contested.
Doxford ward
| Party | Candidate | Votes | % | ± | |
|---|---|---|---|---|---|
| Labour | Christine Marshall | 1,863 | 67.1 | ||
| Conservative | Richard Vardy* | 590 | 21.3 | ||
| Green | Caroline Robinson | 246 | 8.9 | ||
| Liberal Democrat | Matt MacDonald | 76 | 2.7 | ||
| Majority | 1,273 | 45.9 | |||
| Turnout | 2,789 | 35.1 | |||
| Labour gain from Conservative | Swing | ||||
Fulwell ward
| Party | Candidate | Votes | % | ± | |
|---|---|---|---|---|---|
| Conservative | Bob Francis* | 1,758 | 48.1 | ||
| Labour | Margaret Beck | 1,657 | 45.4 | ||
| Liberal Democrat | Geoff Pryke | 238 | 6.5 | ||
| Majority | 101 | 2.8 | |||
| Turnout | 3,670 | 40 | |||
| Conservative hold | Swing | ||||
Hendon ward
| Party | Candidate | Votes | % | ± | |
|---|---|---|---|---|---|
| Labour Co-op | Michael Mordey* | 1,518 | 66.6 | ||
| Conservative | Debbie Lorraine | 360 | 15.8 | ||
| UKIP | Pauline Featonby-Warren | 244 | 10.7 | ||
| Green | Samuel May | 159 | 7 | ||
| Majority | 1,158 | 50.8 | |||
| Turnout | 2,297 | 25.6 | |||
| Labour Co-op hold | Swing | ||||
Hetton ward
| Party | Candidate | Votes | % | ± | |
|---|---|---|---|---|---|
| Labour | James Blackburn* | 1,628 | 51.8 | ||
| UKIP | John Defty | 1,363 | 43.3 | ||
| Liberal Democrat | Philip Dowell | 154 | 4.9 | ||
| Majority | 265 | 8.4 | |||
| Turnout | 3,166 | 35.1 | |||
| Labour hold | Swing | ||||
Houghton ward
| Party | Candidate | Votes | % | ± | |
|---|---|---|---|---|---|
| Independent | Sheila Ellis* | 1,697 | 51.9 | ||
| Labour | Gemma Taylor | 1,496 | 45.8 | ||
| Liberal Democrat | Louise Smith | 74 | 2.3 | ||
| Majority | 201 | 6.2 | |||
| Turnout | 3,278 | 35.8 | |||
| Independent hold | Swing | ||||
†Swing to the Independent candidate from the Conservatives, who had stood last time this seat was contested.
Millfield ward
| Party | Candidate | Votes | % | ± | |
|---|---|---|---|---|---|
| Labour Co-op | Bob Price | 1,058 | 45.5 | ||
| Liberal Democrat | Paul Dixon* | 888 | 38.2 | ||
| Conservative | Keith O'Brien | 164 | 7.1 | ||
| National Front | Paul Birleson | 122 | 5.3 | ||
| Green | Helmut Izaks | 94 | 4 | ||
| Majority | 170 | 7.3 | |||
| Turnout | 2,339 | 28.8 | |||
| Labour Co-op gain from Liberal Democrat | Swing | ||||
Pallion ward
| Party | Candidate | Votes | % | ± | |
|---|---|---|---|---|---|
| Labour | Amy Wilson* | 1,541 | 66.7 | ||
| Conservative | Peter O'Connor | 365 | 15.8 | ||
| Green | David Campbell | 304 | 13.2 | ||
| Liberal Democrat | Sylvia Doward | 101 | 4.4 | ||
| Majority | 1,176 | 50.9 | |||
| Turnout | 2,321 | 30.4 | |||
| Labour hold | Swing | ||||
Redhill ward
| Party | Candidate | Votes | % | ± | |
|---|---|---|---|---|---|
| Labour | Ronny Davison | 1,887 | 78.6 | ||
| UKIP | Lynn Kelly | 388 | 16.2 | ||
| Conservative | Gwennyth Gibson | 125 | 5.2 | ||
| Majority | 1,499 | 62.46 | |||
| Turnout | 2,415 | 28 | |||
| Labour hold | Swing | ||||
†Swing to Labour from the BNP, who had stood last time this seat was contested.
Ryhope ward
| Party | Candidate | Votes | % | ± | |
|---|---|---|---|---|---|
| Labour Co-op | Anthony Farr | 1,887 | 72.8 | ||
| Conservative | Shaun Cudworth | 706 | 27.2 | ||
| Majority | 1,181 | 45.6 | |||
| Turnout | 2,620 | 31.9 | |||
| Labour Co-op gain from Conservative | Swing | ||||
St Anne's ward
| Party | Candidate | Votes | % | ± | |
|---|---|---|---|---|---|
| Labour | Susan Watson* | 1,743 | 72.1 | ||
| Conservative | Norman Oliver | 339 | 14 | ||
| Green | Emily Blyth | 268 | 11.1 | ||
| Liberal Democrat | Kathy Walker | 69 | 2.9 | ||
| Majority | 1,404 | 58 | |||
| Turnout | 2,426 | 28 | |||
| Labour hold | Swing | ||||
St Chad's ward
| Party | Candidate | Votes | % | ± | |
|---|---|---|---|---|---|
| Labour | Darryl Dixon | 1,755 | 55.3 | ||
| Conservative | Alan Wright* | 1,312 | 41.4 | ||
| Liberal Democrat | Sue Wilson | 105 | 3.3 | ||
| Majority | 443 | 14 | |||
| Turnout | 3,188 | 40 | |||
| Labour gain from Conservative | Swing | ||||
St Michael's ward
| Party | Candidate | Votes | % | ± | |
|---|---|---|---|---|---|
| Conservative | Margaret Forbes* | 1,649 | 51.3 | ||
| Labour | Chris Johnson | 1,161 | 36.1 | ||
| Green | Rachel Featherstone | 265 | 8.2 | ||
| Liberal Democrat | Andrew Wood | 140 | 4.4 | ||
| Majority | 488 | 15.2 | |||
| Turnout | 3,242 | 35.4 | |||
| Conservative hold | Swing | ||||
St Peter's ward
| Party | Candidate | Votes | % | ± | |
|---|---|---|---|---|---|
| Labour | Julia Jackson | 1,595 | 52.5 | ||
| Conservative | Graham Hall | 1,221 | 40.2 | ||
| Liberal Democrat | Chris Henry | 224 | 7.4 | ||
| Majority | 374 | 12.3 | |||
| Turnout | 3,065 | 35.2 | |||
| Labour gain from Conservative | Swing | ||||
Sandhill ward
| Party | Candidate | Votes | % | ± | |
|---|---|---|---|---|---|
| Labour | Debra Waller | 1,830 | 90.4 | ||
| Labour | Mary Turton | 1,424 | 70.4 | ||
| Conservative | Paul Tweddle | 459 | 22.7 | ||
| Liberal Democrat | Anthony Usher | 335 | 16.6 | ||
| Majority | 965 | 47.7 | |||
| Turnout | 2,035 | 23.8 | |||
| Labour hold | Swing | ||||
| Labour hold | Swing | ||||
There was a double vacancy in Sandhill ward in 2012, due to the retirement of Labour councillor Jim Scott, and the death of Labour councillor John Gallagher.[3] Two seats were up for election, and each voter could cast two votes.
Shiney Row ward
| Party | Candidate | Votes | % | ± | |
|---|---|---|---|---|---|
| Labour | Anne Hall* | 2,286 | 73.6 | ||
| Conservative | Malcolm Vardy | 635 | 20.4 | ||
| Liberal Democrat | Carol Attewell | 187 | 6 | ||
| Majority | 1,651 | 53.1 | |||
| Turnout | 3,129 | 30.8 | |||
| Labour hold | Swing | ||||
Silksworth ward
| Party | Candidate | Votes | % | ± | |
|---|---|---|---|---|---|
| Labour | Patricia Smith* | 1,960 | 67.2 | ||
| Conservative | Dominic McDonough | 451 | 15.5 | ||
| UKIP | Derek Horsley | 376 | 12.9 | ||
| Green | Joella Lynch | 128 | 4.4 | ||
| Majority | 1,509 | 51.8 | |||
| Turnout | 2,919 | 34.3 | |||
| Labour hold | Swing | ||||
Southwick ward
| Party | Candidate | Votes | % | ± | |
|---|---|---|---|---|---|
| Labour | Rosalind Copeland* | 1,582 | 66.4 | ||
| Conservative | Terence Docherty | 394 | 16.5 | ||
| UKIP | Michael Leadbitter | 325 | 13.6 | ||
| Liberal Democrat | Ann Hollern | 81 | 3.4 | ||
| Majority | 1,188 | 49.9 | |||
| Turnout | 2,394 | 28.6 | |||
| Labour hold | Swing | ||||
Washington Central ward
| Party | Candidate | Votes | % | ± | |
|---|---|---|---|---|---|
| Labour Co-op | Dianne Snowdon* | 1,999 | 65.7 | ||
| UKIP | Erland Polden | 536 | 17.6 | ||
| Conservative | Pat Francis | 327 | 10.8 | ||
| Liberal Democrat | Chris Ashford | 179 | 5.9 | ||
| Majority | 1,463 | 48.1 | |||
| Turnout | 3,058 | 33.9 | |||
| Labour Co-op hold | Swing | ||||
Washington East ward
| Party | Candidate | Votes | % | ± | |
|---|---|---|---|---|---|
| Labour | David Snowdon | 1,721 | 56.5 | ||
| Conservative | Hilary Johnson | 735 | 24.1 | ||
| UKIP | Linda Hudson | 316 | 10.4 | ||
| Green | Tony Murphy | 156 | 5.1 | ||
| Liberal Democrat | Malcolm Bannister | 119 | 3.9 | ||
| Majority | 986 | 32.4 | |||
| Turnout | 3,055 | 34.6 | |||
| Labour gain from Conservative | Swing | ||||
Washington North ward
| Party | Candidate | Votes | % | ± | |
|---|---|---|---|---|---|
| Labour | John Kelly* | 2,047 | 80.1 | ||
| Conservative | Kathleen Irvine | 349 | 13.7 | ||
| Liberal Democrat | Kevin Morris | 160 | 6.3 | ||
| Majority | 1,698 | 66.4 | |||
| Turnout | 2,577 | 29 | |||
| Labour hold | Swing | ||||
Washington South ward
| Party | Candidate | Votes | % | ± | |
|---|---|---|---|---|---|
| Labour | Louise Farthing | 1,802 | 65.1 | ||
| Conservative | Martin Talbot | 757 | 27.4 | ||
| Liberal Democrat | David Griffin | 209 | 7.6 | ||
| Majority | 1,045 | 37.8 | |||
| Turnout | 2,797 | 33.9 | |||
| Labour gain from Conservative | Swing | ||||
Washington West ward
| Party | Candidate | Votes | % | ± | |
|---|---|---|---|---|---|
| Labour | Bernard Scaplehorn* | 2,200 | 77.5 | ||
| Conservative | Olwyn Bird | 386 | 13.6 | ||
| Liberal Democrat | Irene Bannister | 254 | 8.9 | ||
| Majority | 1,814 | 63.9 | |||
| Turnout | 2,869 | 31.5 | |||
| Labour hold | Swing | ||||
References
- ↑ "Local elections 2012". BBC News. Retrieved 2012-04-30.
- ↑ 2012 Results
- ↑ "Tributes paid to "gentleman" Sunderland councillor who died of lung cancer". Sunderland Echo. Retrieved 2018-07-01.
| Preceded by Sunderland City Council election, 2011 |
Sunderland City Council elections | Succeeded by Sunderland City Council election, 2014 |
| Gateshead Metropolitan Borough Council | |
|---|---|
| Newcastle City Council | |
| North Tyneside Metropolitan Borough Council | |
| South Tyneside Metropolitan Borough Council | |
| Sunderland City Council | |
| Tyne and Wear County Council |
|
| |