Solar energy in the European Union
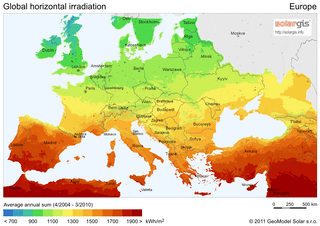
Solar energy in the European Union consists of photovoltaics (PV) and solar thermal energy.
In 2010, the €2.6 billion European solar heating sector consisted of small and medium-sized businesses, generated 17.3 terawatt-hours (TWh) of energy, employed 33,500 workers, and created one new job for every 80 kW of added capacity.[1]
During 2011, an additional 21.9 gigawatts (GW) of photovoltaics systems were connected to the grid in the European Union, a steep increase from 13.4 GW in 2010.[2] Turnover of the European PV market amounted to approximately €36 billion for this period.[3]
Photovoltaic solar power
In 2012, photovoltaic systems with a total capacity of 17.2 gigawatt (GW) were connected to the grid in Europe, less than in 2011, when 22.4 GW had been installed. In terms of total installed capacity, according to EPIA's 2012-report, Europe still led the way with more than 70 GW, or 69% of worldwide capacity, producing 85 TWh of electricity annually. This energy volume is sufficient to power the supply needs of over 20 million households.[2]
In 2011, solar photovoltaic continued its growth trend and Italy was the top market for the year, with 9.3 GW connected, followed by Germany (7.5 GW). These two markets were followed by France (1.7 GW) and the United Kingdom (784 MW). In terms of cumulative capacity, Germany with more than 24 GW, is the leading country in Europe,[2] followed by Italy, with more than 12 GW. PV is now a significant part of Europe's electricity mix, producing 2% of the demand in the EU and roughly 4% of peak demand.[2]
In 2011 the EU’s solar electricity production is evaluated as ca 44.8 TWh in 2011 with 51.4 GW installed capacity, up 98% on 2010. In 2011 in the EU new installations were 21.5 GW. The solar power share in 2011 was around 3.6% in Italy, 3.1% in Germany and 2.6% in Spain. EuroObserver expects the total installation to reach at least 120 GW in 2020. The national strategies are equivalent to 84 GW solar capacity in 2020 which may underestimate the actual development taking place. For example, according to AGEE-Stat (the Ministry of Environment’s Working Group on Renewable Energy Statistics), Germany connected solar capacity 7.5 GWp in 2011, twice the 3.5 GWp target. EU accounted for 74% of all newly connected capacity in 2011. According to Photon International magazine the worldwide solar cell production capacity was 12.5 GW in 2009 and 37 GW in 2011. In 2012, production capacities are set to rise to 69 GW, same as the total installed capacity worldwide at the end of 2011.[4]
Denmark reached its governmental goal of achieving 200 MW of photovoltaic capacity by 2020 already in 2012, eight years in advance. Danish energy sector players estimate that this development will result in 1000 MW by 2020.[5] Croatian as the newest member of the EU has a less than enthusiastic embrace of solar power due to a number of reasons. However, in past few years, Croatian solar energy has seen a dramatic increase in the overall output. From 32.4 MWh in 2012, to an additional 46,2 MWh in 2013 with another 108 MWh[6] awaiting to be connected to the national grid and additional power plants under construction with total energy output exceeding 200 MWh. Croatian national renewable energy strategy is to increase participating share of renewable in overall energy mix from current 15.8% (end of 2012) to around 25% by 2020 with solar generating at least 500 MWh.
| PV in the European Union (MWpeak)[7][8][9][10][10][11][12][13][14][15] | |||||||||||||
|---|---|---|---|---|---|---|---|---|---|---|---|---|---|
| # | Country | 2005 | 2006 | 2007 | 2008 | 2009 | 2010 | 2011 | 2012 | 2013 | 2014 | 2015 | 2016 |
| 1 | 1,910 | 3,063 | 3,846 | 6,019 | 9,959 | 17,370 | 24,875 | 32,698 | 36,402 | 38,408 | 39,763 | 41,340 | |
| 2 | 46 | 58 | 120 | 458 | 1,157 | 3,478 | 12,764 | 16,361 | 18,065 | 18,622 | 18,924 | 19,274 | |
| 3 | 11 | 14 | 19 | 23 | 30 | 75 | 1,014 | 1,657 | 2,782 | 5,380 | 8,918 | 11,562 | |
| 4 | 26 | 33 | 47 | 104 | 335 | 1,054 | 2,831 | 4,027 | 4,625 | 5,699 | 6,578 | 7,165 | |
| 5 | 58 | 118 | 733 | 3,421 | 3,438 | 3,808 | 4,214 | 4,516 | 4,766 | 4,872 | 4,774 | 4,801 | |
| 6 | 2 | 4 | 22 | 71 | 574 | 787 | 1,812 | 2,649 | 3,040 | 3,140 | 3,228 | 3,425 | |
| 7 | 5 | 7 | 9 | 19 | 55 | 205 | 631 | 1,543 | 2,585 | 2,603 | 2,613 | 2,604 | |
| 8 | 0 | 1 | 4 | 55 | 463 | 1,953 | 1,959 | 2,022 | 2,064 | 2,067 | 2,083 | 2,047 | |
| 9 | 51 | 51 | 53 | 57 | 68 | 97 | 118 | 321 | 739 | 1,048 | 1,405 | 2,040 | |
| 10 | 0 | 0.2 | 0.3 | 0.5 | 0.6 | 2 | 2.9 | 49 | 1,022 | 1,293 | 1,325 | 1,371 | |
| 11 | 24 | 29 | 27 | 32 | 53 | 103 | 173 | 421 | 631 | 785.2 | 935.3 | 1,077 | |
| 12 | 0 | 0 | 0.8 | 1 | 6 | 17 | 132 | 933 | 1,019 | 1,020 | 1,021 | 1,032 | |
| 13 | 3 | 3 | 3 | 3 | 5 | 7 | 16 | 391 | 572 | 602 | 782.5 | 858.3 | |
| 14 | 0 | 0 | 0 | <0.1 | 0.2 | 144 | 488 | 517 | 588 | 590 | 591.1 | 545.1 | |
| 15 | 3 | 4 | 18 | 68 | 102 | 131 | 143 | 228 | 303 | 423.0 | 460.0 | 470.0 | |
| 16 | 0.2 | 0.4 | 1 | 2 | 9 | 36 | 90 | 217 | 248 | 256 | 257.4 | 259.1 | |
| 17 | 0.2 | 0.2 | 0.4 | 0.5 | 0.7 | 2 | 4.1 | 3.7 | 35 | 77.7 | 137.7 | 288.0 | |
| 18 | 0.3 | 0.4 | 0.6 | 1 | 1 | 2 | 1.8 | 3.4 | 4.2 | 29.9 | 86.9 | 195.7 | |
| 19 | 4 | 5 | 6 | 8 | 9 | 10 | 18 | 23 | 43 | 79 | 130.0 | 153.5 | |
| 20 | 24 | 24 | 24 | 25 | 26 | 27 | 30 | 76 | 95 | 110 | 125.0 | 122.6 | |
| 21 | 0.1 | 0.1 | 0.1 | 0.2 | 2 | 2 | 11 | 18 | 28 | 54 | 73.2 | 82.0 | |
| 22 | 0 | 0 | 0 | <0.1 | <0.1 | 0.1 | 0.1 | 6.1 | 68 | 68 | 73.1 | 80.1 | |
| 23 | 0.5 | 1 | 1 | 2 | 3 | 6 | 10 | 17 | 35 | 65 | 69.5 | 54.9 | |
| 24 | 0.5 | 1.2 | 3.2 | 5.6 | 12 | 16 | 16 | 20 | 20 | 34.2 | 44.8 | 52.3[16] | |
| 25 | 4 | 4 | 5 | 6 | 8 | 10 | 11 | 11 | 11 | 11.2 | 14.7 | 20.0 | |
| 26 | 0 | 0 | 0 | <0.1 | <0.1 | <0.1 | 0.2 | 0.2 | 0.2 | 0.2 | 4.1 | 10.1 | |
| 27 | 0.3 | 0.3 | 0.4 | 0.4 | 0.6 | 0.6 | 0.7 | 0.7 | 1 | 1.1 | 2.1 | 5.1 | |
| 28 | 0 | 0 | 0 | <0.1 | <0.1 | <0.1 | 1.5 | 1.5 | 1.5 | 1.5 | 1.5 | 1.5 | |
| 2.17 | 3.42 | 4.94 | 10.38 | 15.86 | 29.33 | 51.36 | 68.64 | 79.79 | 87.34 | 94.57 | 100.94 | ||
| PV in watts per capita [11][12][13][14][15] | |||||||
|---|---|---|---|---|---|---|---|
| # | Country | 2011 | 2012 | 2013 | 2014 | 2015 | 2016 |
| 1 | 304.3 | 399.5 | 447.2 | 474.1 | 489.8 | 503.1 | |
| 2 | 210.5 | 269.0 | 295.1 | 303.5 | 311.3 | 317.7 | |
| 3 | 165.5 | 240.0 | 267.3 | 277.2 | 286.7 | 302.8 | |
| 4 | 55.8 | 136.7 | 233.7 | 236.8 | 241.7 | 241.4 | |
| 5 | 59.9 | 89.9 | 186.2 | 200.1 | 222.0 | 212.8 | |
| 6 | 186.0 | 192.5 | 196.1 | 196.1 | 197.7 | 194.0 | |
| 7 | 27.4 | 45.0 | 58.7 | 127.5 | 170.5 | 188.8 | |
| 8 | 16.2 | 26.3 | 42.9 | 81.3 | 137.7 | 176.8 | |
| 9 | 3.0 | 70.2 | 94.8 | 106.9 | 138.3 | 150.4 | |
| 10 | 17.7 | 127.4 | 139.9 | 140.8 | 141.7 | 144.3 | |
| 11 | 44.1 | 105.7 | 123.8 | 124.2 | 124.8 | 125.5 | |
| 12 | 20.7 | 49.9 | 81.7 | 90.6 | 108.9 | 123.9 | |
| 13 | 7.1 | 19.1 | 39.6 | 65.4 | 83.1 | 120.1 | |
| 14 | 43.5 | 61.6 | 71.6 | 87.6 | 99.1 | 107.3 | |
| 15 | 91.3 | 97.8 | 100.7 | 102.9 | 106.0 | 103.4 | |
| 16 | 89.8 | 95.7 | 99.3 | 109.0 | 109.0 | 100.5 | |
| 17 | 0.1 | 0.3 | 51.1 | 64.8 | 66.7 | 69.4 | |
| 18 | 12.5 | 19.9 | 40.2 | 75.5 | 82.0 | 64.7 | |
| 19 | 13.5 | 21.7 | 26.8 | 40.2 | 44.3 | 45.4 | |
| 20 | 0.4 | 0.4 | 1.6 | 3.9 | 14.0 | 29.3 | |
| 21 | 0.0 | 2.0 | 22.9 | 23.2 | 25.0 | 27.7 | |
| 22 | 2.0 | 2.5 | 4.5 | 8.2 | 13.3 | 15.6 | |
| 23 | 0.1 | 0.1 | 5.1 | 8.1 | 10.6 | 12.0 | |
| 24 | 0.1 | 0.1 | 0.1 | 0.1 | 3.1 | 7.7 | |
| 25 | 0.0 | 0.1 | 0.1 | 0.6 | 2.03 | 5.2 | |
| 26 | 2.1 | 2.1 | 2.1 | 1.9 | 2.7 | 3.6 | |
| 27 | 0.2 | 0.2 | 0.2 | 0.2 | 0.5 | 1.1 | |
| 28 | 0.7 | 0.7 | 0.7 | 0.8 | 0.8 | 0.8 | |
| – | 102.2 | 136.3 | 155.8 | 171.5 | 186.1 | 197.8 | |
Concentrated solar power
Solar power, the production of electricity from solar energy, is performed either directly, through photovoltaics, or indirectly, using concentrated solar power (CSP). One advantage that CSP has is the ability to add thermal storage and provide power up to 24 hours a day.[17] Gemasolar, in Spain, was the first to provide 24-hour power.[18] There is considerable academic and commercial interest internationally in a new form of CSP, called STEM, for off-grid applications to produce 24-hour industrial scale power for mining sites and remote communities in Italy, other parts of Europe, Australia, Asia, North Africa and Latin America. STEM uses fluidized silica sand as a thermal storage and heat transfer medium for CSP systems. It has been developed by Salerno-based Magaldi Industries. The first commercial application of STEM will take place in Sicily from 2015.[19]
| CSP in Europe (MWpeak)[20][21] | ||||||||
|---|---|---|---|---|---|---|---|---|
| # | Country | 2007 | 2008 | 2009 | 2010 | 2011 | 2012 | 2013 |
| 1 | 10.00 | 60.00 | 281.40 | 531.40 | 1,151.40 | 1,953.90 | 2,303.90 | |
| 2 | 0 | 0 | 0 | 5.00 | 5.00 | 5.00 | 5.35 | |
| 3 | 0 | 0 | 0 | 1.50 | 1.50 | 1.50 | 1.50 | |
| 4 | 0 | 0 | 0 | 0.50 | 0.75 | 0.75 | 0.75 | |
| 10 | 60 | 281 | 738 | 1,159 | 1,961 | 2,311 | ||
Solar thermal
Over the next 10 years the European solar thermal will grow on average at a rate of 15% per annum. According to the National Renewable Energy Action Plans the total solar thermal capacity in the EU will be 102 GW in 2020 (while 14 GW in 2006).[1]
In June 2009, the European Parliament and Council adopted the Directive on the promotion of the use of energy from Renewable Energy Sources (RES). For the first time, heating and cooling accounting for half of the final energy demand will be covered by a European directive promoting renewable energies. The overall renewable target is legally binding but renewable mix is free. According to the delivered national plans the highest of solar heating markets during 2010-2020 will be in Italy, Germany, France, Spain and Poland in respect to the national target in 2020 and capacity increase. Top countries per capita will be Cyprus, Greece, Austria, Italy and Belgium.[1]
In some European countries the solar thermal market is still in its infancy. Bulgaria, Denmark, Netherlands, Sweden, and United Kingdom have extremely low targets in their plans. Estonia, Finland, Latvia, and Romania have not included solar thermal in their national plans at all.[1]
Solar heating is the usage of solar energy to provide space or water heating. Worldwide the use was 88 GWthermal in 2005. Growth potential is enormous. The EU have been second after China in the installations. If all EU countries had used solar thermal as enthusiastically as the Austrians, the EU’s installed capacity would have been 91 GWth (130 million m2), far beyond the target of 100 million m2 by 2010, set by the White Paper in 1997. In 2005 solar heating in the EU was equivalent to more than 686,000 tons of oil. ESTIF’s minimum target is to produce solar heating equivalent to 5,600,000 tons of oil (2020). A more ambitious, but feasible, target is 73 million tons of oil per year (2020) – a lorry row spanning 1,5 times around the globe.[22]
| Solar heating in the European Union (MWthermal) | ||||||||||
|---|---|---|---|---|---|---|---|---|---|---|
| # | Country | 2008 | 2009 | 2010 | 2011 | 2012 | 2013 | |||
| 1 | 7,766 | 9,036 | 9,831 | 10,496 | 11,416 | 12,055 | ||||
| 2 | 2,268 | 3,031 | 3,227 | 2,792 | 3,448 | 3,538 | ||||
| 3 | 2,708 | 2,853 | 2,855 | 2,861 | 2,885 | 2,915 | ||||
| 4 | 1,124 | 1,410 | 1,753 | 2,152 | 2,380 | 2,590 | ||||
| 5 | 988 | 1,306 | 1,543 | 1,659 | 2,075 | 2,238 | ||||
| 6 | 1,137 | 1,287 | 1,470 | 1,277 | 1,691 | 1,802 | ||||
| 7 | 254 | 357 | 459 | 637 | 848 | 1,040 | ||||
| 8 | 223 | 395 | 526 | 547 | 677 | 717 | ||||
| 9 | 116 | 148 | 216 | 265 | 625 | 681 | ||||
| 10 | 254 | 285 | 313 | 332 | 605 | 616 | ||||
| 11 | 293 | 339 | 379 | 409 | 499 | 550 | ||||
| 12 | 485 | 490 | 491 | 499 | 486 | 476 | ||||
| 13 | 270 | 333 | 374 | 460 | 455 | 475 | ||||
| 14 | 202 | 217 | 227 | 236 | 337 | 342 | ||||
| 15 | 188 | 204 | 230 | 226 | 334 | 374 | ||||
| 16 | 52 | 85 | 106 | 111 | 177 | 196 | ||||
| 17 | 96 | 111 | 116 | 123 | 142 | 148 | ||||
| 18 | 18 | 59 | 105 | 120 | 125 | 137 | ||||
| 19 | 66 | 80 | 73 | 74 | 93 | 110 | ||||
| 20 | 67 | 73 | 84 | 100 | 108 | 113 | ||||
| 21 | 84 | 98 | ||||||||
| 22 | 22 | 56 | 74 | 81 | 58 | 59 | ||||
| 23 | 25 | 29 | 32 | 36 | 34 | 35 | ||||
| 24 | 18 | 20 | 23 | 23 | 30 | 33 | ||||
| 25 | 16 | 19 | 22 | 25 | 23 | 27 | ||||
| 26 | 1 | 1 | 1 | 3 | 10 | 12 | ||||
| 27 | 1 | 2 | 2 | 3 | 6 | 8 | ||||
| 28 | 1 | 2 | 2 | 3 | 4 | 6 | ||||
| 19.08 | 21.60 | 23.49 | 25.55 | 29.66 | 31.39 | |||||
Notes:
| ||||||||||
| Solar heating in watts per capita[20][21] | |||
|---|---|---|---|
| # | Country | 2011 | 2013 |
| 1 | 609 | 551 | |
| 2 | 397 | 419 | |
| 3 | 253 | 263 | |
| 4 | 130 | 150 | |
| 5 | 80 | 83 | |
| 6 | 78 | 108 | |
| 7 | 65 | 72 | |
| 8 | 58 | 68 | |
| 9 | 53 | 65 | |
| 10 | 41 | 48 | |
| 11 | 37 | 51 | |
| 12 | 35 | 36 | |
| 12 | 35 | 37 | |
| 14 | 34 | 43 | |
| 15 | 27 | 43 | |
| 15 | 27 | 34 | |
| 17 | 25 | 27 | |
| 18 | 19 | 21 | |
| 19 | 17 | 27 | |
| 20 | 11 | 8 | |
| 21 | 9 | 14 | |
| 22 | 7 | 7 | |
| 23 | 5 | 6 | |
| 24 | 4 | 6 | |
| 24 | 4 | 6 | |
| 26 | 1 | 4 | |
| 27 | 1 | 3 | |
| 28 | n.a. | 23 | |
| – | 55 | 62 | |
| Solar heating – Historical data in kWth from 2004–2010 | ||||||||
|---|---|---|---|---|---|---|---|---|
| Country | Total (2010) | Total (2009) | Total (2008) | add 2006 | add 2005 | add 2004 | ||
| Germany | 9,676,800 | 8,896,300 | 7,765,800 | 1 050 000 | 665 000 | 525 000 | ||
| Greece | 2,858,940 | 2,851,940 | 2,707,740 | 168 000 | 154 350 | 150 500 | ||
| Austria | 2,685,556 | 2,517,812 | 2,268,231 | 204 868 | 163 429 | 127 816 | ||
| Italy | 1,870,211 | 1,404,361 | 1 124 361 | 130 200 | 88 941 | 68 417 | ||
| Spain | 1,474,806 | 1,261,516 | 987,816 | 122 500 | 74 760 | 63 000 | ||
| France[29] | 1,101,730 | 1,371,370 | 1,136,870 | 154 000 | 85 050 | 36 400 | ||
| Cyprus | 500,515 | 514,640 | 485,240 | 42 000 | 35 000 | 21 000 | ||
| Portugal | 470,888 | 345,338 | 223,265 | 14 000 | 11 200 | 7 000 | ||
| Poland | 459,123 | 356,902 | 255,973 | 28 980 | 19 390 | 20 230 | ||
| UK | 401,254 | 332,514 | 270,144 | 37 800 | 19 600 | 17 500 | ||
| Denmark | 367,602 | 330,946 | 292,796 | 17 710 | 14 875 | 14 000 | ||
| Netherlands | 313,317 | 285,139 | 254,339 | 10 280 | 14 174 | 18 410 | ||
| Belgium | 229,703 | 203,593 | 188,263 | 24 945 | 14 164 | 10 290 | ||
| Sweden | 226,615 | 217,362 | 202,445 | 19 977 | 15 835 | 14 041 | ||
| Czech Republic | 215,863 | 147,854 | 115,570 | 15 421 | 10 885 | 8 575 | ||
| Slovenia | 122,710 | 111,510 | 96,110 | 4 830 | 3 360 | 1 260 | ||
| Hungary | 104,870 | 57,813 | 17,675 | 700 | 700 | 1 050 | ||
| Ireland | 92,042 | 75,432 | 52,080 | 3 500 | 2 450 | 1 400 | ||
| Slovakia | 85,225 | 76,125 | 66,675 | 5 950 | 5 250 | 3 850 | ||
| Bulgaria | 73,710 | 89,530 | 22,120 | 1,540 | 1,400 | 1,260 | ||
| Romania | 73,290 | 80,010 | 66,010 | 280 | 280 | 280 | ||
| Malta | 32,102 | 28,602 | 24,752 | 3,150 | 2,800 | 2,951 | ||
| Finland | 23,046 | 18,881 | 17,705 | 2,380 | 1,668 | 1,141 | ||
| Luxembourg | 22,120 | 19,040 | 15,750 | 1,750 | 1,330 | 1,190 | ||
| Estonia | 2,044 | 1,694 | 1,379 | 210 | 175 | 175 | ||
| Latvia | 1,358 | 1,218 | 5,005 | 840 | 700 | 350 | ||
| Lithuania | 1,680 | 1,540 | 3,003 | 420 | 350 | 350 | ||
| EU27+CH GWth |
24.11 | 22.14 | 19.08 | 2.10 | 1.43 | 1.14 | ||
| * = The relation between collector area and capacity: m2 = 0.7 kWthermal | ||||||||
Organizations
The European Photovoltaic Industry Association (EPIA) represents members active along the whole solar PV value chain. EPIA’s mission is to give its global membership a distinct and effective voice in the European market, especially in the EU.[34]
See also
References
- 1 2 3 4 [Solar Thermal Markets in Europe Trends and Market Statistics 2010], European Solar Thermal Industry Federation (ESTIF) June 2011 p. 14-15, Figure Capacity in operation 2010/2020
- 1 2 3 4 Global Market Outlook for Photovoltaics until 2016
- ↑ Fact Sheets
- ↑ Photovoltaic barometer 208 February 2012
- ↑ Denmark reaches 2020-goal for solar energy before time 12.09.2012
- ↑ http://www.vecernji.hr/kompanije-i-trzista/razgrabljeni-poticaji-za-solarne-elektrane-915586
- ↑ Photovoltaic energy barometer 2007 – EurObserv’ER Systèmes solaires Le journal des énergies renouvelables n° 178, p. 49-70, 4/2007
- ↑ Photovoltaic energy barometer 2009 – EurObserv’ER Systèmes solaires Le journal des énergies renouvelables n° 190, p. 72-102, 3/2009
- ↑ Photovoltaic energy barometer 2010 – EurObserv’ER
- 1 2 Photovoltaic energy barometer 2011 – EurObserv’ER
- 1 2 Photovoltaic energy barometer 2012 – EurObserv’ER
- 1 2 Photovoltaic energy barometer 2013 – EurObserv’ER
- 1 2 Photovoltaic energy barometer 2014 – EurObserv’ER
- 1 2 Photovoltaic energy barometer 2015 – EurObserv’ER
- 1 2 Photovoltaic energy barometer 2016 – EurObserv’ER
- ↑ https://uk.reuters.com/article/croatia-solar/croatia-eyes-solar-power-in-bid-to-curb-energy-imports-idUKL8N1NM4D7
- ↑ "Concentrating Solar Power" (PDF). Archived from the original (PDF) on 9 January 2012. Retrieved 18 February 2014.
- ↑ Spain's round-the-clock solar power plant
- ↑ CSP Today, April 11, 2014 "Italian project shows strong potential for sand based CSP"
- 1 2 EurObserv'ER: Solar thermal and concentrated solar power barometer - May 2012
- 1 2 3 EurObserv'ER: Solar thermal and concentrated solar power barometer - May 2014 Archived 25 November 2014 at WebCite
- ↑ Solar Thermal Action Plan for Europe ESTIF, 1/2007 Archived 28 September 2007 at the Wayback Machine.
- ↑ http://www.estif.org/ European Solar Thermal Industry Federation (ESTIF) Solar Thermal Markets in Europe - Trends and Market Statistics in 2013, June 2014 archive
- ↑ http://www.estif.org European Solar Thermal Industry Federation (ESTIF) Solar Thermal Markets in Europe - Trends and Market Statistics in 2011, June 2012 archive
- ↑ http://www.estif.org European Solar Thermal Industry Federation (ESTIF) Solar Thermal Markets in Europe - Trends and Market Statistics in 2010, June 2011 archive
- ↑ http://www.eurobserv-er.org - EurObserv'ER Solar thermal and concentrated solar power barometer for 2010, May 2011, archive
- ↑ http://www.estif.org European Solar Thermal Industry Federation (ESTIF) Solar Thermal Markets in Europe - Trends and Market Statistics in 2009, June 2010 archive
- ↑ Solar Thermal Markets in Europe - Trends and Market Statistics in 2008, May 2009 archive
- ↑ since 2010 overseas departments excluded
- ↑ Solar Thermal Markets in Europe, Trends and market statistics 2006 Archived 28 September 2007 at the Wayback Machine. European Solar Thermal Industry Federation ESTIF, June 2007
- ↑ "Solar Thermal Markets in Europe, Trends and market statistics 2008" (PDF). Retrieved 24 April 2011.
- ↑ estif.org - European Solar Thermal Industry Federation Solar Thermal Markets in Europe, Trends and market statistics 2009
- ↑ estif.org - European Solar Thermal Industry Federation Solar Thermal Markets in Europe, Trends and market statistics 2010, June 2011
- ↑ Mission & Activities
External links
|
|
|
| Africa | |||||
|---|---|---|---|---|---|
| Asia | |||||
| Europe |
| ||||
| North America | |||||
| Oceania | |||||
| South America | |||||
| |||||