Energy in Poland
Energy in Poland describes energy and electricity production, consumption and import in Poland.
In 2009, Poland was world's 9th largest hard coal producer. The country is also the second largest coal consumer in Europe behind Germany.[1]
Overview
| Energy in Poland[2] | ||||||
|---|---|---|---|---|---|---|
| Capita | Prim. energy | Production | Import | Electricity | CO2-emission | |
| Million | TWh | TWh | TWh | TWh | Mt | |
| 2004 | 38.2 | 1,067 | 917 | 157 | 131 | 296 |
| 2007 | 38.1 | 1,129 | 845 | 294 | 140 | 305 |
| 2008 | 38.1 | 1,138 | 830 | 352 | 142 | 299 |
| 2009 | 38.2 | 1,093 | 785 | 352 | 137 | 287 |
| 2010 | 38.2 | 1,180 | 784 | 373 | 144 | 305 |
| 2012 | 38.5 | 1,178 | 797 | 402 | 148 | 300 |
| 2012R | 38.5 | 1,138 | 831 | 360 | 148 | 294 |
| 2013 | 38.5 | 1,135 | 825 | 301 | 150 | 292 |
| Change 2004-10 | 0.0 % | 10.6 % | -14.5 % | 138 % | 10.3 % | 3.1 % |
| Mtoe = 11.63 TWh, Prim. energy includes energy losses that are 2/3 for nuclear power [3]
2012R = CO2 calculation criteria changed, numbers updated | ||||||
| Diesel | Gasoline | Natural gas | Coal | Electricity | ||
|---|---|---|---|---|---|---|
| per unit | liter | liter | m3 | GJ | GJ | MWh |
| Excise | 1.459 | 1.669 | 1.28 | 1.28 | ||
| Environment | ||||||
Coal
In 2009 Poland produced 78 megatonnes (Mt) of hard coal and 57 Mt of brown coal.
Coal and the environment
Coal mining has far-reaching effects on local water resources. Coal mining requires large amounts of water. Mining activities have dropped the water level of Lake Ostrowskie by almost two meters in the Kuyavia–Pomerania and the lakes in the Powidz Landscape Park. According to Poznań's University of Agriculture, the water drainage in the Kleczew brown coal mining areas has formed craters in the area.[1]
Coal and the public
In April 2008, five thousand people demonstrated in Kruszwica to protect cultural heritage and the nature reserve at Lake Gopło. This was the first protest of its kind in the country's history. Gopło Millennium Park (Nadgoplański Park Tysiąclecia) is protected by the European Union's Natura 2000 program and includes a major bird sanctuary. The Tomisławice opencast mine (less than 10 kilometers away from the Kruszwica mine) was due to open in 2009.[1]
Coal and business
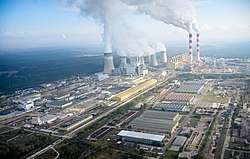
The Bełchatów Power Station in the Łódź region supplies almost 20% of Poland's energy. It is the largest brown coal power plant in Europe.
Electricity
In 2008, a net 143 TWh of electricity were produced in coal-based power plants.[5]
Renewable energy
A binding European Union resolution, the Renewable Energy Directive 2009, stipulates a 15% renewable energy target for total energy use in Poland by 2020. According to the Polish National Renewable Energy Action Plan, the 2020 figure is set to exceed this target by 0.5% at 15.5% of overall energy use, broken down as 19.1% of total electricity consumption, 17% in the heating and cooling sector, and 10.1% in the transport sector.[6]
As of 2014 - 2015 renewable energy provided around 10% of total primary energy supply in Poland as well as around 13% of total electricity generation.[7]
Progress towards targets
| 2013 | 2014 | |
|---|---|---|
| Renewable energy share of heating and cooling sector | 14.07% | 13.95% |
| Renewable energy share of electricity sector | 10.73% | 12.40% |
| Renewable energy share of transport sector | 6.03% | 5.67% |
| Renewable energy share of total energy consumption | 11.34% | 11.45% |
As of year end 2014 Poland had achieved an 11.45% share of renewable energy use as a percentage of overall energy usage. The overall 2014 share breaks down as 13.95% of the heating and cooling sector, 12.40% of the electricity sector and 5.67% of the transport sector.
Sources
Biomass and waste
As of 2015 Biomass and waste was the largest source of renewable energy in Poland providing an estimated 8.9% of total primary energy supply (TPES) in that year and an estimated 6.1% of electricity generation.[7]
Solid biomass is the most important source by volume, providing fuel for heat and power plants or consumed directly for industrial or household heat requirements. Biogasses are also used in heat and power plants as well whilst waste is mainly used as a fuel in industry.[7] In 2014 0.7 Mtoe of biofuels were used in transport, 81% as biodiesel and 19% as biogasoline, making up 5% of the total energy consumption in the transport sector in 2014.[7]
Wind power
| EU and Poland Wind Energy Capacity (MW)[9][10][11][12][13][14][15][16] | ||||||||||||||||||||
|---|---|---|---|---|---|---|---|---|---|---|---|---|---|---|---|---|---|---|---|---|
| No | Country | 2016 | 2015 | 2014 | 2013 | 2012 | 2011 | 2010 | 2009 | 2008 | 2007 | 2006 | 2005 | 2004 | 2003 | 2002 | 2001 | 2000 | 1999 | 1998 |
| - | EU-27 | 153,641[16] | 142,042[16] | 128,751[17] | 117,384[17] | 105,696 | 93,957 | 84,074 | 74,767 | 64,712 | 56,517 | 48,069 | 40,511 | 34,383 | 28,599 | 23,159 | 17,315 | 12,887 | 9,678 | 6,453 |
| 9 | Poland | 5,782[16] | 5,100[16] | 3,834[17] | 3,390[17] | 2,497 | 1,616 | 1,107 | 725 | 544 | 276 | 153 | 83 | 63 | 63 | 27 | 0 | 0 | 0 | 0 |
Wind power is estimated to have provided 6.6% of total electricity generation in 2015.[7]
The Polish NREAP plan is targeting 6,700 MW of wind power by 2020 whilst EWEA's 2009 forecast suggests a higher wind capacity of 10–12 GW is possible.[18]
The Polish government had plans to reach 2,000 MW in wind power capacity and a 2.3% share of wind generation in domestic energy consumption by 2010.[19] By the end of 2010, the capacity stood at 1,107 MW.[20] If Poland had the same wind power density as Denmark, there would have been 23 GW of wind power by the end of 2008.[21]
Hydroelectric power
| Name | Location | Coordinates | Capacity, MWe | Type | Ref |
|---|---|---|---|---|---|
| Żarnowiec | Pomorskie | 680 | pumped storage | [22] | |
| Żar | Śląskie | 500 | pumped storage | [23] | |
| Solina | Solina | 200 | pumped storage | [24] | |
| Włocławek | Kujawsko-Pomorskie | 160 | river dam | [25] | |
| Żydowo | Zachodnio-Pomorskie | 150 | pumped storage | [26] | |
| Niedzica | Małopolskie | 92.75 | pumped storage | [27][28] | |
| Dychów | Lubuskie | 90 | pumped storage | [29] | |
| Rożnów | Małopolskie | 50 | run of the river | [30][31] | |
| Grajówka | Lubuskie | 2.79 | run of the river | [32][33] | |
| Future planned plants | |||||
| Mloty | Województwo Dolnośląskie | 750 | pumped storage | [28][34] | |
In 2014 there were 2,364 MW installed capacity of hydroelectric power as well as 1,406 MW pumped storage capacity.[35] In 2015 hydroelectricity generated approximately 1.1% of total electricity in Poland.[36]
Solar power
| 2005 | 2006 | 2007 | 2008 | 2009 | 2010 | 2011 | 2012 | 2013 | 2014 | 2015 | 2016 |
|---|---|---|---|---|---|---|---|---|---|---|---|
| 0.3 | 0.4 | 0.6 | 1 | 1 | 2 | 1.8 | 3.4 | 4.2 | 29.9 | 110.9 | 195.7* |
| * Estimated figure | |||||||||||
Solar power expanded slowly reaching 4.2 MW by 2013. After 2013 installed capacity began to rise more quickly reaching 195.7 MW by 2016.
Air quality
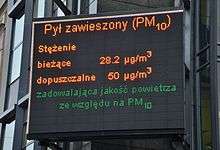
The PM10 warning limit is 300 μg/m3 in Poland, whereas it is 80 in Paris.[46]
Global warming
Poland opposed the 2009 EU proposal to support developing countries in applying measures against global warming, at a cost of 5-7 billion € during the years 2010–2012.[47]
See also
References
- 1 2 3 "The True Cost of Coal" (PDF). Greenpeace. November 27, 2008. pp. 6, 54–57. Archived from the original on 2009-12-30. Retrieved 2011-05-22.
- ↑ IEA Key World Energy Statistics Statistics 2015, 2014 (2012R as in November 2015 + 2012 as in March 2014 is comparable to previous years statistical calculation criteria, 2013, 2012, 2011, 2010, 2009, 2006 IEA October, crude oil p.11, coal p. 13 gas p. 15
- ↑ "Energy in Sweden Facts and Figures" (PDF). The Swedish Energy Agency. 2010. p. 12. Archived from the original (PDF) on 2012-03-17. Retrieved 2011-05-22.
- ↑ Michel, Sharon. ENERGY PRICES AND TAXES, COUNTRY NOTES, 3rd Quarter 2015 Archived January 19, 2016, at the Wayback Machine., page 40. International Energy Agency, 2015
- ↑ "Key World Energy Statistics" (PDF). International Energy Agency. 2010. p. 54. Retrieved 2011-05-22.
- ↑ "National action plans - Energy - European Commission". Energy. Retrieved 2017-06-27.
- 1 2 3 4 5 "Publication: Energy Policies of IEA Countries - Poland 2016 Review". www.iea.org. Retrieved 2017-06-03.
- ↑ "Progress reports - Energy - European Commission". Energy. Retrieved 2016-07-02.
- ↑ EWEA Staff (2010). "Cumulative installed capacity per EU Member State 1998 - 2009 (MW)". European Wind Energy Association. Retrieved 2010-05-22.
- ↑ EWEA Staff (February 2011). "EWEA Annual Statistics 2010" (PDF). European Wind Energy Association. Retrieved 2011-01-31.
- ↑ EWEA Staff (February 2012). "EWEA Annual Statistics 2011" (PDF). European Wind Energy Association. Retrieved 2011-02-18.
- ↑ Wind in power: 2012 European statistics February 2013
- ↑ http://www.euractiv.com/sections/energy/polands-renewable-capacity-grows-94-6-gw-2014-311760
- ↑ "Mapa odnawialnych źródeł energii na podstawie udzielonych przez Prezesa URE koncesji oraz wpisów do rejestrów prowadzonych przez Prezesa URE i Prezesa ARR". www.ure.gov.pl.
- ↑ "Polish Wind Association Web Site". elektrownie-wiatrowe.org.pl.
- 1 2 3 4 5 EWEA: "Wind in power: 2017 European statistics", February 2017
- 1 2 3 4 EWEA: "Wind in power: 2014 European statistics", February 2014
- ↑ "EU Energy Police to 2050" (PDF). The European Wind Energy Association. March 2011. Retrieved 2011-05-22.
- ↑ "Global Wind Report" (PDF). Global Wind Energy Council. 2006. p. 25. Retrieved 2011-05-22.
- ↑ "Wind in Power – European Statistics" (PDF). The European Wind Energy Association. 2010. Retrieved 2011-05-22.
- ↑ "Pure Power – Wind Energy Targets for 2020 and 2030" (PDF). The European Wind Energy Association. 2009. Archived from the original (PDF) on 2011-04-07. Retrieved 2011-05-22.
- ↑ "Zarnowiec Pumped Storage Hydroelectric Power Plant". Global Energy Observatory. Retrieved 1 March 2014.
- ↑ "Porabka-Zar Pumped Storage Power Plant Poland". Global Energy Observatory. Retrieved 1 March 2016.
- ↑ "DHV Hydroprojekt Sp. z o.o." www.dhvhydroprojekt.com.pl (in Polish). Retrieved 2017-06-22.
- ↑ "Hydroelectric Power Plants in Poland - Pomorskie". Gallery. Power Plants Around The World. 8 February 2009. Retrieved 1 March 2014.
- ↑ "Zydowo Pumped Storage Hydroelectric Power Plant". Global Energy Observatory. Retrieved 1 March 2014.
- ↑ "ZEW Niedzica S.A." (in Polish). Retrieved 30 October 2014.
- 1 2 Administrator. "Hydro Power Plants". www.energoprojekt.pl. Retrieved 2017-06-25.
- ↑ "ZEW Dychów" (in Polish). Retrieved 30 October 2014.
- ↑ "TAURON Ekoenergia Sp. z o.o." (in Polish). Retrieved 30 October 2014.
- ↑ "Central and Eastern European Hydroelectric Power Outlook, KPMG" (PDF).
- ↑ "ZEW Dychów" (in Polish). Retrieved 30 October 2014.
- ↑ "Grajówka". www.pgeeo.pl. Retrieved 2017-06-25.
- ↑ "Mloty PSPS Project, EDF Polska" (PDF).
- ↑ "Publication: Energy Policies of IEA Countries - Poland 2016 Review, pg 98". www.iea.org. Retrieved 2017-05-13.
- ↑ "Energy policies of IEA countries, Poland 2016, pg95".
- 1 2 Photovoltaic energy barometer 2009 – EurObserv’ER Systèmes solaires Le journal des énergies renouvelables n° 190, p. 72-102, 3/2009
- ↑ Photovoltaic energy barometer 2007 – EurObserv’ER Systèmes solaires Le journal des énergies renouvelables n° 178, p. 49-70, 4/2007
- ↑ Photovoltaic energy barometer 2010 – EurObserv’ER
- 1 2 Photovoltaic energy barometer 2011 – EurObserv’ER
- ↑ "Photovoltaic energy barometer 2012 – EurObserv'ER". eurobserv-er.org.
- ↑ Photovoltaic energy barometer 2013 – EurObserv’ER
- ↑ Photovoltaic energy barometer 2014 – EurObserv’ER
- ↑ "Photovoltaic barometer 2016 - EurObserv'ER". www.eurobserv-er.org.
- ↑ "Photovoltaic energy barometer 2017 – EurObserv'ER".
- ↑ "Polish pollution akin to smoking 4,000 cigarettes a year". EurActiv.com. 20 January 2017. Retrieved 1 February 2017.
- ↑ "Puola ei suostu ilmastotalkoisiin" (in Finnish). YLE. October 2, 2009. Retrieved 2011-05-22.
External links
| Wikimedia Commons has media related to Energy in Poland. |
- European Commission National Renewable Energy Action Plans
- European Commission renewable energy Progress Reports
- European Commission National Energy Efficiency Energy Action Plans
- Report on the Polish power system (PDF 1.44 MB), February 2014
Poland articles | |||||||||
|---|---|---|---|---|---|---|---|---|---|
| History |
|  | |||||||
| Geography | |||||||||
| Politics | |||||||||
| Economy | |||||||||
| Culture |
| ||||||||
| |||||||||
| Africa | |||||
|---|---|---|---|---|---|
| Asia | |||||
| Europe |
| ||||
| North America | |||||
| Oceania | |||||
| South America | |||||
| |||||