Solar power in the United Kingdom
 |
 |
.JPG) | |
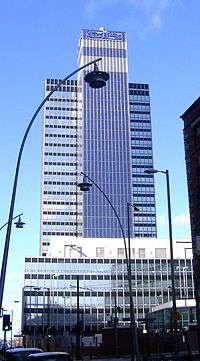
| Top-left: solar panels on the BedZED development in the London Borough of Sutton. Bottom-left: residential rooftop solar PV in Wetherby, Leeds. Right: the CIS Tower was clad in building-integrated PV and connected to the grid in 2005. | |
Solar power represented a very small part of electricity production in United Kingdom until 2011. The installed base has increased rapidly in recent years as a result of reductions in the cost of photovoltaic (PV) panels, and the introduction of a feed-in tariff (FIT) subsidy in April 2010.[1]
In 2012, the government announced that 4 million homes across the UK will be powered by the sun within eight years,[2] representing 22 GW of installed solar power capacity by 2020.[1] The 72MW(DC) Shotwick Solar Farm is the largest in the United Kingdom.[3]
As of May 2017, there is a total installed capacity of 12,318 megawatt (MW) of PV solar power,[4][5] placing the United Kingdom in sixth place internationally in terms of total installed capacity. In 2017 the UK generated 3.4% of its total electricity using solar power.[6] The all-time peak generation from photovoltaics was 9.42GW on 14 May 2018.[7]
History
In 2006, the United Kingdom had installed about 12 MW of photovoltaic capacity[8] and represented only 0.3% of total European solar PV of 3,400 MW.[9] In August 2006 there was widespread news coverage in the United Kingdom of the major high street electrical retailers Currys' decision to stock PV modules, manufactured by Sharp, at a cost of £1,000 per module. The retailer also provided an installation service.
Solar power use increased very rapidly in subsequent years, as a result of reductions in the cost of PV panels, and the introduction of a FIT subsidy in April 2010.[1] The introduction of the feed-in-tariff (FiT) in 2010 saw rapid growth of the UK photovoltaic market, with many thousands of domestic installations along with numerous commercial, community and industrial projects.
The FiT were cut in the fast track review announced by DECC on 9 June 2011.[10] As a result, large arrays of solar photovoltaics became a much less attractive investment opportunity for developers, especially for projects greater than 250 kW, so large field arrays such as these were less likely to be built beyond the 1 August 2011 cut off date, at least not until 2012, when PV prices reduced somewhat - a utility scale solar farm is paid 8.9 p/kWhr generated.[11] The first solar park in Wales became operational in 2011 at Rhosygilwen, north Pembrokeshire.[12] At the end of 2011, there were 230,000 solar power projects in the United Kingdom,[1] with a total installed generating capacity of 750 MW.[13]
On 13 July 2011, construction of the largest solar park in the United Kingdom was completed in Newark-on-Trent in Nottinghamshire. The 4.9 MW free-field system was built in just seven weeks after being granted planning permission. The system generates an estimated 4,860 MW·h of electricity (an average power of 560 kW) into the national grid each year.[14] There are several other examples of 4–5 MW field arrays of photovoltaics in the UK, including the 5 MW Langage Solar Park, the 5 MW Westmill Solar Farm, the 4.51 MW Marsten Solar Farm and Toyota's 4.6 MW plant in Burnaston, Derbyshire.[15]
The first large solar farm in the United Kingdom, a 32 MW solar farm, began construction in November 2012. It is located in Leicestershire, between the runways of the former military airfield, Wymeswold.[16] By February 2012 the installed capacity had reached 1,000 MW.[17] In 2012, the government said that 4 million homes across the UK will be powered by the sun within eight years.[2] The government expects Britain to have 22 gigawatts of installed solar power capacity by 2020.[1]
At the end of September 2013, retailer Ikea announced that solar panel packages for houses would be sold at 17 United Kingdom stores by July 2014. The decision followed a successful pilot project at the Thurrock Ikea store, during which one photovoltaic (PV) system was sold almost every day. The panels are manufactured by the Chinese company Hanergy.[18] This partnership did not last and in October 2015 Ikea ended its relationship with Hanergy.[19]
As of June 2014 there were 18 schemes generating more than 5 MW and 34 in planning or construction in Wales.[20] By 2016 the total installed capacity was over 10,000 MW. In the summer half-year from April to September 2016, UK solar panels produced more electricity (6,964 GWh) than did coal power (6,342 GWh). Each is about 5% of demand.[21]
Solar potential

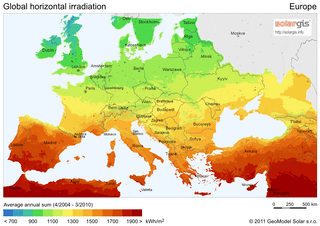
The UK's annual insolation is in the range of 750–1,100 kilowatt-hours per square metre (kWh/m²). London receives 0.52 and 4.74 kWh/m² per day in December and July, respectively.[22] While the sunniest parts of the UK receive much less solar radiation than the sunniest parts of Europe, the country's insolation in the south is comparable with that of central European countries, including Germany, which generates about 7% of its electricity from solar power.[23] Additionally, the UK's higher wind speeds cool PV modules, leading to higher efficiencies than could be expected at these levels of insolation.[24]
The Department of Energy and Climate Change (DECC) assumes an average capacity factor of 9.7% for solar photovoltaics in the UK.[25]
Derry Newman, chief executive of Solarcentury, argues that the UK's "famously overcast weather does not make it an unsuitable place for solar power, as solar panels work on daylight, not necessarily direct sunlight."[26] Some solar cells work better in direct sunlight, others can use more diffuse light. While insolation rates are lower in England than France and Spain, they are still usable.[27] Many of the solar panels can be monitored on the internet, such as the Slepe Farm in Dorset, a 492 kW solar field.[28]
Government programmes
The Energy Saving Trust that administers government grants for domestic photovoltaic systems, the Low Carbon Building Programme, estimates that an installation for an average-sized house would cost between £5,000–£8,000, with most domestic systems usually between 1.5 and 3 kWp, and yield annual savings between £150 and £200.[29]
The Green Energy for Schools programme will be providing 100 schools across the UK with solar panels. The first school in Wales was the Tavernspite School, near Whitland, which has received panels worth £20,000, sufficient to produce 3,000 kW·h of electricity each year.[30]
Feed-in tariff
Discussion on implementation of a feed-in tariff programme concluded on 26 September 2008, and the results were published in 2009.[31]
The government in the UK agreed in April 2010 to pay for all grid-connected generated electricity at an initial rate of up to 41.3p (US$0.67) per kWh, whether used locally or exported.[32] The rates proved more attractive than necessary, and in August 2011, were drastically reduced for installations over 50 kW,[33] a policy change criticized as marking "the end of the UK’s solar industry as we know it".[34]
Feed In Tariff rates are adjusted annually by the government[35]. As of 8 February 2016, the rate is 4.39 pence per kWh of power generated for domestic systems of 4kWp (p means peak i.e. the maximum power that the system can produce) or less and where homes meet the minimum EPC requirement of band D.[36] The Export Tariff is 4.85 pence per kWh exported to the grid. The amount of electricity exported is not usually measured for domestic installations. It is calculated by assuming that 50% of the electricity produced is exported into the grid.
The Department of Business Energy and Industrial Strategy (BEIS) published a consultation on 19 July 2018. In this, they state their intention to close the Feed-in Tariff scheme to new applicants from 1 April 2019[37] and will not be replaced by a new subsidy.[38]
Net metering
Net metering is only available from one company, Eastern Energy, where it is referred to as "SolarNet".[39]
Solar PV

|
0–1 watt
1–10 watts
10–50 watts |
50–100 watts
100–200 watts
200–350 watts |
Solar power generation totals can only be an estimate due to the nature of each solar site experiencing its own weather, individual siting and angle in relation to the sun etc. Also as the power generated then used by equipment onsite will never reach the grid from all sites the total can never be directly calculated by government statistics as obtained from the national grid. Given this there will still be quite accurate estimates which combine weather reports from around the UK and the simple addition of average generation potential of Solar Panels in the UK in any given year.
The table below shows electricity production from solar panels as a percentage of the final consumption of electricity in the UK and not gross supply to the grid. These numbers may be updated as the UK government has an average time lag of around 6 months in completing the backlog of officially processing the large number of solar installations.
| Year end | 2008[41] | 2009[41] | 2010[41][42] | 2011[42][43] | 2012[40][44] | 2013[44] | 2014[45] | 2015[46] | 2016[46] | 2017[6] |
|---|---|---|---|---|---|---|---|---|---|---|
| Capacity[5] (MW) |
22 | 27 | 95 | 965 | 1,736 | 2,822 | 5,378 | 9,118 | 11,562 | 12,760 |
| Generation (GW·h) |
17 | 20 | 33 | 259 | 1,328 | 2,015 | 4,050 | 7,561 | 10,292 | 11,479 |
| % of total electricity consumption |
<0.01 | <0.01 | 0.01 | 0.07 | 0.37 | 0.64 | 1.33 | 2.49 | 3.1 | 3.4 |
See also
- Renewable energy in the United Kingdom
- Renewable energy in Scotland
- Energy use and conservation in the United Kingdom
- Energy policy of the United Kingdom
- Green electricity in the United Kingdom
- Solar power in the European Union
- Renewable energy by country
- UK-ISES
- United Kingdom National Renewable Energy Action Plan
References
- 1 2 3 4 5 Yeganeh Torbati (Feb 9, 2012). "UK wants sustained cuts to solar panel tariffs". Reuters.
- 1 2 Fiona Harvey (9 February 2012). "Greg Barker: 4m homes will be solar-powered by 2020".
- ↑ Foresight Solar Fund snaps up 72-MWp solar park, UK's largest, RenewablesNow, February 3, 2017
- ↑ "Solar photovoltaics deployment". www.gov.uk.
- 1 2 3 "Statistics – Solar photovoltaics deployment". https://www.gov.uk/. DECC – Department of Energy & Climate Change. 2015. Retrieved 26 February 2015. External link in
|website=(help) - 1 2 "ENERGY TRENDS - Table 6.1. Renewable electricity capacity and generation" (PDF). Department of Energy & Climate Change. March 2018. p. 71. Retrieved 29 March 2018.
- ↑ Sheffield University, 31/10/2017
- ↑ Observ'ER. "Observ'ER - l'observatoire des énergies renouvelables" (PDF). www.energies-renouvelables.org.
- ↑ "Solar Photovoltaics". epia.org.
- ↑ "Feed in Tariff Fast Track Review".
- ↑ "Tariffs payable per kWh of electricity produced - FI Tarrifs - Feed-In Tariffs". fitariffs.co.uk.
- ↑ "Wales' first solar park powers up in Pembrokeshire". BBC. 8 July 2011. Retrieved 25 June 2014.
- ↑ European Photovoltaic Industry Association (2012). "Market Report 2011".
- ↑ "Conergy completes record-breaking UK solar park". Solar Power Portal. 13 July 2011.
- ↑ Hughes, Emma (3 August 2011). "Just how many solar projects beat the fast track review?". Solar Power Portal. Semiconductor Media, Ltd. Retrieved 4 August 2011.
- ↑ "Construction Begins on Britain's Largest Solar Plant". solartribune.com.
- ↑ Jonathan Gifford (23 February 2012). "UK hits one GW of PV capacity". PV Magazine. Missing or empty
|url=(help) - ↑ Reuters (30 September 2013). "Ikea to sell solar panels in UK. stores". The Guardian. Retrieved 1 October 2013.
- ↑ "Subscribe to read". Financial Times.
- ↑ "Solar parks: Large scale schemes 'to double' in Wales". BBC. 25 June 2014. Retrieved 25 June 2014.
- ↑ "Analysis: UK solar beats coal over half a year". Carbon Brief. Retrieved 6 October 2016.
- ↑ "UK and Ireland Annual Insolation Map". ContemporaryEnergy.co.uk. 2007. Retrieved 2015. Check date values in:
|access-date=(help) - ↑
"Snapshot of Global PV 1992-2014" (PDF). http://www.iea-pvps.org/index.php?id=32. International Energy Agency — Photovoltaic Power Systems Programme. 30 March 2015. Archived from the original on 30 March 2015. External link in
|website=(help) - ↑ "Solar Cell Efficiency". solarpower2day.net.
- ↑ Hemingway, James (December 2013). "Estimating generation from Feed in Tariff installations" (pdf). Energy Trends. Department of Energy & Climate Change. p. 2.
- ↑ "UK's biggest solar energy farm connects to national grid". The Guardian. 27 June 2011.
- ↑ "Colored Solar Panels Don't Need Direct Sunlight". inhabitat.com.
- ↑ "Slepe Farm PV System Profile". www.sunnyportal.com.
- ↑ "Grants and Loans". energysavingtrust.org.uk. Archived from the original on 2008-10-11.
- ↑ "Free solar power first for school". 19 May 2008 – via news.bbc.co.uk.
- ↑ "UK Renewable Energy Strategy Consultation". berr.gov.uk.
- ↑ "Feed-in Tariff scheme". Energy Saving Trust. 1 April 2011. Retrieved 4 August 2011.
- ↑ Nichols, Will (1 August 2011). "Curtain falls on solar subsidy boom". BusinessGreen. Incisive Media Investments Limited. Retrieved 4 August 2011.
- ↑ Hughes, Emma (1 August 2011). "The end of large-scale solar as we know it". Solar Power Portal. Semiconductor Media, Ltd. Retrieved 4 August 2011.
- ↑ "Feed-In Tariff (FIT) rates". www.ofgem.gov.uk.
- ↑ https://www.ofgem.gov.uk/system/files/docs/2016/02/feed-in_tariff_generation_and_export_tables_08.02.2016_-_31.03.2016.pdf
- ↑ About the FIT scheme
- ↑ FiT changes on the way
- ↑ "SolarNet and Net Metering" (PDF). greenpeace.org.uk. Archived from the original (PDF) on 2013-06-03.
- 1 2 "Global Market Outlook for Photovoltaics 2014-2018" (PDF). www.epia.org. EPIA - European Photovoltaic Industry Association. p. 24. Archived from the original (PDF) on 12 June 2014. Retrieved 12 June 2014.
- 1 2 3 "ENERGY TRENDS - Table 5: Capacity of, and electricity generated from, renewable sources from 2008 to 2010" (PDF). www.decc.gov.uk. Department of Energy and Climate Change. June 2011. p. 27. Archived from the original (PDF) on 17 December 2012. Retrieved 18 June 2014.
- 1 2 EUROBSER'VER. "Photovoltaic Barometer - installations 2010 and 2011" (PDF). http://www.energies-renouvelables.org. p. 6. Archived from the original (PDF) on 16 June 2014. Retrieved 1 May 2013. External link in
|website=(help) - ↑ EUROBSER'VER. "Photovoltaic Barometer - installations 2011 and 2012" (PDF). http://www.energies-renouvelables.org. p. 7. Archived from the original (PDF) on 16 June 2014. Retrieved 1 May 2013. External link in
|website=(help) - 1 2 "ENERGY TRENDS - Table 6.1. Renewable electricity capacity and generation" (PDF). Department of Energy & Climate Change. March 2014. p. 50. Retrieved 18 June 2014.
- ↑ "ENERGY TRENDS - Table 5.2. Renewable electricity capacity and generation" (PDF). Department of Energy & Climate Change. March 2017. p. 47. Retrieved 31 March 2016.
- 1 2 "ENERGY TRENDS - Table 6.1. Renewable electricity capacity and generation" (PDF). Department of Energy & Climate Change. March 2017. p. 71. Retrieved 31 March 2017.
External links
| Wikimedia Commons has media related to Solar energy in the United Kingdom. |
- UK's First Solar Plant Gets Go-ahead: A disused tin mine is set to host the UK's first solar panel park after winning approval from Cornwall Council.
- Energy statistics from DECC
- Feed-in Tariff Installation Report
| Africa | |||||
|---|---|---|---|---|---|
| Asia | |||||
| Europe |
| ||||
| North America | |||||
| Oceania | |||||
| South America | |||||
| |||||