Renewable energy in Spain
| Renewable Energy in Spain | |
|---|---|
 | |
| Renewable Energy (RE) | |
| RE as % of Gross Final Energy Consumption. | 16.2% (2014) |
| Target for above. | 20.0% (2020) |
| Renewable Electricity | |
| Percentage electricity generated by RE. | 42.8% (2014) |
| RE generated / Total electricity generation. | 111,459/266,867 GWh Net(2014)[1] |
| Record % RE covered electricity consumption |
70.4% (21/11/15 wind only)[2] |
| Installed capacity (2015) | |
| Wind Power | 23 GW |
| Bio Energy | 0.75 GW |
| Solar Power | 7 GW |
| Hydro Power | 20.3 GW |
| Geothermal | 0 GW |
| Total | 51.1 GW |
| Country Notes | |
| |
| |
Electricity from renewable sources in Spain represented 42.8% of electricity demand coverage during 2014. The country has a very large wind power capability built up over many years and is one of the world leaders in wind power generation.
Initially Spain also positioned itself as a European leader in Solar power, by 2007-2010 the country was second only to Germany in installed capacity, however other countries (Italy in particular) have since leapfrogged Spanish development. By 2015 solar power in Spain though significant produced less than a third of that of wind power in 2015.
Spain has set the target of generating 20% of all its energy needs from renewable energy sources by 2020[3] and an additional 0.8% may be available for other EU countries under the cooperation mechanism bringing the total to 20.8%.[4] By the end of 2014 Spain had reached a level of 16.2% of all its energy needs from renewable energy sources.[5]
The story of renewable energy development in Spain is both a mixed and unfinished one. Under previous subsidies the country expanded its renewable base rapidly and helped establish a domestic industry in both wind turbine and solar energy. However, support was drastically cut back following the global financial crisis and new installations stagnated between 2012 and 2015. The debts incurred during the boom period have led to tougher and retrospective revisions of contracts to providers of renewable energy reducing returns considerably. In being one of the first-to-market countries, Spain faces the challenge of powerful competitors from countries such as Denmark, Germany and China and ironically a cheaper and more mature renewable energy sector which Spain itself helped to pioneer.
In 2015 solar power suddenly demonstrated a possible way through the impasse. The continued fall in prices for solar systems and Spain's abundant sunshine led to prices for solar power reaching grid price parity. Suddenly there was the potential for sustained and spontaneous growth in solar installations in Spain as households and producers could produce power more economically. However the Spanish government introduced what has been dubbed the world's first "sun tax" on solar installations making them economically less viable as well as draconian fines (up to 60 million Euros) for anyone not complying with the tax.
The tax has proved highly controversial. On the one hand the government has argued that those generating their own power still rely on the national grid for power backup and so should be liable for contributing to the cost. On the other hand, the solar industry has argued that the government is simply trying to protect the centralised established power producers whose revenues would be threatened by this competitive solar threat. Environmentalists have criticised the tax for artificially blocking Spain from continuing its long standing movement to renewable energy production.
Whatever the merits of both arguments, the controversy can only become more heightened as the price of solar energy continues to fall and if PV solar power installed capacity in Spain were to continue sliding down the EU league from 12th position in 2014 (102.9 kW per 1000 inhabitants). In the same year in terms of wind energy production Spain was much stronger in 3rd position (495 kW per 1000 inhabitants).
Energy consumption by sector
Projected total gross final energy consumption by sector in 2020 (calculated as per NREAP criteria.)
All EU countries as well as Iceland and Norway submitted National Renewable Energy Action Plans (NREAPs)[6] to outline the steps taken, and projected progress by each country between 2010 and 2020 to meet the Renewable Energy Directive. Each plan contains a detailed breakdown of each country's current renewable energy usage and plans for future developments. According to projections by the updated Spanish submission dated 20/12/11 by 2020 the gross final energy consumption in Spain by sector breaks down as follows.
| Projected energy use by sector in 2020[4] | ktoe | RE 2020 target |
|---|---|---|
| Heating and cooling | 30,929 | 17.3% |
| Electricity | 31,961 | 39.0% |
| Transport | 32.301 | 11.3% |
| Gross final energy consumption* | 98.693 | 20.0% |
* Including losses and adjustments
According to NREAP criteria around a third of energy consumption (32.5%) is used in the heating and cooling sector. The heating and cooling sector (also known as the thermal sector) includes domestic heating and air conditioning, industrial processes such as furnaces and any use of heat generally. The electricity sector and transport sector are also projected to account for around a third of energy consumption each at 33.6% and 33.9% respectively. The proportion of energy use in each sector is similar to that of 2016. In order to meet Spain’s overall target for 20% use of renewable energy (it was just 8.3% in 2005) in gross final energy consumption (20,505 ktoe) by 2020 targets have been set for each sector as follows: 17.3% renewable energy use in the heating and cooling sector, 39% in the electricity sector and 11.3% in the transport sector.[7] Total annual energy consumption is projected to be 98,693 ktoe (98.7 million tonnes of oil equivalent) by 2020. The report expected Spain to produce a surplus of 0.8% above the 20% target (20.8% total) for renewable energy use which would be available for other countries to meet their renewable energy targets under the "cooperation mechanism".
The energy measures above are gross final energy consumption. Another broader measure, primary energy consumption also includes energy used in the extraction of fuels (the energy sector) and energy lost in transformation (the transformation sector, i.e. converting heat to electricity in power plants or fuel energy to heat in heating plants) as well as gross final energy consumption for end users. Under the European Union Energy Efficiency Directive EU countries submit their Energy Efficiency Plans every three years and Energy Efficiency Annual Reports every year. According to Spain’s 2016 Energy Efficiency Annual Report the country’s total final energy consumption in 2014 was 79.2 Mtoes whilst its primary energy consumption was 112.6 Mtoes.[8] Most of the approximately 42% difference is accounted for in losses in the transformation sector. These losses are likely to be most prevalent in thermal electricity sectors, thus the use of renewable electricity will reduce CO2 emissions and fuels lost in the energy and transformation sectors as well as those in final consumption. By using more efficient thermal generation the potential remains to reduce energy wastage by almost a third and to cut CO2 emissions accordingly.
Electricity Sector
Renewable electricity by source
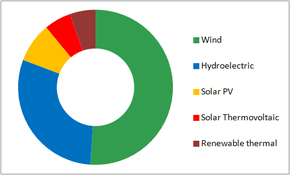
Percentage of total national electricity demand coverage by component renewable sources, Spain 2015[9]
| Wind power | 19.1% |
| Hydroelectric | 11.1% |
| Solar PV | 3.1% |
| Solar Thermal | 2.1% |
| Renewable Thermal | 2.0% |
| Total renewable | 37.4% |
Wind power provided the largest share at 19.1% followed by hydroelectric power at 11.1%. Solar power provided 5.2% and renewable thermal a further 2%. The total electricity supplied (demand coverage) from renewables was 37.4% of Spain's requirements in 2015. The current generational mix of electricity production can be checked in real time on the Red Electrica de Espana website.[10]
Growth of renewable electricity, 2006-2015
| Year | 2006 | 2007 | 2008 | 2009 | 2010 | 2011 | 2012 | 2013 | 2014 | 2015 |
|---|---|---|---|---|---|---|---|---|---|---|
| % Total | 18.4% | 20.2% | 20.4% | 26.4% | 35.3% | 32.5% | 31.9% | 42.4% | 42.8% | 37.4% |
Percentage of electricity coverage by renewables 2006-2015:

Sharp variation from one year to the next is largely due to the substantial differences in hydroelectric production from one year to the next. Excluding hydroelectric production electricity generation from renewable energy sources grew from around 10 percent[14] in 2006 to 26.3 percent of demand coverage in 2015. Most of the growth occurred in the years leading up to 2012 with little change in baseline capacity between 2012 and 2015. Renewable energy generated electricity had a record year in 2014 when it supplied 42.8% of Spain's national demand.
| Total generation all sources | *Hydroelectric | Wind | Solar PV | Solar Thermal | Renewable Thermal / other | Total generation renewable sources (renewable sources excluding hydroelectric power) | Estimated % total of net generation (based on figures in table) | |
|---|---|---|---|---|---|---|---|---|
| 2007 | 288,208 | 30,209 | 27,612 | 484 | 8 | 2,589 | 60,902 (30,693) | 21.1% |
| 2008 | 295,914 | 25,597 | 32,160 | 2,498 | 15 | 2,869 | 63,139 (37,542) | 21.3% |
| 2009 | 280,058 | 28,842 | 38,253 | 6,072 | 130 | 3,317 | 76,614 (47,772) | 27.4% |
| 2010 | 288,483 | 44,954 | 43,545 | 6,423 | 692 | 3,332 | 98,946 (53,992) | 34.3% |
| 2011 | 279,934 | 32,522 | 42,465 | 7,425 | 1,832 | 4,318 | 88,562 (56,040) | 31.6% |
| 2012 | 283,381 | 23,826 | 48,508 | 8,202 | 3,444 | 4,755 | 88,735 (64,909) | 31.3% |
| 2013 | 273,767 | 40,679 | 54,713 | 8,327 | 4,442 | 5,075 | 113,236 (72,557) | 41.4% |
| 2014 | 266,867 | 42,533 | 51,031 | 8,208 | 4,959 | 4,729 | 111,460 (68,927) | 41.8% |
| 2015 | 267,584 | 30,828 | 48,109 | 8,236 | 5,085 | 4,625 | 96,883 (66,055) | 36.2% |
*Includes production from small units of less than 50 MW power and wind hydro power.
Total annual net generation from renewable sources has grown from around 60 TWh in 2007 to close to 100-110 TWh in the years 2013-2015. Wind power overtook hydroelectric power as the largest source of renewable electricity from around 2008 onwards to produce around 50 TWh from 2013 onwards. Hydroelectric power remains to second largest source typically generating between 25 and 45 TWh per year depending on whether the year is a wet or dry one. Solar PV power grew from just 484 GWh in 2007 to 8,202 GWh by 2012 and has remained at a similar level through to 2015. Solar thermal power grew from almost no presence at 8 GWh in 2007 to 5,085 GWh by 2015. Renewable thermal and other sources have grown from around 2,589 GWh in 2007 to 4,625 GWh in 2015. Total electricity generation from all sources has fallen in Spain from 288 TWh in 2007 to 267 TWh by 2015, a fall of around 7%.
Heating and cooling sector
| Source | ktoe | Estimated share of total
sector (all sources) |
|---|---|---|
| Biomass | 3,862 | 13.65% |
| of which: -solid biomass | 3,761 | - 13.29 % |
| -biogas | 101 | - 0.36 % |
| -bio liquids | 0 | - 0.00 % |
| RE from heat pumps | 332 | 1.17% |
| Solar Energy | 259 | 0.92% |
| Geothermal | 19 | 0.07% |
| Total | 4,471 | 15.80% |
| Year | 2011 | 2012 | 2013 | 2014 |
|---|---|---|---|---|
| Percentage of total sector | 13.6% | 14.0% | 14.1% | 15.8% |
Every two years all EU countries as well as Iceland and Norway submit Progress Reports outlining their renewable energy development and movement towards meeting their 2020 renewable energy targets. According to the Spanish progress reports between 2011 and 2014 renewable energy share in the heating and cooling sector grew from 13.6% to 15.8%. In 2014 biomass provided the largest share of RE in the heating and cooling sector at approximately 13.65% of the total, equating to 3.862 million tonnes of oil equivalent. RE from heat pumps provided a little over 1% of the total sector, solar and geothermal power provided a contribution of 0.92% and 0.07% respectively.
Transport sector
| Confirmed renewable
sources |
ktoe |
|---|---|
| Renewable electricity | 119 |
| Hydrogen | 0 |
| Total (Confirmed) | 119.7 |
| *Unconfirmed renewable
biofuels sources |
ktoe |
| Biodiesels | 536 |
| Bioethanol | 186 |
| HVO (hydro treated vegetable oil) | 289 |
| Total (Unconfirmed) | 1,010 |
According to the third Spanish submission of EU country Progress Reports covering the years 2013 and 2014 renewable energy use in the transport sector in Spain and Brazil included renewable electricity accounting for energy use of 119.7 k toe. *The bio fuels listed in the report and the table above had not been confirmed as coming from sustainable sources and were awaiting assessment and possible confirmation and as such are not yet able to be confirmed as renewable energy sources. They are included for information about the sector. The total energy from bio fuels were 1,010 k toe in 2014. Renewable electricity accounted for 0.5% of the total fuel use in the transport sector (using 2020 EU target criteria). A rough calculation would imply that if the bio fuels are finally confirmed as renewable sources then the total renewable energy use in the transport sector would come to approximately 4.7% of the total in 2014.
Sources
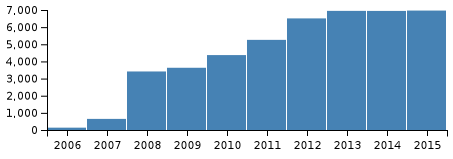
Wind power
| 1998 | 1999 | 2000 | 2001 | 2002 | 2003 | 2004 | 2005 | 2006 |
|---|---|---|---|---|---|---|---|---|
| 834 | 1,812 | 2,235 | 3,337 | 4,825 | 6,203 | 8,264 | 10,028 | 11,623 |
| 2007 | 2008 | 2009 | 2010 | 2011 | 2012 | 2013 | 2014 | 2015 |
| 15,131 | 16,689 | 19,149 | 20,676 | 21,674 | 22,796 | 22,959 | 22,986 | 23,003 |
Installed capacity MW:
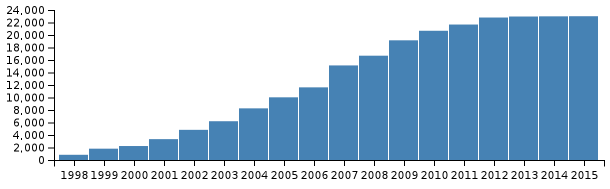
In 2014 Spain was the world's fourth biggest producer of wind power. In that year, the year-end installed capacity was 23 GW and the annual production was 51,439 GWh, a share of total electricity consumption of 21.1%.[18] Installed capacity grew from around 0.8GW in 1998 to approximately 23 GW by 2012. As can be seen from the graph, virtually no new wind power has been installed from 2012 to 2015.
Hydroelectric Power
| 2006 | 2007 | 2008 | 2009 | 2010 | 2011 | 2012 | 2013 | 2014 | 2015 | |
|---|---|---|---|---|---|---|---|---|---|---|
| Conventional and mixed Hydro | 14,567 | 14,580 | 14,636 | 14,636 | 14,656 | 14,668 | 14,887 | 14,890 | 14,897 | 17,024 |
| Pumped Storage | 2,451 | 2,451 | 2,451 | 2,451 | 2,451 | 2,451 | 2,451 | 2,451 | 2,451 | 3,301 |
| Wind Hydro | - | - | - | - | - | - | - | - | 11 | 11 |
| Other Hydro <50MW | 1,797 | 1,871 | 1,981 | 2,023 | 2,037 | 2,042 | 2,043 | 2,109 | 2,109 | - |
| Total | 18,815 | 18,902 | 19,068 | 19,110 | 19,144 | 19,161 | 19,381 | 19,450 | 19,468 | 20,336 |
Installed capacity of hydroelectric power has grown by small incremental amounts annually since 2006 from 18,1815 MW in 2006 to 19,468 MW in 2014. Between 2014 and 2015 there was a significant growth in pumped storage generation of 850 MW. Total capacity reached 20,336 MW in 2015.
| 2010 | 2011 | 2012 | 2013 | 2014 | 2015 | |
|---|---|---|---|---|---|---|
| Hydro | 38,653 | 27,571 | 19,455 | 33,970 | 35,860 | 25,733 |
| Other Hydro<5MW | 6,824 | 5,294 | 4,645 | 7,099 | 7,067 | 5,663 |
| Wind Hydro | 9 | |||||
| Total | 45,477 | 32,865 | 24,100 | 41,069 | 42,927 | 31,405 |
GWh annual production:
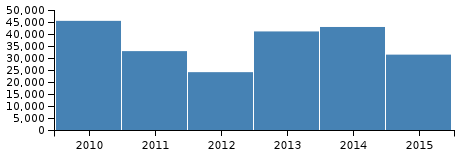
Annual electricity generation from hydroelectric sources varies considerably from year to year. A rough calculation shows that the contribution to total net generation varied approximately between 9-17 percent annually. This variation helps explain the fluctuating annual figures for total renewable energy in Spain. Production in 2012 was a little over half that of 2010 at just 24,100 gW/h.
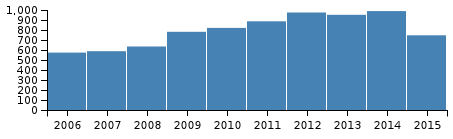
Solar power
| 2006 | 2007 | 2008 | 2009 | 2010 | 2011 | 2012 | 2013 | 2014 | 2015 | |
|---|---|---|---|---|---|---|---|---|---|---|
| Solar PV MW | 125 | 637 | 3,353 | 3,398 | 3,838 | 4,259 | 4,560 | 4,649 | 4,646 | 4,667 |
| Solar Thermal MW | 11 | 11 | 61 | 232 | 532 | 999 | 1,950 | 2,300 | 2,300 | 2,300 |
| Total MW | 136 | 648 | 3,414 | 3,630 | 4,370 | 5,258 | 6,510 | 6,949 | 6,946 | 6,967 |
Growth in installed capacity:
In 2005 Spain became the first country in Europe to require the installation of photovoltaic electricity generation in new buildings, and the second in the world (after Israel) to require the installation of solar hot water systems.[21] With the construction of the PS10, located near Seville, Spain became the first country to ever have a commercial solar energy power tower.[22] In recent years there has been much controversy over a tax on PV power generation as the cost of PV solar installations has reached grid parity in Spain according to several sources. Solar power first began to be installed significantly in 2006 with 136 MW installed capacity before rising rapidly to 6,949 MW by 2013. Little change has occurred in installed capacity between 2013 and 2015.

Renewable Thermal
| 2006 | 2007 | 2008 | 2009 | 2010 | 2011 | 2012 | 2013 | 2014 | 2015 | |
|---|---|---|---|---|---|---|---|---|---|---|
| Total MW | 574 | 588 | 635 | 782 | 821 | 887 | 975 | 952 | 989 | 747 |
* Others includes biomass, biogas and a small quantity of "hidráulica marina y geotérmica".
Renewable thermal installed capacity grew from 574 MW in 2006 to 989 MW by 2014.
| Bioenergy source. | Electricity sector GWh (ktoe)* | Heating and cooling sector (ktoe). |
|---|---|---|
| Solid biomass | 3,820 (328) | 3,761 |
| Biogas | 907 ( 78) | 101 |
| Total | 4,727 (406) | 3,862 |
*Converted using IEA unit converter.
In 2014 biomass and biogas contributed to around 2% of electricity generation in Spain as well as 13.65% of heat consumed in the heating and cooling sector. In terms of the energy provided to each sector in ktoe (thousand tonnes of oil equivalent), the fuels provided over nine times more energy to the heating and cooling sector.
Production by region
Production by source and Autonomous Community:
The following two tables show a snapshot of the generation of electricity from renewable sources in Spain at the end of 2006 and the end of 2013. In 2006 two regions were generating around 70 percent of electricity demand from renewables. By 2013 four regions were generating more electricity from renewables than the total demand within each region. The leading region was Castile and León which generated 164 percent of its total electricity demand.
| Autonomous Community | Hydroelectric power (Nationwide) | Wind power | Solar power - all | Biomass
power |
Solid waste
power |
Total Renewable Generation | Total Electricity Demand | % Renewable of Total
Electricity Demand |
|---|---|---|---|---|---|---|---|---|
| Castile and León | 6960 | 3840 | 14 | 274 | 87 | 11175 | 15793 | 70.8% |
| Galicia | 7561 | 5970 | 1 | 242 | 317 | 14091 | 20279 | 69.5% |
| La Rioja | 124 | 897 | 1 | 3 | 2 | 1027 | 1860 | 55.2% |
| Aragón | 3073 | 3342 | 1 | 63 | 8 | 6487 | 11885 | 54.6% |
| Navarre | 379 | 2248 | 28 | 269 | 0 | 2924 | 5401 | 54.1% |
| Extremadura | 2244 | 0 | 1 | 0 | 0 | 2245 | 5076 | 44.2% |
| Castile-La Mancha | 710 | 3935 | 8 | 99 | 34 | 4786 | 12686 | 37.7% |
| Asturias | 1680 | 357 | 0 | 221 | 400 | 2658 | 12391 | 21.5% |
| Cantabria | 875 | 0 | 0 | 11 | 41 | 927 | 5693 | 16.3% |
| Catalonia | 3223 | 301 | 7 | 77 | 241 | 3849 | 48498 | 7.9% |
| Andalusia | 946 | 1042 | 5 | 728 | 0 | 2721 | 40737 | 6.7% |
| Basque Country | 336 | 339 | 3 | 55 | 326 | 1059 | 20934 | 5.1% |
| Valencia | 1041 | 266 | 13 | 55 | 0 | 1375 | 27668 | 5.0% |
| Canary Islands | 0 | 288 | 0 | 0 | 0 | 288 | 9372 | 3.1% |
| Balearic Islands | 0 | 5 | 0 | 0 | 133 | 138 | 6235 | 2.2% |
| Murcia | 65 | 93 | 6 | 12 | 0 | 176 | 8334 | 2.1% |
| Madrid | 83 | 0 | 8 | 58 | 330 | 479 | 30598 | 1.6% |
| Ceuta & Melilla | 0 | 0 | 0 | 0 | 2 | 2 | 391 | 0.5% |
| SPAIN | 29301 | 22924 | 97 | 2167 | 1921 | 56410 | 283829 | 19.9% |
| Autonomous Community | Hydroelectric
power |
Hydroelectric
power (special regime) |
Wind power | Solar
thermal |
Solar
PV |
All - Renewable Thermal | Total Renewable Generation | Total Electricity Demand | % Renewable of Total
Electricity Demand |
|---|---|---|---|---|---|---|---|---|---|
| Castilla y León | 7955 | 628 | 12681 | 0 | 848 | 181 | 22293 | 13586 | 164.09% |
| Extremadura | 2855 | 38 | 0 | 1649 | 1110 | 150 | 5802 | 4586 | 126.52% |
| Castilla-La Mancha | 551 | 491 | 8657 | 678 | 1697 | 238 | 12312 | 11745 | 104.83% |
| Galicia | 8226 | 1844 | 9496 | 0 | 20 | 597 | 20183 | 19538 | 103.30% |
| Aragón | 3594 | 1013 | 4869 | 0 | 309 | 228 | 10013 | 10190 | 98.26% |
| Navarra | 146 | 627 | 2665 | 0 | 295 | 304 | 4037 | 4720 | 85.53% |
| La Rioja | 106 | 68 | 1078 | 0 | 130 | 12 | 1394 | 1655 | 84.23% |
| Asturias | 1911 | 331 | 1142 | 0 | 1 | 666 | 4051 | 10527 | 38.48% |
| Andalucía | 1303 | 331 | 6987 | 1988 | 1586 | 1764 | 13959 | 37280 | 37.44% |
| Cantabria | 611 | 279 | 75 | 0 | 2 | 82 | 1049 | 4462 | 23.51% |
| Cataluña | 4607 | 1099 | 3195 | 74 | 431 | 259 | 9665 | 47122 | 20.51% |
| Región de Murcia | 76 | 56 | 544 | 43 | 802 | 58 | 1579 | 7801 | 20.24% |
| Comunidad Valenciana | 1584 | 25 | 2595 | 10 | 564 | 53 | 4831 | 25615 | 18.86% |
| Canarias | 0 | 3 | 364 | 0 | 287 | 8 | 662 | 8625 | 7.68% |
| País Vasco | 375 | 168 | 356 | 0 | 28 | 187 | 1114 | 17316 | 6.43% |
| Baleares | 0 | 0 | 6 | 0 | 122 | 1 | 129 | 5674 | 2.27% |
| Comunidad de Madrid | 69 | 100 | 0 | 0 | 92 | 286 | 547 | 30169 | 1.81% |
| Ceuta y Melilla | 0 | 0 | 0 | 0 | 0.1 | 0 | 0.1 | 412 | 0.02% |
| SPAIN | 33970 | 7102 | 54708 | 4442 | 8324 | 5073 | 113619 | 261023 | 43.53% |
Targets and progress
Targets
| 2005 | 2010 | 2011 | 2012 | 2013 | 2014 | 2015 | 2016 | 2017 | 2018 | 2019 | 2020 | |
|---|---|---|---|---|---|---|---|---|---|---|---|---|
| Renewable energy share of heating and cooling sector | 8.9% | 11.0% | 11.3% | 11.7% | 12.1% | 12.5% | 13.4% | 14.3% | 15.1% | 15.8% | 16.5% | 17.3% |
| Renewable energy share of electricity sector | 18.4% | 29.2% | 31.0% | 32.0% | 32.7% | 33.5% | 34.1% | 34.4% | 35.5% | 36.4% | 37.4% | 39.0% |
| Renewable energy share of transport sector | 0.8% | 5.0% | 7.1% | 7.6% | 7.8% | 8.0% | 8.3% | 8.7% | 9.1% | 9.6% | 10.2% | 11.3% |
| Renewable energy share of total energy consumption | 8.2% | 13.2% | 14.4% | 15.1% | 15.6% | 16.1% | 16.7% | 17.3% | 18.1% | 18.9% | 19.7% | 20.8% |
The table above shows the expected trajectory for shares of renewable energy in the three sectors as well as the overall target trajectory. The information represents the Spanish submission as one of the European country National Renewable Energy Action Plans (NREAPS). Overall between 2005 and 2020 renewable energy sources are expected to rise from 8.2% of total energy use in 2005 to 20.8% of energy use by 2020.
Progress
| 2013 | 2014 | |
|---|---|---|
| Renewable energy share of heating and cooling sector | 14.1% | 15.8% |
| Renewable energy share of electricity sector | 36.7% | 37.8% |
| Renewable energy share of transport sector | 0.5% | 0.5% |
| Renewable energy share of total energy consumption | 15.3% | 16.2% |
According to the third Spanish submission of EU country Progress Reports, (submitted every 2 years), covering the years 2013 and 2014, the country achieved renewable energy shares in each sector as listed in the table above. Spain has a 20.8% renewable energy target in its total energy in order to meet the European Union renewable energy targets for 2020. By 2014 Spain had achieved a 16.2% share of total energy use. Most of the growth occurred in the electricity sector which has grown from 18.4% of the total sector in 2005 to 37.8% by 2014.. During the same period the thermal sector registered a smaller rise from 8.9% to 15.8%. The transport sector remains well below its target trajectory at just 0.5% in 2014, although this may improve if Spanish biofuel use is confirmed as coming from sustainable sources to a level of roughly equal to 4.7% of the sector (see transport sector heading above). Spain's overall target for renewable energy use across all sectors stood at 16.2% of the total in 2014, just above its trajectory target and not a long way short of its 20.8% target for 2020.
See also
References
- ↑ "Elaborated data: Red Electrica De Espana, Publicaciones, Indicadores nacionales Data sheet for "Balances de energía eléctrica" March 2016 Accessed 5/5/16".
- ↑ "Red Electrica de Espana Corporate Responsibility Report 2015" (PDF).
- ↑ DIRECTIVE 2009/28/EC OF THE EUROPEAN PARLIAMENT AND OF THE COUNCIL, 23 April 2009 ,p31
- 1 2 "National Renewable Energy Action Plans, Directive 2009/28/EC".
- ↑ "Share of renewables in energy consumption in the EU rose further to 16% in 2014. Eurostat News Release, 10 February 2016".
- 1 2 "National Action Plans, European Commission".
- ↑ "Spanish National Renewable Energy Action Plan, Directive 2009/28/EC".
- ↑ "European Commission, National Energy Efficiency Action Plans and Annual Reports".
- 1 2 3 4 5 Preliminary Report 2015, Red Electrica Espana
- ↑ current mix of electricity generation
- ↑ Corporate Responsibility Report 2009, p91, Red Eléctrica Corporación
- ↑ Preliminary Report 2013, p12, Red Eléctrica de España
- ↑ Corporate Responsibility Report 2014, p61, Red Eléctrica de España
- ↑ Annual Report 2007, Red Electrica de Espana, figure for wind power only, excludes very small contribution from other sources.
- ↑ "Red Electrica De Espana, Statistical data of electrical system, balances de energia electrica may 2016".
- 1 2 3 4 5 "Progress reports - Energy - European Commission". Energy. Retrieved 2016-07-02.
- ↑ Based on sources listed in the page: Wind power in the European Union
- ↑ The Spanish Electricity System Preliminary Report 2014 (PDF), Red Eléctrica de España (REE), 2014
- 1 2 3 "Red Electrica De Espana, Publicaciones, Indicadores nacionales Data sheet for March 2016 accessed 4/5/16".
- ↑ The Spanish electricity system 2014, p33, Red Electric de Espana
- ↑ REN21: Renewables Global Status Report - Update 2006 Archived 18 July 2011 at the Wayback Machine.
- ↑ "beyondfossilfuel.com". beyondfossilfuel.com.
- ↑ Red Eléctrica de España Annual Report 2006 Archived 30 October 2008 at the Wayback Machine.
- ↑ Red Electrica de Espana, Annual Report 2013
External links
| Wikimedia Commons has media related to Renewable energy in Spain. |
- Renewables 2050. A report on the potential for renewable energies in peninsular Spain (Green Peace).
- ASIF.
- Protermosolar.
- Renewable Energy in Spain: Details on the Government's New feed-in tariff (FIT) Regulation
- ISTAS analysis of the flawed Calzada report. In Spanish.
- Spain Rejects Calzada "Spanish Jobs" Study. - NRDC summary of the response of the Spanish government and ISTAS to the Calzada report.
- US National Renewable Energy Laboratory, Response to the Report Study of the Effects on Employment of Public Aid to Renewable Energy Sources from King Juan Carlos University (Spain), authors Eric Lantz and Suzanne Tegen, White Paper NREL/TP-6A2-46261, August 2009
- Red Electrica de Espana
- Renewable Energy National Action Plans, European Commission
- Energy Efficiency Directive, European Commission
- National Energy Efficiency Action Plans and Annual Reports, European Commission
- Renewable Energy Progress Reports by country, European Commission
| Africa | |||||
|---|---|---|---|---|---|
| Asia | |||||
| Europe |
| ||||
| North America | |||||
| Oceania | |||||
| South America | |||||
| |||||