Renewable energy in Denmark
| Renewable Energy in Denmark | |
|---|---|
 | |
| Renewable Energy (RE) | |
| RE as % of Gross Final energy consumption. | 29.2% (2014) |
| Target for above. | 30.0% (2020) |
| Renewable Electricity | |
| Percentage of Electricity generated by RE. | 60.4% (2015) |
| RE generated / Total electricity generation. | 17,562 / 30,615 GWh (2014) |
| Record % RE covered electricity consumption | 138.7% (26/7/15 wind only) |
| Installed capacity (2014) | |
| Wind Power. | 4.9 GW |
| Bio Energy. | 1 GW (ex waste) |
| Solar Power. | 0.6 GW |
| Hydro Power. | <0.01 GW |
| Total | approx 6.5 GW |
| Country Notes | |
| |
| |
| |
| |
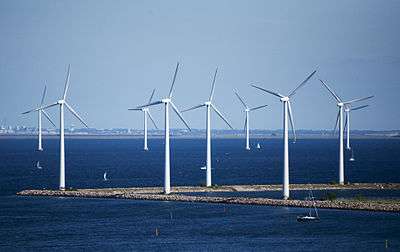
Denmark is a world leading country in wind energy production and wind turbine production. In 2014 Denmark produced 57.4% of its net electricity generation from renewable energy sources.[1] The Danish wind company Vestas Wind Systems A/S has expanded from its domestic base and by 2015 had a revenue of €8.423 billion, with more than 18,000 employees globally and manufacturing plants in Denmark, Germany, India, Italy, Romania, the United Kingdom, Spain, Sweden, Norway, Australia, China, and the United States (see Vestas link above for sources). Wind power alone produced 42.7% of Denmark's electricity production in 2014 and is expected to increase its production by nearly 80% in the years to 2024.
Denmark has a target of producing 30% of all its energy needs from RE energy sources by 2020, a considerable increase from the 17% it attained in 2005.[2] By 2014 this figure had already reached 29.2%[3] and was the fifth highest amongst the EU-28 countries. The country has ambitious renewable energy goals for the future, including using renewable energy for 100% of its energy needs in all sectors including transport by 2050.
In the heating sector the country has long used and continues to develop district heating (DH) networks. Hot water or steam is produced centrally and then distributed through a network of insulated pipes to high population areas. Houses within a district heating area have heat exchangers installed instead of boilers for their heating and hot water requirements. The heat exchanger keeps the two water systems separate and means that heat can be adjusted as with a familiar domestic boiler. One simple but important innovation in the district heating network was the development of internally insulated pipes. The two pipes taking and receiving the return of water are placed inside a much larger pipe and insulating material is set so as to fill the figure eight shaped void between the two smaller and the large pipe. In 2013 district heating supplied over 60% of all households in Denmark with heating and hot water.[4] The development of district heating technology has led Denmark to become a world leader in industrial pump and thermostat designs and its products are used in many industries worldwide.
Cogeneration is also widely used. This is a process that extracts the waste heat produced when generating electricity. Power stations designed to do this are known as Combined Heat and Power (CHP) stations. CHP stations in Denmark are often sized to provide the heat required for the local district heating system. Thus CHP stations produce both electricity for the grid and heat for district heating systems. Heat can be stored in large industrial hot water tanks for several days allowing electricity and heat supply to be provided time independently from each other. By 2013 the use of CHP stations had reduced the overall energy consumption in Denmark by 11%.[4]
Danish electricity generation has become increasingly decentralised with a move away from production in the large central power stations to many smaller, locally based and mostly CHP stations. Many of these smaller stations use locally sourced bio energy sources including straw and wood pellets.
Energy consumption and objectives.
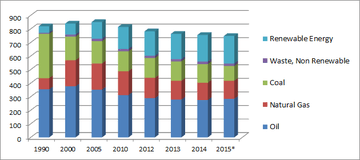
| Unit: PJ | 1990 | 2000 | 2005 | 2010 | 2012 | 2013 | 2014 | 2015* |
|---|---|---|---|---|---|---|---|---|
| Total | 819 | 839 | 850 | 814 | 782 | 763 | 755 | 747 |
| Oil | 355 | 376 | 352 | 312 | 289 | 278 | 276 | 284 |
| Natural Gas | 82 | 192 | 192 | 176 | 149 | 138 | 127 | 133 |
| Coal | 327 | 175 | 166 | 147 | 146 | 143 | 137 | 108 |
| Waste, Non Renewable | 8 | 14 | 17 | 16 | 17 | 17 | 18 | 18 |
| Total Renewable Energy (PJ) | 48 | 81 | 123 | 163 | 180 | 186 | 196 | 203 |
*Preliminary data. 2015 data adjusted for climate variation and fuels for net electricity exports.
Renewable energy consumption more than quadrupled from 48 PJ in 1990 to 203 PJ in 2015. Whilst renewable energy consumption was rising between 1990 and 2013 gross energy consumption actually fell by 7%.[6] Most of the fall can be attributed to a great increase in combined power and heat generation (CHP) and the growth in wind power. This has increased energy conversion efficiency, reducing conversion losses by 28% or 7% relative to gross energy consumption.[6] Put simply smaller and decentralised CHP plants use fuels far more efficiently than older centralised power plants, and wind power has no fossil fuel to waste. Thus the growth of these two sources (10% during the period)[6] has displaced fossil fuels by more than a one-to-one ratio. The use of Biofuels in local CHP plants has further displaced fossil fuel consumption. The figures in the table above show that whilst the reduction in fossil fuel use has been most pronounced in coal use, there has also been a significant reduction in oil and natural gas usage since 2000. Oil has fared better than the other fuels because it still dominates usage in the transport sector and alternative fuels and transport solutions are not yet widely deployed. The Danish Government has introduced the following targets for national energy policy:[7]
- Eliminating coal from power production by 2030.
- Providing all electrical and heating from renewable sources by 2035.
- Providing 100% of Denmark's energy requirements in electricity, heating and transport from renewable sources by 2050.
Energy consumption by sector
Projected total gross final energy consumption by sector in 2020.
All EU countries as well as Iceland and Norway submitted National Renewable Energy Action Plans (NREAPs)[8] to outline the steps taken, and projected progress by each country between 2010 and 2020 to meet the Renewable Energy Directive. Each plan contains a detailed breakdown of each country's current renewable energy usage and plans for future developments. According to projections by the Danish submission in 2020 the gross final energy consumption in Denmark by sector breaks down as follows:
| Projected energy use by sector in 2020[8] | ktoe | RE 2020 target |
|---|---|---|
| Heating and cooling | 7,653 | 39.8% |
| Electricity | 3,247 | 51.9% |
| Transport | 5,520 | 10.1% |
| Gross final energy consumption* | 16,419 | 30.0% |
Almost half of energy consumption (46.6%) is used in the heating and cooling sector. The heating and cooling sector (also known as the thermal sector) includes domestic heating and air conditioning, industrial processes such as furnaces and any use of heat generally. The next largest share is the transport sector at 33.6%, followed by the electricity sector at 19.8%. Total annual energy consumption is projected to be 16,419 ktoe (16.4 million tonnes of oil equivalent) by 2020. In order to meet Denmarks overall target for 30% use of renewable energy in Gross final energy consumption (4,904 ktoes) by 2020 (it was just 17% in 2005) targets have been set for each sector. Renewable energy use is expected to be 39.8% in the heating and cooling sector, 51.9% in the electricity sector and 10.1% in the transport sector.
The energy measures above are gross final energy consumption. Another broader measure, primary energy consumption also includes energy used in the extraction of fuels (the energy sector) and energy lost in transformation (the transformation sector, i.e. converting heat to electricity in power plants or fuel energy to heat in heating plants) as well as gross final energy consumption for end users. In 2013 Denmark’s total final energy consumption was 607 PJ whilst its primary energy consumption was 763 PJ.[9] Most of the approximately 25% difference is accounted for in losses in the transformation sector. These losses are likely to be most prevalent in thermal electricity sectors, thus the use of renewable electricity will reduce CO2 emissions and fuels lost in the energy and transformation sectors as well as those in final consumption. Denmark is one of the world’s most fuel efficient countries and the difference between the two measures is smaller than many other countries.
Electricity sector
Production by source
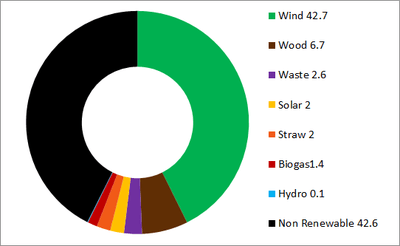
| SOURCE | Share of total generation |
|---|---|
| Wind | 42.7% |
| Wood | 6.7% |
| Waste | 2.6% |
| Solar | 2.0% |
| Straw | 2.0% |
| Biogas | 1.4% |
| Hydro | 0.1% |
| Total (renewable sources) | 57.4% |
| Total (non-renewable sources) | 42.6% |
| Total (all sources) | 100.0% |
In 2014 wind energy produced 42.7 percent of Denmark's net electricity generation, the largest share from any source and larger than non renewable generated electricity. Biofuels (wood, straw and biogas) and the biodegradable part of waste provided the next largest RE source at 12.7% of national generation. Solar power has grown significantly in recent years from a low base and provides a further 2% share.Hydroelectricity provided just 0.1% of net national generation but the country maintains strong links to its neighboring countries large hydroelectric reserves. Fossil fuels and other non renewable sources accounted for just 42.6% of Denmarks total net generation and continues to decline. Total RE generated electricity accounted for 57.4% of Denmark’s net national electricity generation in 2014.
Growth of electricity generated by renewables
| Total electricity generation* | Land based wind turbines | Offshore wind turbines | Photovoltaics | Hydopower** | Biofuels | Waste | Thermal generation from RE fuels*** | Total renewable generation | % of National generation | |
|---|---|---|---|---|---|---|---|---|---|---|
| 2007 | 37,024 | 5,800 | 1,370 | 30 | 1,936 | 1,570 | 3,192 | 10,392 | 28.1% | |
| 2008 | 34,649 | 5,453 | 1,524 | 27 | 1,920 | 1,672 | 3,257 | 10,261 | 29.6% | |
| 2009 | 34,290 | 5,046 | 1,664 | 20 | 2,117 | 1,551 | 3,029 | 9,759 | 28.5% | |
| 2010 | 36,618 | 5,122 | 2,686 | 21 | 3,313 | 1,467 | 4,176 | 12,005 | 32.8% | |
| 2011 | 33,210 | 6,360 | 3,405 | 18 | 3,025 | 1,502 | 3,851 | 13,634 | 41.1% | |
| 2012 | 29,025 | 6,796 | 3,472 | 104 | 18 | 3,143 | 1,440 | 3,935 | 14,325 | 49.4% |
| 2013 | 32,956 | 6,772 | 4,351 | 518 | 15 | 3,220 | 1,411 | 3,996 | 15,652 | 47.5% |
| 2014 | 30,615 | 7,913 | 5,165 | 597 | 16 | 3,078 | 1,441 | 3,871 | 17,562 | 57.4% |
* excludes internal consumption by plant. ** figures in italics include photovoltaics. *** includes biofuels and biodegrable fraction of waste.
| RE terminology |
|---|
| What is happening in countries around the world? |
| Installed capacity:
The maximum power that can be generated under ideal conditions when a plant is supplied with wind, sun or fuel. 1 kW = App. power of a 1 bar electric fire. 1 MW = 1000 kW 1 GW = 1000 MW 1 TW = 1000 GW GWe is GW of electricity, GWth is GW of thermal (heat). Electricity used / produced: 10 kWh = 1 kW x 10 hours or 2 kW x 5 hours 100 GWh = 100GW x 1 hour or 25GW x 4 hours How many households does 1MW of wind / solar provide electricity for? 1 Onshore wind turbine rated 2.2 MW 1,202 households (EU)* App. 546 households per 1 MW, (546,000 per GW) 1 Offshore wind turbine rated 3.6 MW 3,312 households (EU) * App. 920 households per 1MW, (920,000 per GW) 5MW Solar PV power 1515 households (UK)** App. 303 households per 1MW, (303,000 per GW) Sources: *Emea.org **Solar Trade Organisation |
The proportion of total Danish electricity generated by renewables rose between 2007 and 2014 from 28.1% to 57.4%. Total renewable electricity generation grew from 10,392 GWh in 2007 to 17,562 GWh by 2014, a rise of 69%. Since 2007 most of the growth in RE electricity generation continues to be the result of growing wind power generation (accounting for +56.9% of total generation growth), thermal generation from RE fuels added an additional 6.5%, Solar power has also made an impact as a new power source of an additional 597 GWh (5.7%) since 2012.
Reduction in fossil fuel generated electricity
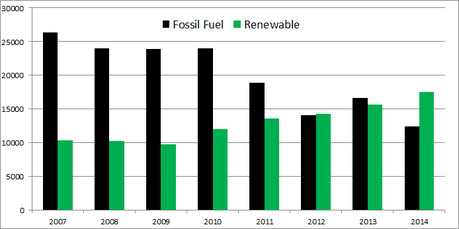
Renewable energy generation in Denmark increased from 10,392 GwH to 17,562 GWh between 2007 and 2014.[1][11][12][13][14] Fossil fuel generation fell from 26,318 GWh to 12,405 GWh in 2014.[1][11][12][13][14] Electricity generated from renewables first exceeded electricity from fossil fuels in 2012 and again in 2014.
So how does a country which generates the largest share of its electricity needs from wind power cope on calm windless days? Denmark sees this challenge as an opportunity to develop new solutions and in so doing is transforming its energy sector and upgrading its technological and engineering capability and is now exporting these worldwide. One of the ways the country manages is by exporting electricity on days when wind production is very high (Some days Denmark produces more electricity from wind power alone then the entire country requires). Much of the power is exported and stored in Norwegian and Swedish hydroelectric systems via the system of pumped storage (storing power for future use by pumping reservoir levels up higher). On calm days the power can be reimported. The country also imports and exports electricity to Germany and across the Nordic region which moves power to where it is most in demand given production conditions on each day. As electricity can be transported thousands of kilometres with only a few percentage point transmission losses the load and variability can be spread across a wider and more stable geographic area. These long distance transmission lines are being upgraded across both the Nordic region and more widely across Europe.
The country has also developed power plants which can increase their output much more rapidly than traditional ones to respond to fluctuating production from wind sources. Many of these plants are the many smaller and dispersed CHP power plants across the country. The production and dispersion of electricity across Denmark, the Nordic region and Germany can be viewed in real time on the Energinet.dk website. The site illustrates wind and power production, electricity imports and exports, and the contribution made by CHP plants to both district heating and stabilising electricity production. The link to this site is here Energinet.dk.
Heating and cooling sector
| Source | Tj/year | Estimated share of total
sector (all sources) |
|---|---|---|
| Biomass | 99,082 | 35.33% |
| of which: -solid biomass | 96,075 | - 34.26 % |
| -biogas | 2,320 | - 2.15 % |
| -bio liquids | 686 | - 0.24 % |
| RE from heat pumps | 7,294 | 2.60% |
| Solar | 1,224 | 0.44% |
| Geothermal | 83 | 0.03% |
| Total | 107,683 | 38.40% |
| 2009 | 2010 | 2011 | 2012 | 2013 | 2014 | |
|---|---|---|---|---|---|---|
| Share of sector | 29.56% | 30.64% | 31.77% | 33.32% | 35.52% | 38.40% |
According to the energy Progress Reports submitted by EU member states (as well as Norway and Iceland) to the European Commission, by 2014 renewable energy provided 38.4% of the energy consumed in the heating sector.[16] RE in the heating sector is overwhelmingly provided by biomass, including straw, wood, bio-oil and biodegradable waste producing about 35% of the sector’s total consumption. The next largest share was provided by heat pumps at around 2.6% of the total. Solar thermal produced just under a half percentage share whilst geothermal heat produced a trace contribution. Renewable energy in the heating sector consists of sources consumed independently as well as their contribution to district heating networks. In 2008 about 40% of households gross final energy consumption for domestic heating came from district heating and 65% of consumption for the heating of commercial and public sector buildings.[17] By 2013 the figure for households using district heating had grown to 60%.
In 2014 combined heat and power plants produced 68.7% of the heat for district heating networks in Denmark (as well as 61% of electricity power produced by thermal plants). In the same year biomass, waste and biogas provided the fuel for 18.3%, 20.8% and 0.9% of heat produced in CHP plants, in heat only plants the figurse were 13.1%, 2% and 0.3% respectively whilst bio oil provided 0.6% of heat.[18] Solar thermal, heat pumps and electric boilers also provided heat only plants with 0.6% and 0.4% of their production.
The 2009 NREAP[19] report identified new and ongoing ways to promote the use of renewable energy in the heating and cooling sector and amongst these included the following. Tax exemption for RE heating and cooling producers. Building regulations and information initiatives were identified to increase energy efficiency across targeted at both the building sector and consumers both public and private. Regulations governing the energy efficient cooling of buildings under local authority control has been in place since 2008. A scrappage scheme for those using oil fired boilers to run central heating was planned for March 2010 to reduce CO2 output and increase the take up of district heating and RE installations. Building regulations were in force to promote energy savings.
Transport sector
| Source | Tj/year | Estimated share of total
sector (all sources). |
|---|---|---|
| Biodiesel | 7,063 | 4.17% |
| Bioethanol | 1,872 | 1.10% |
| Renewable electricity | 673 | 0.40% |
| Hydrogen | 0 | 0.00% |
| Total | 9,608 | 5.67% |
| 2009 | 2010 | 2011 | 2012 | 2013 | 2014 | |
|---|---|---|---|---|---|---|
| Share of sector | 0.24% | 0.26% | 3.76% | 5.80% | 5.59% | 5.67% |
In 2014 renewable energy provided 5.67% of total final energy consumption in the transport sector. The largest source was from biodiesel followed some by bioethanol. Renewable electricity also made a contribution to the sector but this was smaller in 2014 than those from biofuels. In 2008 the government’s “Green Transport” proposal announced that the upward trend in CO2 emissions from transport must be halted. The political agreement “A Green Transport Policy” proposed measures to reduce emissions including the strengthening of public transport and encouraging greater utilisation and efficiency of existing vehicles. Preparations were made for a greener approach to vehicle taxation, including tax exemption for electric vehicles up to 2015. The Ministry for Transport also established the “Centre for Green Transport” to carry out research into energy efficient transport solutions. The EDTTP act was also cited as having established the Energy Technology Development and Demonstration Programme to research into solutions including biofuels and intelligent electricity.
According to the 2009 NREAP[19] report biofuels were expected to provide the main source of RE in the transport sector rising from 1.3 PJ in 2010 to 10.9PJ in 2020. Renewable electricity was expected to make up the minor share rising from 0.5 PJ to 1.2PJ over the period for use in electric vehicles and trains.
Total electric vehicle sales in Denmark in 2015 were 4,762 units representing 2.29% of total car sales[20] with the TESLA model S having a surge of sales at 2,736 units in a rush to beat tax exemptions.
Sources
Wind power
| Land based wind turbines | Offshore wind turbines | Total wind power | |
|---|---|---|---|
| 2007 | 5,800 | 1,370 | 7,170 |
| 2008 | 5,453 | 1,524 | 6,977 |
| 2009 | 5,046 | 1,664 | 6,710 |
| 2010 | 5,122 | 2,686 | 7,808 |
| 2011 | 6,360 | 3,405 | 9,765 |
| 2012 | 6,796 | 3,472 | 10,268 |
| 2013 | 6,772 | 4,351 | 11,123 |
| 2014 | 7,913 | 5,165 | 13,078 |
Electricity generated by wind power in Denmark rose from 7,170 GWh in 2007 to 13,078 GwH in 2014. Offshore wind power has been growing in importance, rising from 19.1% of total wind production in 2007 to 34.5% of production by 2014. Denmark was the world's leading windpower country in 2014 by percentage of demand coverage at 39% of Danish electricity consumption.[21]
Ambitious plans for future development include increasing production from the 13.1 TWh produced in 2014 to 23.3 TWh by 2024, which would raise demand coverage from 39% to 61% over the period.[21] Offshore and nearshore windpower is expected to grow quicker than land based wind power to reach almost parity with land based production by 2024 (49%).[21]
Denmark often produces more electricity from windpower than the entire country requires and will export it for sale or for storage in hydroelectric dams in Norway and Sweden. Occasionally electricity prices turn negative for producers when there is a glut of electricity production and lack of demand abroad as well. One result of this has been the growth of electric boilers being installed in district heating plants.[22] When there is an excess of electricity the plants can use cheap electricity to heat the hot water instead of finite bio or fossil fuels. As wind production rises the problem of too much electricity being generated will also give rise to new challenges and solutions. Electric heating and cooling can also be used in the form of more efficient heat pumps to mop up excess electricity supply. The electricity sector will in effect expand into the heating and cooling sector to displace current energy sources.
Renewable thermal
RE thermal generation includes electricity generated from biofuels and electricity generated from the fraction of waste that is biodegradable. Since 2010 RE thermalgeneration in Denmark has accounted for approximately 4000 GWh per year.[1][13][14]
Biofuels also play an increasingly important part in district heating. The proportion of heat generated by biofuels has been rising since the 1980s and by 2013 close to 45% of district heat was produced by renewables.[4] A rough calculation of the 60% of households provided with district heat would imply that renewable fuels provide just over a quarter of Denmark’s heating and hot water needs in that year.
| 2009 | 2010 | 2011 | 2012 | 2013 | 2014 | |
|---|---|---|---|---|---|---|
| RE generation from waste | 912 | 863 | 825 | 792 | 776 | 792 |
| Biogas | 340 | 355 | 350 | 373 | 408 | 447 |
| Biomass | 1,777 | 2,958 | 2,680 | 2,771 | 2,812 | 2,631 |
| Total renewable thermal | 3,029 | 4,176 | 3,855 | 3,936 | 3,996 | 3,870 |
RE generation from waste.
RE generation from waste reduced a little over the period to 792 GWh in 2014, the reduction being due to less availability of waste and the reduced proportion of waste being classified as renewable energy in 2011. Overall about 2.6% of national electricity was generated by RE generation from waste.[23] Denmark incinerates close to 3 million tonnes of waste each year to produce electricity and heat, most of it is produced domestically with a smaller share imported from abroad. There are 28 waste incineration plants in the country. The waste powered CHP plants may also co burn additional fossil fuels, including oil and natural gas, but increasingly biomass is used to improve the performance of waste energy production. Only the carbon neutral biodegradable part of waste is classified as renewable energy generation which was defined as 55 percent of total waste from 2011 (in 2009 it was 58.8 percent).[23] Total waste provided 20 percent of district heating generation and between 4 and 5 percent of electricity generation in the country.[24] Energy production from waste over the next ten years is expected to remain at similar levels, new pre treatments of waste may however be developed.
Biogas.
Biogas generation has been rising steadily from a low base and reached 447 GWh of electricity production in 2014 contributing about 1.5% of Denmarks electricity. Approximately 75% of biogas generating plants are 3 MW or smaller in size which numbered approximately 120 plants in 2015.[23] A further 15 larger CHP plants account for the remaining approximately 25% of biogas consumption and co-fire biogas, mostly with natural gas. The largest source of Biogas is from manure, other sources include water treatment plants and landfill sites. Many of the smaller plants are located on farms and or other sources of biogas. Smaller biogas plants tend not to contribute heat to district heating networks. Denmark intends to increase production and use of biogas from 4PJ consumption in 2015 to 17 PJ by 2020 with the goal of using 50% of manure in the country.[23] Most of the new biogas is likely to be injected directly into the gas system and used for industry and transport.
Biomass.
Biomass provides the largest share of renewable energy in Denmark when considering the electricity sector, heating and cooling sector and transport sector combined. The fuel contributed to approximately 8.6% of total electricity generation in Denmark generating 2,631 GWh of electricity in 2014.[23] Total consumption of biomass amounted to 107 PJ in 2013.[23] There were 39 CHP plants using biomass as a fuel in 2014 consuming approximately 2.7 million tonnes to produce heat and power, corresponding to 40.94 PJ consumption in that year.[23] Biomass is sometimes co-fired with other fuels including a small percentage that is co-fired with waste. Around 40% of the biomass used in Denmark is imported including the majority of wood pellets.
| Biomass Source | Percentage share |
|---|---|
| Wood pellets | 33% |
| Firewood | 21% |
| Straw | 20% |
| Wood chips | 17% |
| Wood waste | 9% |
Electricity generated from biomass increased dramatically in 2010 following in increased share in its use in a number of power plants. Between 2009 and 2014 production of power increased by around 50%. By 2024 biomass is expected to double the percentage of renewable energy share from 15% to 30% of renewable electricity production in Denmark.[23] Total consumption of Biomass is expected to rise to 115PJ by 2024. A number of power stations are being converted from using coal to using wood pellets as a fuel. Some smaller CHP plants are converting from using natural gas to biomass.
Solar power
Solar power is a relatively recent arrival in Denmark and significant generation first occurred in 2012 with 104 GWh of electricity generation. By 2014 this had risen to 597 GWh.[1][14] The large increase in solar deployment in 2012 was aided by incentives including tax credits and net settlement for produced power. In response to a dramatic rise in solar installations during that year the incentives were revised downwards for 2013 and a smaller rise occurred during that year. Smaller solar installations predominate with 73% of PV cell capacity being less than 6 kW by the end of 2014,[24] a sign that incentives have largely benefitted households. Installed capacity of Solar PV is predicted to rise to 1,140 MW by 2024 and provide an estimated 3% of electricity consumption in Denmark.[24]
Targets and progress
Targets
| 2005 | 2010 | 2011 | 2012 | 2013 | 2014 | 2015 | 2016 | 2017 | 2018 | 2019 | 2020 | |
|---|---|---|---|---|---|---|---|---|---|---|---|---|
| Heating and cooling renewable sources. | 78 | 104 | 107 | 108 | 118 | 118 | 120 | 121 | 121 | 122 | 126 | 127 |
| Heating and cooling total sector. | 338 | 337 | 336 | 336 | 335 | 335 | 332 | 329 | 326 | 324 | 322 | 320 |
| Heating and cooling (%) renewable. | 23.2% | 30.8% | 31.8% | 32.1% | 35.2% | 35.3% | 36.0% | 36.7% | 37.2% | 37.7% | 39.3% | 39.8% |
| Electricity renewable sources. | 36 | 45 | 49 | 50 | 62 | 61 | 62 | 64 | 66 | 67 | 70 | 71 |
| Electricity total sector. | 133 | 130 | 131 | 132 | 133 | 135 | 135 | 136 | 135 | 135 | 136 | 136 |
| Electricity (%) renewable. | 26.8% | 34.3% | 37.1% | 38.0% | 46.2% | 45.5% | 45.7% | 47.2% | 48.6% | 49.7% | 51.8% | 51.9% |
| Total transport (excl. electricity) renewable sources. | 0 | 2 | 6 | 5 | 11 | 11 | 11 | 11 | 11 | 12 | 12 | 12 |
| Total transport (excl. electricity) all sources. | 219 | 217 | 221 | 226 | 226 | 227 | 227 | 229 | 229 | 230 | 231 | 231 |
| Transport consumption adjusted.* | 174 | 175 | 179 | 183 | 182 | 182 | 182 | 182 | 182 | 182 | 182 | 181 |
| Transport (%) renewable. | 0.2% | 1.0% | 3.5% | 5.9% | 6.0% | 6.0% | 6.7% | 7.3% | 7.9% | 8.6% | 9.4% | 10.1% |
| Expected total renewable energy consumption. | 114 | 150 | 161 | 168 | 190 | 189 | 192 | 195 | 198 | 200 | 207 | 209 |
| Overall renewable energy share (all sectors). | 16.5% | 21.9% | 19.2% | 19.2% | 20.5% | 20.5% | 22.6% | 22.6% | 25.3% | 25.3% | 30.1% | 30.0% |
*Transport consumption as defined in Article 3 (4) (a) of Directive 2009/28/EC, renewable electricity in motor transport counts 2.5 x value.
The table above shows the expected trajectory for shares of renewable energy in the three sectors as well as the overall target trajectory. Overall between 2005 and 2020 renewable energy sources are expected to rise from 16.5% to 30% of total energy use.
Progress
| 2013 | 2014 | |
|---|---|---|
| Heating and cooling renewable sources. | 109.2 | 107.7 |
| Heating and cooling (%) renewable. | 35.52% | 38.40% |
| Electricity renewable sources. | 55.6 | 61.1 |
| Electricity (%) renewable. | 43.12% | 48.48% |
| Total transport (excl. electricity) renewable sources. | 9.3 | 9.6 |
| Transport (%) renewable. | 5.59% | 5.67% |
| Gross total renewable energy consumption. | 173.6 | 177.8 |
| Overall renewable energy share (all sectors). | 26.68% | 28.45% |
The above table shows the actual overall and by sector renewable energy consumption achieved (PJ) in the years 2013-2014 as outlined in Denmark's NREAP progress report.[16]According to the Progress Report submitted by Denmark to the European Commission by 2014 Denmark had achieved a 28.45% share of overall renewable energy use across all energy uses. This included a 44.48% share in the electricity sector, a 38.4% share in the heating and cooling sector and a 5.67% share in the transport sector for 2014. Overall Denmark is running well ahead of its predicted trajectory and was close to achieving its 2020 as early as 2014. Total renewable energy consumption is a little below predicted levels at 177.8 PJ but this is more than compensated by a fall in overall energy consumption partly as a result of efficiency gains.
See also
- Wind power in Denmark
- Electricity sector in Denmark
- Solar power in Denmark
- Biofuel in Denmark
- Geothermal power in Denmark
- Energy in Denmark
- Energy policy of the European Union
- Renewable energy in Norway
- Renewable energy in Sweden
- Renewable energy in Finland
- Renewable energy in Iceland
- Renewable energy in the European Union
- Renewable energy by country
- Renewable energy commercialization
- List of countries by renewable electricity production
References
- 1 2 3 4 5 6 7 8 "Environmental Report for Danish electricity and CHP – Summary of the status year 2014, Energinet.DK" (PDF).
- ↑ "DIRECTIVE 2009/28/EC".
- ↑ "Share of renewables in energy consumption in the EU rose further to 16% in 2014. Eurostat News Release, 10 February 2016".
- 1 2 3 "pg.13, The Danish Energy Model, Innovative, Efficient and Sustainable. Danish Energy Agency".
- 1 2 "Danish Energy Agency, Preliminary Energy Statistics for 2015".
- 1 2 3 "p4, The Danish Energy Model, Innovative, Efficient and Sustainable. Danish Energy Agency" (PDF).
- ↑ "pg.2, The Danish Energy Model, Innovative, Efficient and Sustainable. Danish Energy Agency".
- 1 2 "National Renewable Energy Action Plans, Directive 2009/28/EC".
- ↑ "Denmark's annual reporting under Article 24(1) of the Energy Efficiency Directive" (PDF).
- ↑ "Energinet.dk" (PDF).
- 1 2 3 4 "Environmental Report 2008, Energinet.DK" (PDF).
- 1 2 3 4 "Environmental Report 2009, Energinet.DK" (PDF).
- 1 2 3 4 5 "Environmental Report for Danish electricity and CHP – Summary of the status year 2010, Energinet.DK" (PDF).
- 1 2 3 4 5 6 "Environmental Report for Danish electricity and CHP – Summary of the status year 2012, Energinet.DK" (PDF).
- 1 2 3 4 "Energinet.dk / Previous environmental reports".
- 1 2 3 4 5 6 7 "European Commission, Energy, Progress Reports".
- ↑ "Danish Energy Agency, Energy Statistics 2008".
- ↑ "Danish Energy Agency, Energy Statistics 2014, p.15" (PDF).
- 1 2 3 "European Commission, Energy, National Action Plans".
- ↑ "EV Sales: Denmark December 2015". ev-sales.blogspot.co.uk. Retrieved 2016-06-13.
- 1 2 3 "Wind power". energinet.dk. Retrieved 2016-05-14.
- ↑ "Wind power to combat climate change". www.e-pages.dk. Retrieved 2016-05-14.
- 1 2 3 4 5 6 7 8 9 10 "Energinet.dk / Climate and Environment / Environmental reporting / RE generation".
- 1 2 3 "Energinet.dk / Climate and Environment / Solar Power".
External links
- European Commission National Renewable Energy Action Plans
- European Commission renewable energy Progress Reports
- European Commission National Energy Efficiency Energy Action Plans
| Africa | |||||
|---|---|---|---|---|---|
| Asia | |||||
| Europe |
| ||||
| North America | |||||
| Oceania | |||||
| South America | |||||
| |||||