Solar power in Belgium
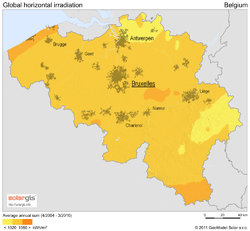
Solar power in Belgium reached an installed capacity of 3,425 MW of power generating 2,945 GWh of electricity in 2016 (provisional estimates).[1] In 2015 PV solar power accounted for around 4% of Belgium's total electricity demand, the 4th highest penetration figure in the world, although the country is some way behind the leaders Germany, Italy and Greece at between 7% and 8% of electricity demand.[2]
Installed capacity grew at an outstanding pace from 2008 until 2012, but its growth has since slowed to a steady pace. Almost all of solar power in Belgium is grid connected.[2]
Timeline
| Year | Photovoltaics[6][7][8][9][10] | |||
|---|---|---|---|---|
| MWp | GWh | Ref | ||
| 2008 | 71 | n.a | ||
| 2009 | 574 | 488 | ||
| 2010 | 787 | 560 | ||
| 2011 | 2,051 | 1,170 | ||
| 2012 | 2,768 | 2,115 | ||
| 2013 | 2,983 | 2,352 | ||
| 2014 | 3,140 | 2,883 | [2] | |
| 2015 | 3,252 | 3,045 | [1] | |
| *2016 | 3,425 | 2,945 | [1] | |
| Source: Photovoltaic Barometer *Provisional estimate. | ||||
2016
Solar PV per capita grew to 302.8 Watts, remaining the third highest in the EU.[1]
2015
In 2015 Solar PV per capita amounted to 287 Watts, the third highest in the world after Germany and Italy, providing around 4% of Belgium's total electricity demand.[2]
2014
In the afternoon of 20 March 2014, a new record of peak electricity generation had been achieved. According to the power supplier Eneco Energie, more than two gigawatt of electric power, corresponding to two full-sized nuclear power plants, were generated by solar PV and supplied more than 20 percent of the overall electricity consumption at the time.[11]
2013
In 2013, Belgium's watt per capita distribution, the total installed photovoltaic capacity per inhabitant, amounted to 267 watts. This was the third highest per-capita figure in the European Union—and therefore also in the world at that time—just behind Germany (447 watts) and Italy (295 watts).[12] In terms of the overall installed capacity of 2,983 MW, Belgium ranked tenth and belonged to the Top 10 leading photovoltaic countries in the world.[13][14]
2011
At the end of 2011 the bulk of photovoltaic capacity was installed in the Flemish Region (88%), the remaining 12% was found mostly in Wallonia. The smaller Brussels-Capital Region had an installed capacity of 7 MWp. .[15]
2009
In December 2009, there were 35,500 solar power installations in the Flemish region, 17,000 in Wallonia and 7,000 in the Brussels Capital Region.[16] The number of installations in the Flemish region in particular was expanding rapidly at that time due to a favourable support measure expiring at the end of the year.[17]
2007
Installed capacity of solar power increased drastically after 2007.[18] During 2009 the amount of solar installations quadrupled from 16,000 to 65,000. Residential and small installations had a combined power of about 220 MWp.[19]
Flanders
As of July 2012 there are 42,644 photovoltaic installations in the Flemish region that receive green certificates.[20]
| Installed capacity (MWp)[20] | ||||||||
|---|---|---|---|---|---|---|---|---|
| Year | Antwerp | Limburg | East Flanders | Flemish Brabant | West Flanders | Total | ||
| 2006 | 0.762 | 0.468 | 0.801 | 0.722 | 0.881 | 3.6 | ||
| 2007 | 3.9 | 4.8 | 4.4 | 3.0 | 5.9 | 22.0 | ||
| 2008 | 19.4 | 22.7 | 17.7 | 11.1 | 18.3 | 89.1 | ||
| 2009 | 110 | 88 | 149 | 65 | 130 | 542 | ||
| 2010 | 195 | 157 | 219 | 109 | 216 | 896 | ||
| 2011 | 386 | 350 | 362 | 194 | 379 | 1,672 | ||
| 2012 | 462 | 433 | 427 | 232 | 447 | 2,002 | ||
| 2013 | 488 | 453 | 474 | 248 | 471 | 2,135 | ||
| 2014 | 496 | 461 | 482 | 254 | 480 | 2,173 | ||
| 2015 | 506 | 468 | 486 | 256 | 488 | 2,204 | ||
| mid 2016 | 507 | 469 | 488 | 256 | 485 | 2,204 | ||
Subsidies
Towards 2011, it became clear that Flemish subsidies for solar panels had a significant impact on the cost of electricity of households without a photovoltaic installation. An added cost of up to 148 EUR is charged annually. Flemish minister for Energy Freya van den Bossche admitted that subsidies were too high, especially for large-scale installations.[21] The guaranteed minimum price for electricity produced was reduced. For small photovoltaic installations(less than 1 MW) it was reduced from 330 EUR per MWh to 250 EUR per MWh by January 2012 with the goal of reaching renewable energy targets at a reasonable cost.[22] This resulted in a rally which caused the number of installations to almost double from 20,514 to 37,355 in 2011.[20] The minimum price will be lowered further to 93 EUR per MWh from 2013 onwards.
Notable installations
In 2011 a 3-kilometre (2-mile) above ground "tunnel", built to avoid having to fell trees for a new high-speed railroad, was covered with solar panels.[23][24]
In December 2009, Katoen Natie announced that they will install 800,000 m² of solar panels in various places, including Antwerp. It is expected that the installed solar power in the Flemish Region will be increased by 25%, when finished. That will be the largest installation in Europe. The installation produces about 35 GWh yearly.[25] The total cost will be 166 million euros.[26]
In October 2009, the city of Antwerp announced that they want to install 2,500 m² of solar panels on roofs of public buildings, that will generate 265 MWh per annum.[27]
In 2009, the city of Leuven installed 1,810 solar panels on public buildings.[28]
Wallonia
| Installed capacity (MWp)[15][16] | ||||||||
|---|---|---|---|---|---|---|---|---|
| Year | capacity | |||||||
| 2009 | 64 | |||||||
| 2011 | 190 | |||||||
See also
References
- 1 2 3 4 "Photovoltaic barometer 2017 | EurObserv'ER". www.eurobserv-er.org. Retrieved 3 December 2017.
- 1 2 3 4 "Photovoltaic Barometer 2016".
- ↑ "Global Market Outlook for Photovoltaics 2014–2018". epia.org. EPIA – European Photovoltaic Industry Association. p. 34. Archived from the original (PDF) on 12 June 2014. Retrieved 12 June 2014.
- ↑ collected historical data from article growth of photovoltaics
- ↑ "Snapshot of Global PV 1992–2014" (PDF). iea-pvps.org/index.php?id=32. International Energy Agency – Photovoltaic Power Systems Programme. 30 March 2015. Archived from the original on 30 March 2015.
- ↑ Photovoltaic Barometer 2012
- ↑ Photovoltaic Barometer 2010
- ↑ Photovoltaic Barometer 2011
- ↑ Photovoltaic Barometer
- ↑ EUROBSER'VER. "Photovoltaic Barometer – installations 2012 and 2013". energies-renouvelables.org. pp. 5, 6. Archived from the original (PDF) on 22 June 2014. Retrieved 21 June 2014.
- ↑ "Nooit zoveel zonne-energie geproduceerd in België". Het Laatste Nieuws. 20 March 2014. Retrieved 9 April 2014.
- ↑ EUROBSER'VER. "Photovoltaic Barometer – installations 2012 and 2013". energies-renouvelables.org. pp. 5, 6. Archived from the original (PDF) on 22 June 2014. Retrieved 21 June 2014.
- ↑ "Snapshot of Global PV 1992–2013" (PDF). 2nd Edition
ISBN 978-3-906042-19-0. International Energy Agency – Photovoltaic Power Systems Programme. 2014. p. 11. Archived from the original on 5 April 2014. templatestyles stripmarker in
|work=at position 13 (help) - ↑ provisional IEA-PVPS data later revised, see article growth of photovoltaics for additional sources.
- 1 2 "Het geïnstalleerde PV-vermogen in Vlaanderen, Wallonië en Brussel" (in Dutch). architectura.be. 15 February 2012. Retrieved 30 November 2012.
- 1 2 Le nombre de panneaux solaires explose
- ↑ 50.000 Vlaamse gezinnen hebben zonnepanelen eind 2009
- ↑ Market growth of solar power in Flanders
- ↑ Feiten en tendenzen 2009
- 1 2 3 Energy regulator's bi-yearly statistics on installations receiving green certificates: mid2016 2015 2014 2013 2012 2011 2010 2009 2008 2007 2006
- ↑ Dossier zonnepanelen, nieuwsblad.be]
- ↑ "Vlaamse regering past steun voor groene stroom aan" (in Dutch). freyavandenbossche.be. 12 October 2010.
- ↑ High-speed Euro train gets green boost from two miles of solar panels
- ↑ Belgium launches Europe’s first solar train
- ↑ Katoen Natie heeft grootste installatie zonnepanelen in Europa
- ↑ België heeft grootste installatie zonnepanelen van Europa
- ↑ Antwerpen wil 2.500 m² zonnepanelen plaatsen op stadsgebouwen
- ↑ Leuven plaatst zonnepanelen op 4 stadsgebouwen
External links
![]()
| Africa | |||||
|---|---|---|---|---|---|
| Asia | |||||
| Europe |
| ||||
| North America | |||||
| Oceania | |||||
| South America | |||||
| |||||