Solar power by country
Many nations have installed significant solar power capacity into their electrical grids to supplement or provide an alternative to conventional energy sources. Solar power plants use one of two technologies:
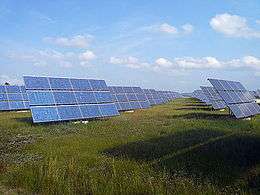
- Photovoltaic (PV) systems use solar panels, either on rooftops or in ground-mounted solar farms, converting sunlight directly into electric power.
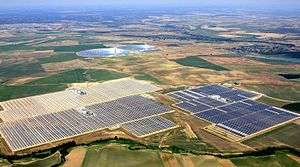
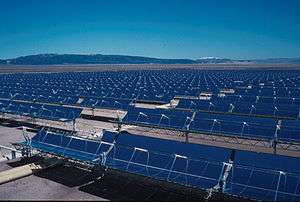
- Concentrated solar power (CSP, also known as "concentrated solar thermal") plants use solar thermal energy to make steam, that is thereafter converted into electricity by a turbine.
Worldwide growth of photovoltaics is extremely dynamic and varies strongly by country. By the end of 2016, cumulative photovoltaic capacity increased by more than 75 gigawatt (GW) and reached at least 303 GW, sufficient to supply approximately 1.8 percent of the world's total electricity consumption. The top installers of 2016 were China, the United States, and India.[1] There are more than 24 countries around the world with a cumulative PV capacity of more than one gigawatt. Austria, Chile, and South Africa, all crossed the one gigawatt-mark in 2016. The available solar PV capacity in Honduras is now sufficient to supply 12.5% of the nation's electrical power while Italy, Germany and Greece can produce between 7% and 8% of their respective domestic electricity consumption.[2][3][4]
After an almost two decade long hiatus, deployment of CSP resumed in 2007. However, the design for several new projects is being changed to cheaper photovoltaics.[5] Most operational CSP stations are located in Spain and the United States, while large solar farms using photovoltaics are being constructed in an expanding list of geographic regions. As of January 2017, the largest solar power plants in the world are the 850 MW Longyangxia Dam Solar Park in China for PV and the 377 MW Ivanpah Solar Power Facility in the United States for CSP.
Global deployment figures
Solar PV
|
|
| 1 | 511 | |
| 2 | 336 | |
| 3 | 322 | |
| 2015[6] | 2016[2] | 2017[7] | Share of total consumption1 | ||||
|---|---|---|---|---|---|---|---|
| Country | Added | Total | Added | Total | Added | Total | |
| 15,150 | 43,530 | 34,540 | 78,070 | 53,000 | 131,000 | 1.8% (2017)[8] | |
| 7,230 | 94,570 | ||||||
| 7,300 | 25,620 | 14,730 | 40,300 | 10,600 | 51,000 | 2.0% (2017)[9] | |
| 11,000 | 34,410 | 8,600 | 42,750 | 7,000 | 49,000 | 5.9% (2017)[10] | |
| 1,450 | 39,700 | 1,520 | 41,220 | 1,800 | 42,000 | 7.5% (2017)[11] | |
| 300 | 18,920 | 373 | 19,279 | 409 | 19,700 | 7.7% (2017)[12] | |
| 2,000 | 5,050 | 3,970 | 9,010 | 9,100 | 18,300 | 2.2% | |
| 3,510 | 8,780 | 1,970 | 11,630 | 900 | 12,700 | 3.8% (2017)[13] | |
| 879 | 6,580 | 559 | 7,130 | 875 | 8,000 | 1.9% (2017)[14] | |
| 935 | 5,070 | 839 | 5,900 | 1,250 | 7,200 | 3.3% (2016)[15] | |
| 56 | 5,400 | 55 | 5,490 | 147 | 5,600 | 5.7% (2017)[16] | |
| 1,010 | 3,430 | 850 | 4,350 | 1,200 | 5,600 | 1.0% (2016)[17] | |
| 95 | 3,250 | 170 | 3,422 | 284 | 3,800 | 3.9% (2016)[18] | |
| 584 | 832 | 2,600 | 3,400 | 2.4% (2017)[19] | |||
| 600 | 2,500 | 200 | 2,715 | 212 | 2,900 | 0.5% (2016)[20] | |
| 450 | 1,570 | 525 | 2,100 | 853 | 2,900 | 1.8% (2017)[21] | |
| 121 | 1,420 | 726 | 2,150 | 251 | 2,700 | 1.5% (2015)[22] | |
| 10 | 2,613 | 7.4% (2015)[23] | |||||
| 16 | 2,083 | ||||||
| 300 | 1,360 | 250 | 1,640 | 260 | 1,900 | 2.3% (2016)[24] | |
| 446 | 848 | 746 | 1,610 | 668 | 1,800 | ||
| 200 | 1,120 | 536 | 1,450 | 13 | 1,800 | 0.9% (2016)[25] | |
| 102 | 1,325 | ||||||
| 150 | 937 | 154 | 1,077 | 153 | 1,250 | 1.9% (2016)[26] | |
| 200 | 881 | 130 | 910 | 60 | 1,100 | ||
| 1 | 1,021 | ||||||
| 400 | 1,010 | ||||||
| 600 | 1,000 | ||||||
| 183 | 789 | 70 | 900 | 60 | 910 | 2.8% (2016)[27] | |
| 900 | |||||||
| 122 | 155 | 756 | 900 | ||||
| 1 | 591 | ||||||
| 58 | 513 | 57 | 577 | 1.6% (2016)[28] | |||
| 150 | 320 | 150 | 539 | ||||
| 391 | 391 | 12.5% (2015)[29] | |||||
| 63 | 231 | 54 | 286 | 50 | 386 | ||
| 51 | 130 | 60 | 175 | 93 | 303 | 0.2% (2017)[30] | |
| 60 | 138 | ||||||
| 15 | 125 | ||||||
| 57 | 87 | ||||||
| 19 | 73 | ||||||
| 5 | 73 | ||||||
| 5 | 70 | ||||||
| 5 | 20 | 10 | 15 | 23 | 61 | 0.1% (2017)[31] | |
| 11 | 45 | ||||||
| 2 | 15 | 11 | 26.7 | 18 | 45 | ||
| 4 | 4 | ||||||
| 1 | 2 | ||||||
| 0 | 2 | ||||||
| Total | 59,000[32] | 256,000[32] | 76,800 | 306,500 | 95,000 | 401,500 | 1.8% |
| 1 Share of total electricity consumption for latest available year | |||||||
Source: GTM Research, Q2 2017[33]
<0.1, n/a | 0.1–1 | 1–10 | 10–50 | 50–100 |
100–150 | 150–200 | 200–300 | 300–450 | >450 |
Concentrated solar power
| Country | Total | Added |
|---|---|---|
| 2,300 | 0 | |
| 1,738 | 0 | |
| 225 | 0 | |
| 200 | 100 | |
| 180 | 0 | |
| 100 | 0 | |
| 25 | 0 | |
| 20 | 0 | |
| 12 | 0 | |
| 10 | 10 | |
| 5 | 0 | |
| Source: REN21 Global Status Report, June, 2017[34] | ||
Africa
Many African countries receive on average a very high amount of days per year with bright sunlight, especially the dry areas, which include the deserts (such as the Sahara) and the steppes (such as the Sahel).[35] This gives solar power the potential to bring energy to virtually any location in Africa without the need for expensive large scale grid level infrastructural developments. The distribution of solar resources across Africa is fairly uniform, with more than 85% of the continent's landscape receiving at least 2,000 kWh/(m² year). A recent study indicates that a solar generating facility covering just 0.3% of the area comprising North Africa could supply all of the energy required by the European Union.[36]
Algeria
Morocco
Solar power in Morocco is enabled by the country having one of the highest rates of solar insolation among other countries— about 3,000 hours per year of sunshine but up to 3,600 hours in the desert. Morocco has launched one of the world’s largest solar energy projects costing an estimated $9 billion. The aim of the project is to create 2,000 megawatts of solar generation capacity by the year 2020.[37] Five solar power stations are to be constructed, including both photovoltaic and concentrated solar power technology. The Moroccan Agency for Solar Energy (MASEN), a public-private venture, has been established to lead the project. The first plant will be commissioned in 2015,[38] and the entire project in 2020. Once completed, the solar project will provide 38% of Morocco’s annual electricity generation.
Somalia
South Africa
South Africa had 1329 MW of PV installations and 100 MW of concentrating solar thermal at the end of 2016. It is expected to reach an installed capacity 8,400 MW by 2030, along with 8,400 MW of wind power.[39] The country's insolation greatly exceeds the average values in Europe, Russia, and most of North America.[40]
Asia
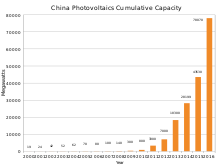
China

China is leading the world in solar PV generation, with the total installed capacity exceeding 100 GW. China is the world's largest market for both photovoltaics and solar thermal energy. and in the last few years, more than half of the total PV additions came from the country. Solar power in the People's Republic of China is one of the biggest industries and the subsidies by the government have helped in bringing down the cost of solar power, not only in China, but the whole world. Three of the top four largest photovoltaic power stations in operation are located in China, including the world's largest Tengger Desert Solar Park. China also leads the world in solar water heating with 290 GWth in operation at the end of 2014, accounting for about 70% of the total world capacity. China's goal is to reach 1,300 GW of Solar Capacity by 2050.
India
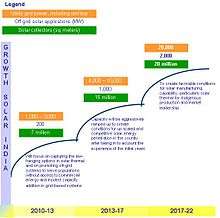

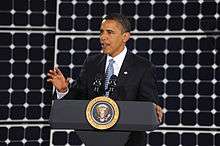
India has the world's third fastest expanding solar power program (next only to China & USA). In the year 2017 alone India added a record 9,255 MW of solar power with another 9,627 MW of solar projects under development.[41][42][43][44] India launched its National Solar Mission in 2010 under the National Action Plan on Climate Change, with plans to generate 20 GW by 2022. This target has been achieved four years ahead of its deadline with India surpassing 20 GW of installed solar capacity in January 2018.[45][42][46][47][48] In January 2015, Indian Prime Minister Narendra Modi announced an initiative to increase the solar capacity to 100 GW[49] and total renewable power capacity to 175 gigawatts (GW) by 2022. This target is ambitious considering the worldwide installed solar capacity at that time was 177 GW, out of which only 2.5 GW was installed in India.
To reach the goal of 100 GW of installed solar capacity by 2022, Modi's government has set a target to auction at least 77 gigawatts of additional solar power capacity by March 2020.[50] A total of 1.2 GW of solar power is tendered in the first week of 2018 and a solar power tender of 20 GW, world's largest so far, is to be auctioned off in one go in 2018.[50] Several large grid-scale solar parks are in operation, several of which are among the world's largest such as Kurnool Ultra Mega Solar Park with the capacity of 1,000 MW, the Kamuthi Solar Power Project with the capacity of 648 MW, the 345 MW Charanka Solar Park, the 480 MW Bhadla Solar Park with a proposed capacity of 2,255 MW and the Gujarat solar parks with a combined capacity of 605 MW.[51] In July 2017, Indian Railways rolled out trains with rooftop solar to power the lights, fans and displays inside the coaches.[52][53] Cochin International Airport, seventh busiest in India, is the first one in the world to run entirely on solar power,[54][55] handling more than 1,000 flights a week. Similarly, the Union Territory of Diu is fully run by solar power.[56]
Solar power features prominently in Modi government’s USD $2.5 billion SAUBHAGYA scheme launched in July 2015 to electrify every Indian household by 2019 — a huge task considering around 300 million people were without electricity. The use of local mini-grids run on solar power is “a big part of the push, with 60 percent of new connections expected to be to renewable power", according to a report by the International Energy Agency.[57] The government provides subsidy of up to 90% of the upfront capital cost to install solar-powered water pumping systems for irrigation and drinking water.[32] As of 30 November 2017, more than 142,000 solar pumps have been installed to irrigate the agricultural fields.[33] This scheme weans farmers away from diesel-powered pumps and generates extra income for them by allowing to sell surplus power to the grid. It is one of the innovative ways that the government is empowering the rural population with the help of solar energy by addressing specific issues such as water availability. The solar panels are being built over the irrigation canals to preserve water from evaporation in drought-prone sunny areas. The world's first canal-top solar project was set up on Narmada in Gujarat in 2012. For the last mile connectivity in remote and inaccessible areas, the government provides solar power packs of 200 to 300 watt-peak (Wp), along with battery bank, that includes five LED lights, one DC fan and one DC power plug.[34] Other schemes includes Solar Street Light Scheme, providing solar direct current lighting systems, solar lanterns, solar cookers, etc.
In January 2016, the Prime Minister of India, Narendra Modi, and the former President of France, François Hollande, laid the foundation stone for the headquarters of the International Solar Alliance (ISA) in Gwalpahari, India, an alliance of 121 countries, announced at the Paris COP21 climate summit.[58][59] The ISA focuses on promoting and developing solar energy and reducing production and development costs through wider deployment of solar technologies in the developing world.[60][61] On June 30, 2016, the alliance entered into a partnership with the World Bank for accelerating mobilization of finance for solar energy — an estimated US $1000 billion in investments that will be needed by 2030, to meet ISA's goals for the massive deployment of affordable solar energy worldwide.[62]
At the World Future Energy Summit (WFES) held in Abu Dhabi in January 2018, the government of India announced the setting up of a $350 million solar development fund to enable financing of solar projects. Prime Minister Narendra Modi promoted solar energy during the plenary speech at World Economic Forum annual meet in Davos in 2018 and invited investments in the sector in India promising ease of doing business.[63] Modi's ambitious plan when announced in the leading up to the Paris COP21 climate summit received much skepticism and the government's strategy to scale-up the renewable energy by relying on competitive bidding to reduce the cost was regarded as infeasible. However, starting around 2016-2017, new renewable energy became cheaper to build than running existing coal-fired plants in India. As of January 2018, 65% of coal power generation in India is being sold at higher rates than new renewable energy bids in competitive power auctions.[64] India has scrapped tenders for coal-fired power stations and around 80% of new coal-fired power plants under planning have been halted or canceled.[65] In the month of May 2017 alone, plans for building coal power for nearly 14 GW – about the same as the total amount in the UK – were canceled on account of declining solar costs.[66] Analyst Tim Buckley said “Measures taken by the Indian Government to improve energy efficiency coupled with ambitious renewable energy targets and the plummeting cost of solar has had an impact on existing as well as proposed coal fired power plants, rendering an increasing number as financially unviable. India’s solar tariffs have literally been free falling in recent months."[66][67] As reported by NYTimes in May 2017, "According to research released last week at a United Nations climate meeting in Germany, China and India should easily exceed the targets they set for themselves in the 2015 Paris Agreement..... India is now expected to obtain 40 percent of its electricity from non-fossil fuel sources by 2022, eight years ahead of schedule."[68][69]
Japan
Solar power in Japan has been expanding since the late 1990s. By the end of 2017, cumulative installed PV capacity reached over 50 GW with nearly 8 GW installed in the year 2017. The country is a leading manufacturer of solar panels and is in the top 4 ranking for countries with the most solar PV installed. Overall installed capacity is now estimated to be sufficient to supply 2.5% of the nation's annual electricity demand.[4] The insolation is good at about 4.3 to 4.8 kWh/(m²·day).
Japan was the world's second largest market for solar PV growth in 2013 and 2014, adding a record 6.9 GW and 9.6 GW of nominal nameplate capacity, respectively.
Myanmar
Pakistan
Pakistan has set up a solar power park, funded by the Chinese company TBEA, in the Cholistan desert near Yazman, about 30 kilometers from the eastern city of Bahawalpur. The solar project, which is set up on 5,000 acres, is producing 100 MW . Another Chinese company, Zonergy is setting up 900MW of Solar Power Plant in the same region.
The first unit was completed with a cost of 15 billion rupees in a short period of eleven months. The electricity generated by the project will be added to the national grid through grid stations and power supply transmission lines. Second phase of the park will comprise 900 MW which will be completed with the help of Chinese Government.[70] .[71] .[72]
Philippines
In 2012, the Philippines generated a modest 1,320 MWh of solar energy.[73]
South Korea
The Sinan solar power plant is a 24 MW photovoltaic power station in Sinan, Jeollanam-do, South Korea. As of 2009, it is the largest photovoltaic installation in Asia. The project was developed by the German company Conergy and it cost US$150 million. It was built by the Dongyang Engineering & Construction Corporation.[74]
Taiwan
The government has a long-term plan to make the solar capacity become 4,500 MW by 2020 and to make 7.5 million Taiwan residents to utilize solar energy by 2030. To give further incentives, the government has designated solar energy and LED industries as two industries to actively develop in the near future.
Thailand
In 2015, Thailand has more solar power capacity than all the rest of Southeast Asia combined. Thailand's solar capacity will rise to 2,500-2,800 MW in the end of 2015 from about 1,300 MW in 2014. Thailand aims to increase its solar capacity to 6,000 MW by 2036. That would account for 9% of total electricity generation.[75]
Middle East
Cyprus
Georgia
Israel

There is no oil on Israeli land and the country's tenuous relations with its oil-rich neighbors (see Arab–Israeli conflict) has made the search for a stable source of energy a national priority.[76][77] So Israel has embraced solar energy. Israeli innovation and research has advanced solar technology to a degree that it is almost cost-competitive with fossil fuels.[78] Its abundant sun made the country a natural location for the promising technology. The high amount of sunshine received by the Negev Desert every year has spurred an internationally renowned solar research and development industry, with Arnold Goldman (founder of Luz, Luz II and BrightSource Energy), Harry Tabor and David Faiman of the National Solar Energy Center its more prominent members.[76] At the end of 2008 a feed-in tariff scheme was approved, which immediately put in motion the building of many residential and commercial solar energy power station projects. Luz and Bright Source R&D centers in Jerusalem pioneered industrial scale solar energy fields with initial installations in California's Mojave Desert.
Jordan
Saudi Arabia
The Saudi agency in charge of developing the nations renewable energy sector, Ka-care, announced in May 2012 that the nation would install 41 gigawatts of solar capacity by 2032, this plan was later was revised to 9.5 GW installed capacity. At the time of this announcement, Saudi Arabia had only 0.003 gigawatts of installed solar energy capacity.[79]
In 2018 there has been a proposal for a total of 200 GW of solar power capacity by 2030. The newly announced project is estimated to cost $200 billion through 2030.
United Arab Emirates
In 2013, the Shams solar power station, a 100 MW Concentrated solar power plant near Abu Dhabi became operational. The US$600 million Shams 1 is the largest CSP plant outside the United States and Spain and is expected to be followed by two more stations, Shams 2 and Shams 3.[80]
Yemen
Europe
 |
 |
.JPG) | |
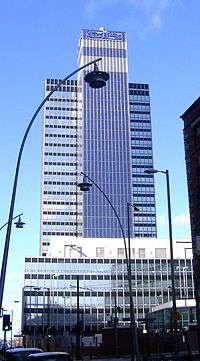
| Top-left: solar panels on the BedZED development in the London Borough of Sutton. Bottom-left: residential rooftop solar PV in Wetherby, Leeds. Right: the CIS Tower was clad in building-integrated PV and connected to the grid in 2005. | |
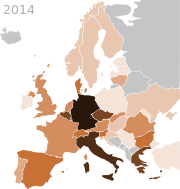
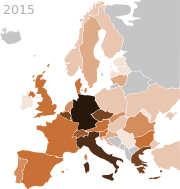
European deployment of photovoltaics has slowed down considerably since the record year of 2011. This is mainly due to the strong decline of new installations in some major markets such as Germany and Italy, while the United Kingdom and some smaller European countries are still expected to break new records in 2014.[81] Spain deployed about 350 MW (+18%) of concentrated solar power (CSP) in 2013, and remains a worldwide leader of this technology. European countries still account for about 60 percent of worldwide deployed capacity of solar power in 2013.[82][83]
Austria
Austria had 421.7 MW of photovoltaics at the end of 2012, 234.5 MW of which was installed that year. Most of it is grid connected.[84] Photovoltaic deployment in Austria had been rather modest for many years, while in other European countries, such as Germany, Italy or Spain installations were booming with new records year after year until 2011. The tide has turned in 2012. New PV installations jumped to more than 200 megawatt per year in Austria in an overall declining European solar market. The European Photovoltaic Industry Association forecasts, that Austria, together with other midsized countries, will contribute significantly to European PV deployment in the coming years.[85]
Belgium
In October 2009, the city of Antwerp announced that they wanted to install 2,500 m² of solar panels on the roofs of public buildings, which would be worth 265,000 kWh per annum.[86]
In December 2009, Katoen Natie announced that they would install 800,000 m² of solar panels in various places, including Antwerp.[87] It is expected that the installed solar power in the Flemish region will be increased by 25% when finished,[87] resulting in the largest installation in Europe.,[87] the total cost being 166 million euros.[88]
Bulgaria
Bulgaria had seen a record year in 2012 when its PV capacity multiplied several times over to more than 1 GW. In 2013, however, further deployment came to a halt.
Czech Republic
Denmark
Finland
France
Germany
Germany is among the top 4 ranking countries in terms of installed photovoltaic solar capacity and number one regarding per capita installation of PV. The overall capacity has reached 42.98 gigawatts (GW) by the end of 2017.[89][90] Photovoltaics contribute almost 6% to the national electricity demands. Germany has seen an outstanding period of photovoltaic installations from 2010 until 2012. During this boom, about 22 GW, or a third of the worldwide PV installations of that period was deployed in Germany alone. However, the boom period ended in 2012, and Germany's national PV market has since declined significantly, due to the amendments in the German Renewable Energy Act (EEG) that reduced feed-in tariffs and set constraints on utility-scaled installations, limiting their size to no more than 10 MW.[91]
The current version of the EEG only guarantees financial assistance as long as the overall PV capacity has not yet reached 52 GW. It also foresees to regulate annual PV growth within a range of 2.5 GW to 3.5 GW by adjusting the guaranteed fees accordingly. The legislative reforms stipulates a 40 to 45 percent share from renewable energy sources by 2025 and a 55 to 60 percent share by 2035.[92]
Large PV power plants in Germany include Senftenberg Solarpark, Finsterwalde Solar Park, Lieberose Photovoltaic Park, Strasskirchen Solar Park, Waldpolenz Solar Park, and Köthen Solar Park.
Greece
By September 2013, the total installed photovoltaic capacity in Greece had reached 2,523.5 MWp from which the 987.2 MWp were installed in the period between January–September 2013 despite the unprecedented financial crisis.[93] Greece ranks 5th worldwide with regard to per capita installed PV capacity. It is expected that PV produced energy will cover up to 7% of the country's electricity demand in 2014.[94]
A large solar PV plant is planned for the island of Crete. Research continues into ways to make the actual solar collecting cells less expensive and more efficient. Smaller solar PV farms exist throughout the country.
Hungary
Italy
Italy added nearly 400 MW of solar PV capacity in the year 2017 reaching a total installed PV capacity of around 19.7 GW.[95]
At the end of 2010 there were 155,977 solar PV plants, with a total capacity of 3,469.9 MW.[96]:24 The number of plants and the total capacity surged in 2009 and 2010 following high incentives from Conto Energia. The total power capacity installed tripled and plants installed doubled in 2010 compared to 2009, with an increase of plant's average dimensions.[96]:24
Energy production from photovoltaics was 1,905.7 GWh in 2010. Annual growth rates were fast in recent years: 251% in 2009 and 182% in 2010.[96]:30 More than a fifth of the total production in 2010 came from the southern region of Apulia.[96]:30
In December 2012, solar PV in Italy provided employment to 100,000 people especially in design and installation.[97]
Lithuania
Netherlands
Poland
Portugal
A large photovoltaic power project, the Serpa solar power plant, has been completed in Portugal, in one of Europe's sunniest areas.[98] The 11 megawatt plant covers 150 acres (0.61 km2) and comprises 52,000 PV panels. The panels are raised 2 metres off the ground and the area will remain productive grazing land. The project will provide enough energy for 8,000 homes and will save an estimated 30,000 tonnes of carbon dioxide emissions per year.[99][100]
The Moura photovoltaic power station is located in the municipality of Moura, in the interior region of Alentejo, Portugal.Its construction involves two stages, with the first one being constructed in 13 months and completed in 2008, and the other will be completed by 2010, at a total cost of €250 million for the project.
Romania
Romania has an installed capacity of 1.2 GW as of 2014. Romania is located in an area with a good solar potential of 210 sunny days per year and with an annual solar energy flux between 1,000 kWh/m2/year and 1,300 kWh/m2/year. The most important solar regions of Romania are the Black Sea coast, Dobrogea and Oltenia.
Russia

Current production of 5 MW is very modest, however there are plans for an expansion in capacity by 70 MW in 2012-13 in a $210 million joint project by Rosnano and Renova.[101] The development of renewable energy in Russia has been held back by the lack of a conducive framework and government policy.[102]
Spain
Spain was an early adopter in the development of solar energy, since it is one of the countries of Europe with more hours of sunshine. The Spanish government committed to achieving a target of 12 percent of primary energy from renewable energy by 2010 with an installed solar generating capacity of 3000 megawatts (MW).[103] Spain is the top tenth in the installed PV solar capacity and used to export 80 percent of solar power output to Germany.[104] Total solar power in Spain reached nearly 7 GW by the end of 2016 including both installed PV and CSP.[105] Nearly 8 TWh of electricity was generated from photovoltaics, and 5 TWh from CSP plants in 2016.[106] Solar PV accounted for nearly 3% of total electricity generation in 2016 along with an additional of 1.9% from solar thermal.[107]
Through a ministerial ruling in March 2004, the Spanish government removed economic barriers to the connection of renewable energy technologies to the electricity grid. The Royal Decree 436/2004 equalized conditions for large-scale solar thermal and photovoltaic plants and guaranteed feed-in tariffs, which led to a boost in solar power adoption in Spain.[108] In the wake of the 2008 financial crisis, the Spanish government drastically cut its subsidies for solar power and capped future increases in capacity at 500 MW per year leading to a stagnation in the new installations.[109]
Switzerland
Turkey
Registered solar capacity of Turkey stood at 3,420 MW by the end of 2017[110], although the actual installation can be lower. The increase in registrations mostly happened in December and was attributed to a reduction in feed-in tariffs starting from 2018 (from 0.13 USD to 0.10 USD).
Ukraine
United Kingdom
At the end of 2011, there were 230,000 solar power projects in the United Kingdom,[111] with a total installed generating capacity of 750 megawatts (MW).[112] By February 2012 the installed capacity had reached 1,000 MW.[113] Solar power use has increased very rapidly in recent years, albeit from a small base, as a result of reductions in the cost of photovoltaic (PV) panels, and the introduction of a Feed-in tariff (FIT) subsidy in April 2010.[111] In 2012, the government said that 4 million homes across the UK will be powered by the sun within eight years,[114] representing 22,000 MW of installed solar power capacity by 2020.[111] As of April 2015, PV capacity had risen to 6,562 MW across 698,860 installations.[115] The latest government figures indicates UK solar photovoltaic (PV) generation capacity has reached 12,404 MW in December 2017.[116]
Americas
Brazil
Canada
Sarnia Photovoltaic Power Plant near Sarnia, Ontario, was in September 2010 the world's largest photovoltaic plant with an installed capacity of 80 MWp.[117] until surpassed by a plant in China. The Sarnia plant covers 950 acres (380 ha) and contains about 966,000 square metres (96.6 ha), which is about 1.3 million thin film panels. The expected annual energy yield is about 120,000 MW·h, which if produced in a coal-fired plant would require emission of 39,000 tonnes of CO2 per year.
Canada has many regions that are sparsely populated and difficult to access, but also does not have optimal access to sunlight given the high latitudes of much of the country. Photovoltaic cells are increasingly used as standalone units, mostly as off-grid distributed electricity generation to power remote homes, telecommunications equipment, oil and pipeline monitoring stations and navigational devices. The Canadian PV market has grown quickly and Canadian companies make solar modules, controls, specialized water pumps, high efficiency refrigerators and solar lighting systems.[118] Ontario has subsidized solar power energy to promote its growth.
One of the most important uses for PV cells is in northern communities, many of which depend on high-cost diesel fuel to generate electricity. Since the 1970s, the federal government and industry has encouraged the development of solar technologies for these communities. Some of these efforts have focused on the use of hybrid systems that provide power 24 hours a day, using solar power when sunlight is available, in combination with another energy source.[118]
Chile
The 246MW El Romero solar photovoltaic plant open in November 2016 at Vallenar in the Atacama region[119] It was the largest solar farm in Latin America when it opened.
By the first half of 2015 Chile reached 546 MW of PV installed capacity, and 1,647 MW are under construction.[120]
Dominican Republic
In the Dominican Republic, the Monte Plata Project is the largest operating solar plant in the Caribbean with an installed capacity of 69MW.[121][122]
Jamaica
In 2014, a 1.6 MW photovoltaic rooftop system at a seaside resort, located near the parish capital, Lucea in the parish of Hanover, was inaugurated.[123][124] It was developed by Sofos Jamaica,[125] and is the largest in Jamaica until a 20 MW utility-scale solar PV plant is constructed in the Parish of Clarendon in 2015.[126][127][128]
No central database yet exists with information on installed capacity but, web searches reveal media articles, press releases and vendor web pages that share some details. Based on these sources up to the middle of 2015, there was over 3.7 MW connected to the grid but, a sizeable portion of that total, including the 1.6 MW rooftop system of a seaside resort[124] and a commercial 500 kW-system in the country's capital, Kingston,[129] do not feed power back to the grid despite being interconnected.
Mexico
Mexico was the greatest solar energy producer in Latin America until passed by Chile. It is planning a solar trough based plant with 30 MW which will use a combined cycle gas turbine about 400 MW to provide electricity to the city of Agua Prieta, Sonora. To date, the World Bank has given US$50 million to finance this project.[130]
United States
Solar power in the United States includes utility-scale solar power plants as well as local distributed generation, mostly from rooftop photovoltaics. Installations have been growing rapidly in recent years as costs have declined with the U.S. hitting over 50 GW of installed solar PV capacity at the end of 2017.[131][132] United States is in the top 4 ranking for countries with the most solar PV installed. The American Solar Energy Industries Association projects that total solar PV capacity will reach over 100 GW by 2021.[133]
Electrical generation has been rising in tandem with capacity as U.S. Energy Information Administration data show that utility-scale solar power generated 0.65% of total U.S. electricity in 2015, up from 0.01% in 2005.[134] This figure is even higher in certain states, already reaching 7% of generation in California for example.[135][136]
The United States conducted much early research in photovoltaics and concentrated solar power and is among the top countries in the world in deploying the technology, being home to 4 of the 10 largest utility-scale photovoltaic power stations in the world as of 2017. The energy resource continues to be encouraged through official policy with 29 states having set mandatory renewable energy targets as of October 2015, solar power being specifically included in 20 of them.[137][138] Aside from utility projects, roughly 784,000 homes and businesses in the nation have installed solar systems through the second quarter of 2015.[139]
Oceania
A number of Pacific island states have committed to high percentages of renewable energy use, both to serve as an example to other countries and to cut the high costs of imported fuels. A number of solar installations have been financed and assisted by Japan, New Zealand and the United Arab Emirates. Solar farms have gone online in Tuvalu, Fiji and Kiribati.[140] UAE-Pacific Partnership Fund solar projects completed by Masdar in 2016 included: 1MW in the Solomon Islands, 500 kW in Nauru, 600 kW in the Marshall Islands, 600 kW in Micronesia and a 450 kW solar-diesel hybrid plant in Palau.[141][142] American Samoa has 2 MW of solar installed at Pago Pago Airport.[143]
Australia
Australia had over 8,452 megawatts (MW) of installed photovoltaic (PV) solar power by June 2018.[144] The largest solar power station in Australia is the 100 MW Nyngan solar plant, which was the largest in the southern hemisphere when completed. Other significant solar arrays include the 56 MW Moree Solar Farm, the 53 MW Broken Hill Solar Plant, the 20 MW Royalla solar farm, and the 10 MWp (megawatts, peak) Greenough River Solar Farm near Geraldton, Western Australia.
A 9 MWe (megawatts, electrical) solar thermal `coal saver' system was constructed at Liddell power station. The system used `compact linear Fresnel reflector' technology developed in Australia. It provided solar-powered steam to the 600 MW black coal power station's boiler feedwater heater. By 2016, it was "effectively" closed and an effort to build a similar 40 MW solar boost at Kogan Creek coal power station was stopped.[145]
New Zealand
Solar power in New Zealand currently only generates 0.1 percent of New Zealand's electricity since more emphasis has been placed on hydroelectric, geothermal, and wind power in New Zealand's push for renewable energy. Solar power systems were installed in 42 schools in New Zealand in the Schoolgen program, a program developed by Genesis Energy to educate students in solar power. Each participating school has a 2 kW solar panel. Between February 2007 and 29 December 29, 2012, 395.714 MWh were produced.[146]
In 2010, New Zealand's largest thin film solar array was the 20 kW array installed at Hubbard Foods[147] A 21.6 kW photovoltaic array was installed in Queenstown in 2009.[148] In April 2012, New Zealand's largest solar power plant was the 68.4 kW array installed to meet 70% of the electricity needs of South Auckland Forging Engineering Ltd, which is expected to pay for itself in eight to nine years.[149][150]
See also
References
- ↑ IEA: Global Installed PV Capacity Leaps to 303 Gigawatts, greentechmedia, Eric Wesoff, April 27, 2017
- 1 2 3 4 5 2016 Snapshot of Global Photovoltaic Markets, International Energy Agency, 2017
- ↑ "Global Market Outlook for Solar Power 2015-2019" (PDF). www.solarpowereurope.org. Solar Power Europe (SPE), formerly known as EPIA – European Photovoltaic Industry Association. Archived from the original (PDF) on 9 June 2015. Retrieved 9 June 2015.
- 1 2 "Snapshot of Global PV 1992-2014" (PDF). www.iea-pvps.org. International Energy Agency — Photovoltaic Power Systems Programme. 30 March 2015. Archived from the original on 30 March 2015.
- ↑ "CSP Has Fallen By The Wayside – But May Come Back Big By 2020". CleanTechnica. 27 February 2014.
- ↑ "Snapshot of Global Photovoltaic Markets" (PDF). report. International Energy Agency. 22 April 2016. Retrieved 24 May 2016.
- ↑
- ↑ "2017 electricity & other energy statistics (update of June 2018) | China Energy Portal | 中国能源门户". China Energy Portal | 中国能源门户. 2018-06-14. Retrieved 2018-07-28.
- ↑ https://www.statista.com/statistics/201794/us-electricity-consumption-since-1975//
- ↑ http://www.iea-pvps.org/fileadmin/dam/public/report/statistics/IEA-PVPS_-_A_Snapshot_of_Global_PV_-_1992-2017.pdf
- ↑ http://www.iea-pvps.org/fileadmin/dam/public/report/statistics/IEA-PVPS_-_A_Snapshot_of_Global_PV_-_1992-2017.pdf
- ↑ https://www.qualenergia.it/articoli/20180122-fonti-rinnovabili-in-calo-nel-2017-ma-record-di-produzione-del-fotovoltaico/
- ↑ http://www.iea-pvps.org/fileadmin/dam/public/report/statistics/IEA-PVPS_-_A_Snapshot_of_Global_PV_-_1992-2017.pdf
- ↑ http://bilan-electrique-2017.rte-france.com/1-synthese/11-intro-synthese/
- ↑ "National Survey Report of PV Power Applications in Australia 2016". International Energy Agency - Photovoltaic Power Systems Programme. 2017-07-26. p. 8. Retrieved 2018-08-13.
- ↑ www.enerclub.es/file/Vqrx4hvOOQPM0ex5BxJguQ
- ↑ "National Survey Report of PV Power Applications in Korea 2016". International Energy Agency - Photovoltaic Power Systems Programme. 2018-07-31. p. 6. Retrieved 2018-08-13.
- ↑ "National Survey Report of PV Power Applications in Belgium 2016". International Energy Agency - Photovoltaic Power Systems Programme. 2017-09-14. p. 6. Retrieved 2018-08-13.
- ↑ http://www.enerji.gov.tr/en-US/Pages/Electricity
- ↑ "National Survey Report of PV Power Applications in Canada 2016". International Energy Agency - Photovoltaic Power Systems Programme. 2017-09-27. p. 8. Retrieved 2018-08-13.
- ↑ "CBS Hernieuwbare elektriciteit; productie en vermogen". CBS. 4 July 2018. Retrieved 4 July 2018.
- ↑ "National Survey Report of PV Power Applications in Thailand 2015". International Energy Agency - Photovoltaic Power Systems Programme. 2016-08-16. p. 5. Retrieved 2018-08-15.
- ↑
- ↑ "National Survey Report of PV Power Applications in Switzerland 2016". International Energy Agency - Photovoltaic Power Systems Programme. 2017-08-30. p. 8. Retrieved 2018-01-07.
- ↑ http://www.statssa.gov.za/publications/Report-41-01-02/Report-41-01-022016.pdf
- ↑ "National Survey Report of PV Power Applications in Austria 2016". International Energy Agency - Photovoltaic Power Systems Programme. 2017-10-25. p. 5. Retrieved 2018-08-13.
- ↑ "National Survey Report of PV Power Applications in Denmark 2016". International Energy Agency - Photovoltaic Power Systems Programme. 2017-09-27. p. 10. Retrieved 2017-09-27.
- ↑ "National Survey Report of PV Power Applications in Portugal 2016". International Energy Agency - Photovoltaic Power Systems Programme. 2017-10-25. p. 7. Retrieved 2018-08-15.
- ↑ "TRENDS 2016 IN PHOTOVOLTAIC APPLICATIONS" (PDF). IEA.
- ↑ "National Survey Report of PV Power Applications in Sweden 2017". International Energy Agency - Photovoltaic Power Systems Programme. 2018-10-15. p. 16/70. Retrieved 2018-10-17.
- ↑ "National Survey Report of PV Power Applications in Finland 2017". International Energy Agency - Photovoltaic Power Systems Programme. 2018-09-03. p. 6/26. Retrieved 2018-10-17.
- 1 2 Mike Munsell (22 January 2016). "IEA PVPS: 177 GW of PV installed worldwide". news. Greentech Media. Retrieved 24 May 2016.
- ↑ "Global Solar Demand Monitor: Q2 2017". Greentech Media Research. Retrieved 2017-08-25.
- ↑ Renewables Global Status Report, REN21, 2017
- ↑ Solar Power in Africa, National Solar Power Research Institute, Yansane A. 2007
- ↑ Report on Solar Power Potential Archived 2007-09-27 at the Wayback Machine., German Aerospace Center
- ↑ AfDB helps fund $1.44bn Moroccan solar project
- ↑ Morocco Building 500 MW Solar Power Project Archived 2014-09-24 at the Wayback Machine.
- ↑ Solar energy in South Africa
- ↑ Insolation maps, retrieved April 14, 2012
- ↑ https://www.pv-tech.org/news/india-added-9255mw-of-solar-in-2017-bridge-to-india
- 1 2 "India Achieves 20 Gigawatts Solar Capacity 4 Years Ahead Of Initial Target | CleanTechnica". cleantechnica.com. Retrieved 2018-02-09.
- ↑ "10 Trends That Will Shape the Global Solar Market in 2018". Retrieved 2018-02-06.
- ↑ "Cheap Renewables Are Transforming the Global Electricity Business - The Energy Collective". The Energy Collective. 2018-02-16. Retrieved 2018-02-21.
- ↑ "India achieves 20 GW solar capacity goal four years ahead of deadline". www.businesstoday.in. Retrieved 2018-02-04.
- ↑ "India to reach 20 GW of installed solar capacity by FY18-end: report". Retrieved 22 September 2017.
- ↑ "Physical Progress (Achievements)". Ministry of New and Renewable Energy, Govt. of India. Archived from the original on 12 September 2016. Retrieved 22 September 2017.
- ↑ "India's installed solar capacity reached 6,000 MW in 6 years". news. The Economic Times of India. 26 May 2016. Retrieved 27 May 2016.
- ↑ "India's Modi raises solar investment target to $100 bln by 2022". Reuters. 2015-01-02. Retrieved 2018-02-04.
- 1 2 "India Plans World's Largest Solar Power Tender -- 20 Gigawatts | CleanTechnica". cleantechnica.com. Retrieved 2018-02-04.
- ↑ Gujarat's Charanka Solar Park
- ↑ Ghoshal, Devjyot. "India is rolling out trains with solar-powered coaches that'll save thousands of litres of diesel". Quartz. Retrieved 2018-02-06.
- ↑ "India launches solar-panelled train that will save 21,000 litres of diesel a year". The Independent. 2017-07-19. Retrieved 2018-02-11.
- ↑ "Fully solar powered airport: A case study of Cochin International airport". Journal of Air Transport Management. 62: 176–188. 2017-07-01. doi:10.1016/j.jairtraman.2017.04.004. ISSN 0969-6997.
- ↑ Mullen, Jethro. "The first world's first solar-powered airport is in Cochin, India". CNNMoney. Retrieved 2018-02-06.
- ↑ "Indian District Becomes First Union Territory to Run Entirely on Solar Power | Care2 Causes". Care2 Causes. Retrieved 2018-03-18.
- ↑ "Solar power push lights up options for India's rural women". Reuters. 2018-02-12. Retrieved 2018-02-18.
- ↑ Goswami, Urmi (2015-11-30). "PM Narendra Modi and French President Francois Hollande to launch game changing solar alliance". The Economic Times. Retrieved 2018-02-11.
- ↑ "International Solar Alliance sign of India's leadership on global stage, say experts - Firstpost". www.firstpost.com. Retrieved 2018-02-11.
- ↑ Neslen, Arthur (2015-12-04). "India Unveils Global Solar Alliance of 120 Countries at Paris Climate Summit". AlterNet. Retrieved 2016-08-06.
- ↑ "Paris climate meet: India-led global solar alliance to counter developed nations". @businessline. Retrieved 2018-02-11.
- ↑ "International Solar Alliance". Wikipedia. 2018-02-08.
- ↑ Livemint (2018-01-23). "WEF Davos 2018 highlights: Narendra Modi warns of three global threats". http://www.livemint.com/. Retrieved 2018-02-08. External link in
|work=(help) - ↑ Technology, Energy Innovation: Policy and. "India Coal Power Is About To Crash: 65% Of Existing Coal Costs More Than New Wind And Solar". Forbes. Retrieved 2018-02-25.
- ↑ "Renewable energy rise forces layoffs at Mitsubishi Hitachi Power". Archived from the original on 2018-01-27.
- 1 2 "India just cancelled 14 huge coal-fired power stations as solar energy prices hit record low". The Independent. 2017-05-23. Retrieved 2018-02-06.
- ↑ "IEEFA Asia: India's Electricity-Sector Transformation Is Happening Now - Institute for Energy Economics & Financial Analysis : Institute for Energy Economics & Financial Analysis". ieefa.org. Retrieved 2018-02-06.
- ↑ Board, The Editorial (2017-05-22). "Opinion | China and India Make Big Strides on Climate Change". The New York Times. ISSN 0362-4331. Retrieved 2018-02-04.
- ↑ "The world's biggest coal company just shut down 37 mines because they are not economically viable anymore". The Independent. 2017-06-21. Retrieved 2018-02-11.
- ↑ http://dawn.com/news/1039608/cm-punjab-approves-quaid-e-azam-park-development-plan
- ↑ http://tribune.com.pk/story/881172/energy-crisis-pm-to-inaugurates-100mw-solar-energy-project
- ↑ http://www.qasolar.com
- ↑ "PH Power Statistics 2012" (PDF). Archived from the original (PDF) on 2015-07-17. Retrieved 2015-04-27.
- ↑ eXenewable Project Profile Page - SinAn, PV, Korea
- ↑ Thailand ignites solar power investment in Southeast Asia Reuters. July 12, 2015. Retrieved 2015-07-24.
- 1 2 Solar Energy in Israel, David Faiman for the Jewish Virtual Library.
- ↑ Bright ideas, Ehud Zion Waldoks, Jerusalem Post, October 1, 2008.
- ↑ At the Zenith of Solar Energy, Neal Sandler,BusinessWeek, March 26, 2008.
- ↑ Wael Mahdi and Marc Roca. "Saudi Arabia Plans $109 Billion Boost for Solar Power." Bloomberg News. May 11, 2012 9:23 AM CT
- ↑ shamspower.ae Shames-website
- ↑ SolarPowerPortal.co.uk UK downgraded to 2.4GW for 2014 as ROC uncertainty bites, 1 October 2014
- ↑ "Worldwide CSP-Solar thermal capacity in 2013: 3,425 megawatts" REN21 (2014). "Renewables 2014: Global Status Report" (PDF). p. 51. Archived (PDF) from the original on 4 September 2014.
- ↑ "Worldwide solar PV capacity in 2013: 138,856 megawatts">"Global Market Outlook for Photovoltaics 2014-2018" (PDF). www.epia.org. EPIA - European Photovoltaic Industry Association. 2014. p. 17. Archived from the original (PDF) on 12 June 2014. Retrieved 12 June 2014.
- ↑ Photovoltaic Barometer
- ↑ "Global Market Outlook for Photovoltaics 2014-2018" (PDF). www.epia.org. EPIA - European Photovoltaic Industry Association. pp. 21, 24, 27, 31. Archived from the original (PDF) on 12 June 2014. Retrieved 12 June 2014.
- ↑ Auteur: ivb (2009-10-29). "Antwerpen wil 2.500 m² zonnepanelen plaatsen op stadsgebouwen - De Standaard". Standaard.be. Retrieved 2012-03-10.
- 1 2 3 Auteur: (2009-12-05). "Katoen Natie heeft grootste installatie zonnepanelen in Eu... - De Standaard". Standaard.be. Retrieved 2012-03-10.
- ↑ "België heeft grootste installatie zonnepanelen van Europa - Planet Watch - De Morgen" (in Dutch). Demorgen.be. Retrieved 2012-03-10.
- ↑ "Installed power in Germany | Energy Charts". www.energy-charts.de. Retrieved 2018-02-21.
- ↑ Bundesnetzagentur – Photovoltaikanlagen: Datenmeldungen sowie EEG-Vergütungssätze (in German)
- ↑ "Changes for solar in Germany". renewablesinternational.net. 3 April 2014. Archived from the original on 12 May 2014. Retrieved 12 May 2014.
- ↑
- ↑ HELAPCO: Total installed capacity January-September 2013
- ↑ HELAPCO: The Greek PV market
- ↑ "+13% le installazioni di fotovoltaico, eolico e idro nei primi 11 mesi del 2017". Infobuild Energia. Retrieved 2018-02-21.
- 1 2 3 4 "Rapporto Statistico 2010" (PDF). Statistiche sulle fonti rinnovabili. Gestore Servizi Energetici (GSE). Retrieved 4 January 2012.
- ↑ Il fotovoltaico in Italia ha una potenza di 17 GW e dà lavoro a 100mila. Quale futuro senza incentivi?
- ↑ Major solar power plant opens in Portugal
- ↑ "Portugal starts huge solar plant". BBC News. 7 June 2006. Retrieved 12 November 2011.
- ↑ World's largest solar power plant to be built
- ↑ Предприятия обяжут покупать «зеленую» электроэнергию Вексельберга http://izvestia.ru/news/532219
- ↑ Overland, Indra; Kjaernet, Heidi (2009). Russian Renewable Energy – The Potential for International Cooperation. Asghate.
- ↑ "Spain expects 3,000 MW in solar plants by 2010". Environmental News Network. September 25, 2008. Retrieved 2011-03-06.
- ↑ "Sunny Spain to Host Europe's First Large Solar Thermal Plant". Environment News Service. June 30, 2006. Retrieved 2011-03-06.
- ↑ "Red Eléctrica de España | Series estadísticas nacionales". www.ree.es (in Spanish). Retrieved 2018-02-06.
- ↑ "National statistical series | Red Eléctrica de España". www.ree.es. Retrieved 2018-02-06.
- ↑ "iea-pvps.org - Annual Reports". www.iea-pvps.org. Retrieved 2018-02-06.
- ↑ Spain pioneers grid-connected solar-tower thermal power Archived September 27, 2007, at the Wayback Machine.
- ↑ Gonzalez, Angel; Keith Johnson (September 8, 2009). "Spain's Solar-Power Collapse Dims Subsidy Model". The Wall Street Journal. Retrieved 2011-03-06.
- ↑ "TÜRKİYE ELEKTRİK SİSTEMİ KURULUŞ ve KAYNAKLARA GÖRE KURULU GÜÇ" (PDF). Retrieved 5 February 2018.
- 1 2 3 Yeganeh Torbati (Feb 9, 2012). "UK wants sustained cuts to solar panel tariffs". Reuters.
- ↑ European Photovoltaic Industry Association (2012). "Market Report 2011". Archived from the original on 2014-07-02.
- ↑ Jonathan Gifford (23 February 2012). "UK hits one GW of PV capacity". PV Magazine. Missing or empty
|url=(help) - ↑ Fiona Harvey (9 February 2012). "Greg Barker: 4m homes will be solar-powered by 2020". The Guardian. London.
- ↑ Department of Energy & Climate Change (May 28, 2015). "Gov.UK Statistics - Solar photovoltaics deployment".
- ↑ "Solar photovoltaics deployment - GOV.UK". www.gov.uk. Retrieved 2018-02-21.
- ↑ Enbridge completes Sarnia solar farm Retrieved 5 October 2010
- 1 2 "Another Sunny Year for Solar Power". Archived from the original on 25 July 2011.
- ↑ Chile connects Latin America's largest solar plant to the national grid, MercoPress, November 14th 2016
- ↑ ERNC report, in CIFES, May 2015
- ↑ Caribbean's largest solar array goes online, gizmag, Stu Robarts, March 31, 2016
- ↑ Solutions, General Energy. "Portfolio - The largest solar project in the Caribbean :: GES - General Energy Solutions". www.gesyw.com. Retrieved 2016-06-10.
- ↑ "Government Committed to Renewable Energy Agenda". Jamaica Information Service. 9 June 2014.
- 1 2 "Grand Palladium Resort unveils largest solar PV plant in Jamaica". JamaicaObserver.com. 1 June 2014. Archived from the original on 2015-06-26. Retrieved 2015-06-26.
- ↑ "Company homepage". Retrieved 26 June 2015.
- ↑ "Jamaica shortlists 78 MW of wind, solar capacity in govt tender". seenews.com. 4 October 2013.
- ↑ "Energy projects in train, set to double renewables in Jamaica". JamaicaObserver.com. 21 September 2014.
- ↑ "WRB Enterprises signs USD 47 million OPIC agreement to build a 20 MW solar PV facility in Jamaica". solarserver.com. 26 June 2015. Archived from the original on 2015-07-01. Retrieved 2015-06-27.
- ↑ "Rainforest invests US$1m in solar energy". JamaicaObserver.com. 3 May 2015.
- ↑ "Cumulative and Newly-Installed Solar Photovoltaics Capacity in Ten Leading Countries and the World, 2009". Earth Policy Institute. 2010-09-21. Retrieved 2010-09-22.
- ↑ "US Solar Market Sets New Record, Installing 7.3GW of Solar PV in 2015". GTM Research. February 22, 2016. Retrieved March 11, 2016.
- ↑ "Solar Market Insight 2015 Q4". Solar Energy Industries Association. March 9, 2016. Retrieved March 11, 2016.
- ↑ "Solar Market Set to Grow 119% in 2016, Installations to Reach 16 GW". Solar Energy Industries Association. March 9, 2016. Retrieved March 11, 2016.
- ↑ US Energy Information Administration, Table 1.1.A. Net Generation by Other Renewable Sources: Total (All Sectors), 2005-December 2015, Table 1.1. Net Generation by Energy Source: Total (All Sectors), 2005-December 2015, accessed 11. Mar 2016.
- ↑ "Solar Surges Past Wind, Hydro as California's No. 1 Renewable Energy Source". KQED News. January 11, 2016. Archived from the original on 2016-03-12. Retrieved March 11, 2016.
- ↑ "California has nearly half of the nation's solar electricity generating capacity". US Energy Information Administration. February 5, 2016. Retrieved March 11, 2016.
- ↑ "Renewable Portfolio Standard Policies - October 2015" (PDF). Database of State Incentives for Renewables & Efficiency. October 2015. Archived from the original (PDF) on 2016-03-12. Retrieved March 11, 2016.
- ↑ "Renewable Portfolio Standards (RPS) with Solar or Distributed Generation Provisions - August 2015" (PDF). Database of State Incentives for Renewables & Efficiency. August 2015. Archived from the original (PDF) on 2015-09-19. Retrieved March 11, 2016.
- ↑ "Solar Industry Data". Solar Energy Industries Association. September 2015. Retrieved March 11, 2016.
- ↑ Masdar and New Zealand to develop solar plant in Solomon Islands, The National (Abu Dhabi), October 23, 2015
- ↑ Masdar completes five solar and wind projects in the Pacific, The National, Abu Dhabi Media, LeAnne Graves, May 17, 2016
- ↑ UAE-Pacific Partnership Fund accomplishes 11 clean energy projects delivered by Masdar Archived 2016-05-17 at the Wayback Machine., Emirates News Agency, 17 May 2016
- ↑ American Samoa embracing more solar power, Radio New Zealand, 28 July 2015
- ↑ "Australian PV market since April 2001". apvi.org.au.
- ↑ CS Energy pulls plug on world's largest "solar booster" project, Renew Economy, Giles Parkinson, 21 March 2016
- ↑ Schoolgen
- ↑ "Vector Hubbards Solar Panels". Archived from the original on 2013-02-08. Retrieved 2013-11-30.
- ↑ Speargrass Domain Plant Profile
- ↑ New Zealand's largest solar power plant
- ↑ Excess power will be purchased at the sale price for two years, otherwise known as net metering.
| Africa | |||||
|---|---|---|---|---|---|
| Asia | |||||
| Europe |
| ||||
| North America | |||||
| Oceania | |||||
| South America | |||||
| |||||