Scottish devolution referendum, 1997
| Scottish devolution referendum, 1997 | ||||||||||||||||||||||
|---|---|---|---|---|---|---|---|---|---|---|---|---|---|---|---|---|---|---|---|---|---|---|
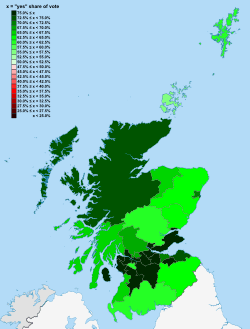
| Do you agree that there should be a Scottish Parliament as proposed by the Government? | ||||||||||||||||||||||
| Location | Scotland | |||||||||||||||||||||
| Date | 11 September 1997 | |||||||||||||||||||||
| ||||||||||||||||||||||
| ||||||||||||||||||||||
| Saturation of colour reflects the strength of the Yes vote in each Council area. | ||||||||||||||||||||||
| Scottish devolution referendum, 1997 | ||||||||||||||||||||||
|---|---|---|---|---|---|---|---|---|---|---|---|---|---|---|---|---|---|---|---|---|---|---|
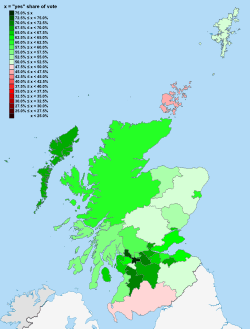
| Do you agree that a Scottish Parliament should have tax-raising powers as proposed by the Government? | ||||||||||||||||||||||
| Location | Scotland | |||||||||||||||||||||
| Date | 11 September 1997 | |||||||||||||||||||||
| ||||||||||||||||||||||
| ||||||||||||||||||||||
| Saturation of colour reflects the strength of the Yes vote in each Council area. | ||||||||||||||||||||||
 |
|---|
| This article is part of a series on the politics and government of Scotland |
|
Intergovernmental relations |
|
|
The Scottish devolution referendum of 1997 was a pre-legislative referendum held in Scotland on 11 September 1997 over whether there was support for the creation of a Scottish Parliament with devolved powers, and whether the Parliament should have tax-varying powers. The result was 'Yes–Yes': a majority voted in favour of both proposals, and the Parliament was established following an election in 1999. Turnout for the referendum was 60.4%.
The referendum was a Labour manifesto commitment and was held in their first term after the 1997 UK general election under the provisions of the Referendums (Scotland & Wales) Act 1997. It was the second referendum held in Scotland over the question of devolution, the first being in 1979, and is to date the only major referendum to be held in any part of the United Kingdom where voters were asked two questions in the same plebiscite.
Background
A referendum was held in 1979 under a Labour government which stipulated that a Scottish Assembly would come into being if the referendum had been supported by 50% of votes cast plus a controversial rule whereby at least 40% of the electorate had to vote in favour. Although 51.6% voted in favour, this was only 32.9% of the electorate so the Assembly was not brought into being. Shortly afterwards, the predominantly anti-devolution-led Conservative Party won the United Kingdom general election, 1979.
.svg.png)
The Campaign for a Scottish Assembly was formed afterwards to continue the campaign. They brought together a committee of "prominent Scots" who drafted the document "A Claim of Right for Scotland". The "Claim" was published in 1988 and signed by most Scottish politicians, local councils, trade unions and churches.
It was agreed to form a Scottish Constitutional Convention made up of all existing MPs and councillors. This was done despite the opposition of the national government of the time of John Major. Because the Labour Party had a clear majority within the convention the Scottish National Party withdrew.[1]
The Labour Party included the establishment of a Scottish Parliament in its manifesto for the United Kingdom general election, 1997, which they won with a landslide majority of 179.
Referendum questions
The electorate was asked to vote on two sets of statements which corresponded to both proposals.[2]
On the first ballot paper the following appeared:
Parliament has decided to consult people in Scotland on the Government's proposals for a Scottish Parliament:
or
(To be marked by a single (X))
On the second ballot paper the following appeared:
Parliament has decided to consult people in Scotland on the Government's proposals for a Scottish Parliament to have tax varying powers:
or
(To be marked by a single (X))
Campaign
Scottish Labour, the SNP, Liberal Democrats, and Scottish Greens campaigned for a 'Yes' vote for both proposals whilst the Conservatives opposed both proposals. Labour MP Tam Dalyell opposed the creation of the Parliament, but in favour of giving such a Parliament the power to raise and lower taxes on the basis that, although he opposed the Parliament as proposed by his party, if it did exist it should have tax-varying powers.[3]
The official Yes campaign, Scotland Forward (styled "Scotland FORward"), was headed by the businessman Nigel Smith and came out of the groups that had previously formed the Scottish Constitutional Convention, along with the Scottish National Party. It was supported by the Labour, SNP, Liberal Democrat and Green parties.[4]
The official No campaign, Think Twice, was headed by Brian Monteith, a former employee of the Scottish Conservative MP, Michael Forsyth. Board members included Donald Findlay, a QC, Rector of the University of St Andrews and vice-chairman of Rangers F.C., and senior Conservative peer Lord Fraser. However, it struggled to get much business support as they were wary of opposing a project that had such support from the new government which had a large majority.[4]
Campaigning in the referendum was suspended between the death and funeral of Diana, Princess of Wales.[5] It was speculated that the Scottish referendum could have been postponed, but this would have required a recall of the UK Parliament and an amendment to the Referendums Act.[5]
Opinion polling
Scottish Parliament
| Date(s) conducted |
Polling organisation/client | Sample size | Agree | Disagree | Undecided | Lead | ||||
|---|---|---|---|---|---|---|---|---|---|---|
| 11 Sep 1997 | Scottish devolution referendum, 1997 results | 2,401,431 | 74.3% | 25.7% | 48.6% | |||||
| 10 Sep | ICM/Scotsman | — | 63% | 25% | 12% | 38% | ||||
| 8 Sep | MORI/STV | — | 67% | 22% | 11% | 45% | ||||
| 6–7 Sep | System Three/Herald | 1,039 | 61% | 20% | 19% | 41% | ||||
| 7 Sep | NOP/Sunday Times | — | 63% | 21% | 16% | 42% | ||||
| 7 Sep | ICM/Scotsman | 1,010 | 60% | 25% | 15% | 35% | ||||
| 31 Aug | Death of Diana, Princess of Wales. | |||||||||
| 21-26 Aug | System Three/Herald | 1,039 | 61% | 23% | 16% | 38% | ||||
| 24-29 Jul | System Three/Herald | 1,024 | 65% | 19% | 16% | 46% | ||||
| 26 Jun – 1 Jul | System Three/Herald | 978 | 68% | 21% | 10% | 47% | ||||
| 22–27 May | System Three/Herald | 1,024 | 64% | 21% | 15% | 43% | ||||
Tax-varying powers
| Date(s) conducted |
Polling organisation/client | Sample size | Agree | Disagree | Undecided | Lead | ||||
|---|---|---|---|---|---|---|---|---|---|---|
| 11 Sep 1997 | Scottish devolution referendum, 1997 results | 2,402,165 | 63.5% | 36.5% | 27.0% | |||||
| 10 Sep | ICM/Scotsman | — | 48% | 40% | 12% | 8% | ||||
| 8 Sep | MORI/STV | — | 45% | 31% | 24% | 14% | ||||
| 6–7 Sep | System Three/Herald | 1,039 | 45% | 31% | 24% | 14% | ||||
| 7 Sep | NOP/Sunday Times | — | 51% | 34% | 15% | 17% | ||||
| 7 Sep | ICM/Scotsman | 1,010 | 45% | 38% | 17% | 7% | ||||
| 31 Aug | Death of Diana, Princess of Wales. | |||||||||
| 21–26 Aug | System Three/Herald | 1,039 | 47% | 32% | 21% | 15% | ||||
| 24–29 Jul | System Three/Herald | 1,024 | 54% | 27% | 18% | 27% | ||||
| 26 Jun – 1 Jul | System Three/Herald | 978 | 56% | 26% | 18% | 30% | ||||
| 22–27 May | System Three/Herald | 1,024 | 53% | 28% | 19% | 25% | ||||
Results
The result was 'Yes-Yes': the majority voted 'I agree' in favour of both proposals.[2] Two council areas had an overall "Yes-No" result - Dumfries & Galloway and Orkney. More votes were cast for the first question than the second in all regions (except Fife), with substantially more spoilt ballots for the second question, perhaps due to voter confusion over the two papers.[6]
Question 1
| Choice | Votes | % |
|---|---|---|
| 1,775,045 | 74.29 | |
| I do not agree that there should be a Scottish Parliament | 614,400 | 25.71 |
| Valid votes | 2,389,445 | 99.50 |
| Invalid or blank votes | 11,986 | 0.50 |
| Total votes | 2,401,431 | 100.00 |
| Registered voters and turnout | 3,973,673 | 60.43 |
| Agree: 1,775,045 (74.3%) |
Disagree: 614,400 (25.7%) | ||
| ▲ | |||
By council area
| Council area | Votes | Proportion of votes | ||
|---|---|---|---|---|
| Agree | Disagree | Agree | Disagree | |
| Aberdeen City | 65,035 | 25,580 | 71.8% | 28.2% |
| Aberdeenshire | 61,621 | 34,878 | 63.9% | 36.1% |
| Angus | 33,571 | 18,350 | 64.7% | 35.3% |
| Argyll and Bute | 30,452 | 14,796 | 67.3% | 32.7% |
| Clackmannanshire | 18,790 | 4,706 | 80.0% | 20.0% |
| Dumfries and Galloway | 44,619 | 28,863 | 60.7% | 39.3% |
| Dundee City | 49,252 | 15,553 | 76.0% | 24.0% |
| East Ayrshire | 49,131 | 11,426 | 81.1% | 18.9% |
| East Dunbartonshire | 40,917 | 17,725 | 69.8% | 30.2% |
| East Lothian | 33,525 | 11,665 | 74.2% | 25.8% |
| East Renfrewshire | 28,253 | 17,573 | 61.7% | 38.3% |
| City of Edinburgh | 155,900 | 60,832 | 71.9% | 28.1% |
| Falkirk | 55,642 | 13,953 | 80.0% | 20.0% |
| Fife | 125,668 | 39,517 | 76.1% | 23.9% |
| Glasgow City | 204,269 | 40,106 | 83.6% | 16.4% |
| Highland | 72,551 | 27,431 | 72.6% | 27.4% |
| Inverclyde | 31,680 | 8,945 | 78.0% | 22.0% |
| Midlothian | 31,681 | 7,979 | 79.9% | 20.1% |
| Moray | 24,822 | 12,122 | 67.2'% | 32.8% |
| North Ayrshire | 51,304 | 15,931 | 76.3% | 23.7% |
| North Lanarkshire | 123,063 | 26,010 | 82.6% | 17.4% |
| Perth and Kinross | 40,344 | 24,998 | 61.7% | 38.3% |
| Renfrewshire | 68,711 | 18,213 | 79.0% | 21.0% |
| Scottish Borders | 33,855 | 20,060 | 62.8% | 37.2% |
| South Ayrshire | 40,161 | 19,909 | 66.9% | 33.1% |
| South Lanarkshire | 114,908 | 32,762 | 77.8% | 22.2% |
| Stirling | 29,190 | 13,440 | 68.5% | 31.5% |
| West Dunbartonshire | 39,051 | 7,058 | 84.7% | 15.3% |
| West Lothian | 56,923 | 14,614 | 79.6% | 20.4% |
| Na h-Eileanan Siar (Western Isles) | 9,977 | 2,589 | 79.4% | 20.6% |
| Orkney | 4,749 | 3,541 | 57.3% | 42.7% |
| Shetland | 5,430 | 3,275 | 62.4% | 37.6% |
Question 2
| Choice | Votes | % |
|---|---|---|
| 1,512,889 | 63.48 | |
| I do not agree that a Scottish Parliament should have tax-varying powers | 870,263 | 36.52 |
| Valid votes | 2,383,152 | 99.21 |
| Invalid or blank votes | 19,013 | 0.79 |
| Total votes | 2,402,165 | 100.00 |
| Registered voters and turnout | 3,973,673 | 60.45 |
| Agree: 1,512,889 (63.5%) |
Disagree: 870,263 (36.5%) | ||
| ▲ | |||
By council area
| Council area | Votes | Proportion of votes | ||
|---|---|---|---|---|
| Agree | Disagree | Agree | Disagree | |
| Aberdeen City | 54,320 | 35,709 | 60.3% | 39.7% |
| Aberdeenshire | 50,295 | 45,929 | 52.3% | 47.7% |
| Angus | 27,641 | 24,089 | 53.4% | 46.6% |
| Argyll and Bute | 25,746 | 19,429 | 57.0% | 43.0% |
| Clackmannanshire | 16,112 | 7,355 | 68.7% | 31.3% |
| Dumfries and Galloway | 35,737 | 37,499 | 48.8% | 51.2% |
| Dundee City | 42,304 | 22,280 | 65.5% | 34.5% |
| East Ayrshire | 42,559 | 17,824 | 70.5% | 29.5% |
| East Dunbartonshire | 34,576 | 23,914 | 59.1% | 40.9% |
| East Lothian | 28,152 | 16,765 | 62.7% | 37.3% |
| East Renfrewshire | 23,580 | 22,153 | 51.6% | 48.4% |
| City of Edinburgh | 133,843 | 82,188 | 62.0% | 38.0% |
| Falkirk | 48,064 | 21,403 | 69.2% | 30.8% |
| Fife | 108,021 | 58,987 | 64.7% | 35.3% |
| Glasgow City | 182,589 | 60,842 | 75.0% | 25.0% |
| Highland | 61,359 | 37,525 | 62.1% | 37.9% |
| Inverclyde | 27,194 | 13,277 | 67.2% | 32.8% |
| Midlothian | 26,776 | 12,762 | 67.7% | 32.3% |
| Moray | 19,326 | 17,344 | 52.7% | 47.3% |
| North Ayrshire | 43,990 | 22,991 | 65.7% | 34.3% |
| North Lanarkshire | 107,288 | 41,372 | 72.2% | 27.8% |
| Perth and Kinross | 33,398 | 31,709 | 51.3% | 48.7% |
| Renfrewshire | 55,075 | 31,537 | 63.6% | 36.4% |
| Scottish Borders | 27,284 | 26,487 | 50.7% | 49.3% |
| South Ayrshire | 33,679 | 26,217 | 56.2% | 43.8% |
| South Lanarkshire | 99,587 | 47,708 | 67.6% | 32.4% |
| Stirling | 25,044 | 17,487 | 58.9% | 41.1% |
| West Dunbartonshire | 34,408 | 11,628 | 74.7% | 25.3% |
| West Lothian | 47,990 | 23,354 | 67.3% | 32.7% |
| Na h-Eileanan Siar (Western Isles) | 8,557 | 3,947 | 68.4% | 31.6% |
| Orkney | 3,917 | 4,344 | 47.4% | 52.6% |
| Shetland | 4,478 | 4,198 | 51.6% | 48.4% |
Votes in favour of tax-varying powers still commanded significant majority, when compared to establishing the Parliament per se. A majority voted 'I agree' in every local council, apart from in Dumfries & Galloway[7] and Orkney.[8]
Overall turnout by council area
| Council area | Turnout |
|---|---|
| Aberdeen City | 53.7% |
| Aberdeenshire | 57.0% |
| Angus | 60.2% |
| Argyll & Bute | 65.0% |
| Clackmannanshire | 66.1% |
| Dumfries & Galloway | 63.4% |
| Dundee City | 55.7% |
| East Ayrshire | 64.8% |
| East Dunbartonshire | 72.2% |
| East Lothian | 65.0% |
| East Renfrewshire | 68.2% |
| City of Edinburgh | 60.1% |
| Falkirk | 63.7% |
| Fife | 60.7% |
| Glasgow City | 51.6% |
| Highland | 60.3% |
| Inverclyde | 60.4% |
| Midlothian | 65.1% |
| Moray | 57.8% |
| North Ayrshire | 63.4% |
| North Lanarkshire | 60.8% |
| Perth & Kinross | 63.5% |
| Renfrewshire | 62.8% |
| Scottish Borders | 64.8% |
| South Ayrshire | 66.7% |
| South Lanarkshire | 63.1 % |
| Stirling | 65.8% |
| West Dunbartonshire | 63.7% |
| West Lothian | 60.4% |
| Na h-Eileanan Siar (Western Isles) | 55.8% |
| Orkney | 53.5% |
| Shetland | 51.5% |
Outcome
In response to the majority voting for 'Yes' to both proposals, the UK Parliament passed the Scotland Act 1998. This established a Scottish Parliament for the first time since the adjournment of the pre-Union Parliament of Scotland in 1707. The devolved Parliament convened for the first time in May 1999, following its first election. The Scotland Act 1998 also created the Scottish Executive, later to become known as the Scottish Government.
See also
References
- ↑ The most influential document this century, The Herald
- 1 2 "Scottish Referendum Live - The Results". BBC News. BBC. Retrieved 28 July 2016.
- ↑ "Dissent Within the Labour Party". BBC News. BBC.
- 1 2 "BBC Briefing". BBC News. BBC.
- 1 2 "Referendum Campaign Is Suspended As A Mark Of Respect". BBC News. BBC. Retrieved 17 January 2017.
- ↑ Results of Devolution Referendums 1979 & 1997, House of Commons Library paper RP97-113
- ↑ Result – Dumfries and Galloway, BBC, 1997
- ↑ Result – Orkney Islands, BBC, 1997
| Scottish elections | |
|---|---|
| UK elections |
|
| Local elections | |
| Referendums | |
| Local referendums | |
| County council elections |
|
|---|---|
| Unitary authorities |
|
| District councils (England) |
|
| District councils (Northern Ireland) |
|
| Sui generis |
|
| Referendums | |
| |
Devolution in the United Kingdom | |||||||||||||
|---|---|---|---|---|---|---|---|---|---|---|---|---|---|
| Devolved areas |
| ||||||||||||
| Referendums1 | |||||||||||||
| Heads of devolved governments | |||||||||||||
| Devolved legislatures2 | |||||||||||||
| Devolved administrations3 | |||||||||||||
| Organisations and laws of the legislatures and governments of the UK and the devolved areas |
| ||||||||||||
| Elections | |||||||||||||
| Related articles |
| ||||||||||||
1. Rejected referendums are italicised. The others were fully or partially approved. 2. There is no law-making body for any regionally devolved area. 3. Administrations of regionally devolved areas are omitted. | |||||||||||||