Scottish regional elections, 1994
|
| |||||||||||||||||||||||||||||||||||||||||||||||||||||
| |||||||||||||||||||||||||||||||||||||||||||||||||||||
453 councillors on 12 Regional Councils in Scotland | |||||||||||||||||||||||||||||||||||||||||||||||||||||
|---|---|---|---|---|---|---|---|---|---|---|---|---|---|---|---|---|---|---|---|---|---|---|---|---|---|---|---|---|---|---|---|---|---|---|---|---|---|---|---|---|---|---|---|---|---|---|---|---|---|---|---|---|---|
| |||||||||||||||||||||||||||||||||||||||||||||||||||||
 Colours denote the winning party with outright control | |||||||||||||||||||||||||||||||||||||||||||||||||||||
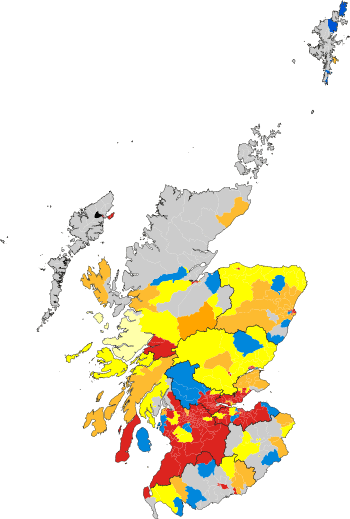 Results by ward | |||||||||||||||||||||||||||||||||||||||||||||||||||||
.jpg)


Regional elections were held in Scotland on 5 May 1994, as part of the Local Government (Scotland) Act 1973. These were the last elections before 29 new mainland unitary authorities, established by the Local Government etc. (Scotland) Act 1994, came into effect. The councils up for election were last contested in Scottish regional elections, 1990, and vote and seat changes are compared to the 1990 results.
National results
Summary of the 5 May 1994 Scottish council election results[1][2]
| Parties | votes | % | Seats | |
|---|---|---|---|---|
| Labour | 704,604 | 41.8 | 220 | |
| SNP | 458,951 | 26.8 | 73 | |
| Conservative | 234,840 | 13.7 | 31 | |
| Liberal Democrats | 208,349 | 12.2 | 60 | |
| Independent | 80,092 | 4.2 | 65 | |
| Independent Labour | 4,064 | 1 | ||
| Communist | 1,839 | 1 | ||
| Independent Liberal Democrat | 885 | 1 | ||
| Liberal | 0 | 1 | ||
| Scottish Militant Labour | 11,476 | 0.7 | 0 | |
| People Pension Power | 313 | 0 | ||
| Monster Raving Loony | 185 | 0 | ||
| Natural Law | 124 | 0 | ||
| Ind. Conservative | 97 | 0 | ||
| SDP | 82 | 0 | ||
| James Connolly Society | 76 | 0 | ||
| Doctor Slug Party | 43 | 0 | ||
| Scottish Republican Socialist | 38 | 0 | ||
| Scottish Christian Democratic | 32 | 0 | ||
| Total | 1,706,090 | 45.1 | 453 | |
- Turnout 45.1%
- Change since last election -0.8%
- The Liberal candidate was returned unopposed
Results by council area
| Council | 1990 result | National control (based on 1992 results) |
1994 result | Turnout | Details | ||
|---|---|---|---|---|---|---|---|
| Borders | Independent | No overall control | 42 | Details | |||
| Central | Labour | Labour | 49.7 | Details | |||
| Dumfries and Galloway | Independent | No overall control | 47.9 | Details | |||
| Fife | Labour | Labour | 45.7 | Details | |||
| Grampian | No overall control | No overall control | 41.6 | Details | |||
| Highland | Independent | Independent | 45.3 | Details | |||
| Lothian | Labour | Labour | 47.8 | Details | |||
| Orkney | Independent | Independent | Details | ||||
| Shetland | Independent | Independent | Details | ||||
| Strathclyde | Labour | Labour | 44.4 | Details | |||
| Tayside | No overall control | Independent | No overall control | 45.5 | Details | ||
| Na h-Eileanan Siar (Western Isles) | Independent | Independent | Independent | Details | |||
References
- ↑ Denver, David; Bochel, Hugh (Winter 2000), "The Forgotten Elections: The Scottish Council Elections of 1999", Scottish Affairs (PDF), 30
- ↑ p.49
| Scottish elections | |
|---|---|
| UK elections |
|
| Local elections | |
| Referendums | |
| Local referendums | |
| London boroughs |
|
|---|---|
| Metropolitan boroughs |
|
| District councils (England) |
|
| Regional councils (Scotland) |
|
| Referendum | |
| |
This article is issued from
Wikipedia.
The text is licensed under Creative Commons - Attribution - Sharealike.
Additional terms may apply for the media files.