Newham London Borough Council election, 2002
| ||||||||||||||||||||||
All 60 council seats to Newham London Borough Council 31 seats needed for a majority | ||||||||||||||||||||||
|---|---|---|---|---|---|---|---|---|---|---|---|---|---|---|---|---|---|---|---|---|---|---|
| ||||||||||||||||||||||
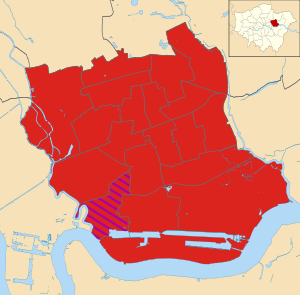 Map of the results of the 2002 Newham council election. Christian Peoples Alliance in purple and Labour in red. | ||||||||||||||||||||||
| ||||||||||||||||||||||
Elections to Newham London Borough Council were held in May 2002. The whole council was up for election. Turnout was 25.49%. Labour won all but one seat. The sole opposition councillor was Alan Craig of the Christian Peoples Alliance.
Election result
| Party | Seats | Gains | Losses | Net gain/loss | Seats % | Votes % | Votes | +/− | |
|---|---|---|---|---|---|---|---|---|---|
| Labour | 59 | 0 | 1 | -1 | 98.3 | 49.3 | 23,965 | ||
| Conservative | 0 | 0 | 0 | 0 | 19.9 | 9,678 | |||
| Green | 0 | 0 | 0 | 0 | 12.3 | 5,993 | |||
| Christian Peoples | 1 | 1 | 0 | +1 | 1.7 | 4.5 | 2,178 | ||
| Liberal Democrat | 0 | 0 | 0 | 0 | 3.9 | 1,917 | |||
| Independent | 0 | 0 | 0 | 0 | 3.8 | 1,849 | |||
| Newham Independents Association | 0 | 0 | 0 | 0 | 2.2 | 1,060 | |||
| Socialist Alliance | 0 | 0 | 0 | 0 | 1.9 | 906 | |||
| BNP | 0 | 0 | 0 | 0 | 1.5 | 736 | |||
| UKIP | 0 | 0 | 0 | 0 | 0.5 | 233 | |||
| Socialist Labour | 0 | 0 | 0 | 0 | 0.3 | 122 | |||
References
- ↑ "Election Results". London Councils. 8 May 2010. Retrieved 23 May 2010.
- ↑ http://www.andrewteale.me.uk/leap/results/2002/16/
| Mayor of London | |
|---|---|
| London Assembly | |
| Inner London Education Authority | |
| Greater London Council | |
| London County Council | |
| Borough Councils | |
| Referendums | |
| |
This article is issued from
Wikipedia.
The text is licensed under Creative Commons - Attribution - Sharealike.
Additional terms may apply for the media files.