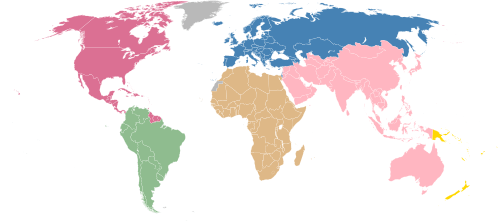
National team appearances in the FIFA World Cup
.png)
The FIFA World Cup is an international association football competition contested by the senior men's national teams of the members of the International Federation of Association Football (FIFA, Fédération Internationale de Football Association). The championship has been awarded every four years since the inaugural tournament in 1930, with the exception of 1942 and 1946 when it was not held due to the Second World War.[1] The competition originally featured 16 teams, and later 24, before settling on its current format of 32 teams starting with the 1998 tournament.[2] Teams initially compete in a group stage, with the final 16 progressing to knockout stages to decide the winner.[3]
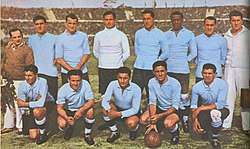
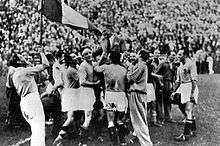
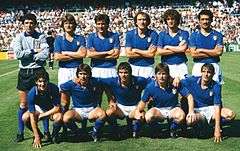
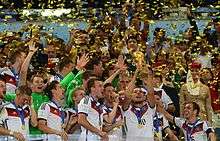
As of the 2018 FIFA World Cup, 79 national teams have competed at the final tournaments.[4] Brazil are the only team to have appeared in all 21 tournaments to date, with Germany having participated in 19, Italy in 18, Argentina in 17 and Mexico in 16.[5] To date, eight nations have won the tournament. The inaugural winners in 1930 were Uruguay; the current champions are France. The most successful nation in the competition are currently Brazil, who have won the cup on five occasions.[6] Five teams have appeared in FIFA World Cup finals without winning,[7] while twelve more have appeared in semi-finals.[8]
Ranking of teams by number of appearances
- Breakdown of successor teams
| Team | # of appearances | Record streak | Active streak | Debut | Most recent | Best result (* hosts) |
|---|---|---|---|---|---|---|
| 1 | 1 | 0 | 2006 | 2006 | Round 1 | |
| 8 | 3 | 0 | 1934 | 1990 | Runners-up (1934, 1962) |
| Team | # of appearances | Record streak | Active streak | Debut | Most recent | Best result (* hosts) |
|---|---|---|---|---|---|---|
| 7 | 7 | 7 | 1994 | 2018 | Champions (2014) | |
| 10 | 10 | 0 | 1954 | 1990 | Champions (1954, 1974*, 1990) | |
| 1 | 1 | 0 | 1974 | 1974 | Quarterfinals (1974 (top 8)) | |
| 2 | 2 | 0 | 1934 | 1938 | Third place (1934) |
| Team | # of appearances | Record streak | Active streak | Debut | Most recent | Best result (* hosts) |
|---|---|---|---|---|---|---|
| 4 | 2 | 2 | 1994 | 2018 | Quarterfinals (2018*) | |
| 7 | 4 | 0 | 1958 | 1990 | Fourth place (1966) |
| Team | # of appearances | Record streak | Active streak | Debut | Most recent | Best result (* hosts) |
|---|---|---|---|---|---|---|
| 2 | 1 | 1 | 2010 | 2018 | Round 1 | |
| 1 | 1 | 0 | 2006 | 2006 | Round 1 | |
| 1 | 1 | 0 | 1998 | 1998 | Round 2 (1998) | |
| 7 | 4 | 0 | 1950 | 1990 | Fourth place (1962) | |
| 1 | 1 | 0 | 1930 | 1930 | Fourth place (1930[lower-alpha 2]) |
Overall team records
As per statistical convention in football, matches decided in extra time are counted as wins and losses, while matches decided by penalty shoot-outs are counted as draws. 3 points per win, 1 point per draw and 0 points per loss.
Source: [9]
- Breakdown of successor teams
| Team | Pld | W | D | L | GF | GA | GD | Points |
|---|---|---|---|---|---|---|---|---|
| 30 | 11 | 5 | 14 | 44 | 45 | −1 | 38 | |
| 3 | 1 | 0 | 2 | 3 | 4 | −1 | 3 |
| Team | Pld | W | D | L | GF | GA | GD | Points |
|---|---|---|---|---|---|---|---|---|
| 6 | 3 | 1 | 2 | 14 | 13 | +1 | 10 | |
| 62 | 36 | 14 | 12 | 131 | 77 | +54 | 122 | |
| 40 | 28 | 5 | 7 | 81 | 33 | +48 | 89 |
| Team | Pld | W | D | L | GF | GA | GD | Points |
|---|---|---|---|---|---|---|---|---|
| 31 | 15 | 6 | 10 | 53 | 34 | +19 | 51 | |
| 14 | 4 | 4 | 6 | 24 | 20 | +4 | 16 |
| Team | Pld | W | D | L | GF | GA | GD | Points |
|---|---|---|---|---|---|---|---|---|
| 3 | 2 | 0 | 1 | 7 | 7 | 0 | 6 | |
| 30 | 12 | 7 | 11 | 48 | 35 | +13 | 43 | |
| 4 | 2 | 1 | 1 | 5 | 4 | +1 | 7 | |
| 3 | 0 | 0 | 3 | 2 | 10 | –8 | 0 | |
| 6 | 2 | 0 | 4 | 4 | 7 | -3 | 6 |
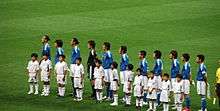
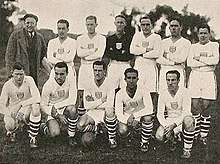
Debuts by tournament
.jpg)
.jpg)
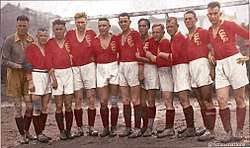
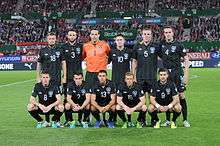


The inaugural FIFA World Cup tournament in 1930 featured 13 teams.[10] Since then, every instance of the competition has featured at least one team making their debut appearance.
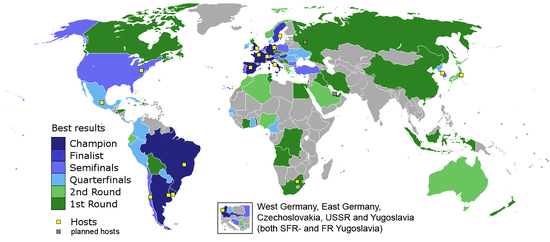
Comprehensive team results by tournament
- Legend
- 1st — Champions
- 2nd — Runners-up
- 3rd — Third place
- 4th — Fourth place
- QF — Quarterfinals (1934–1938, 1954–1970, and 1986–present: knockout round of 8)
- R2 — Round 2 (1974–1978, second group stage, top 8; 1982: second group stage, top 12; 1986–2022: knockout round of 16)
- R1 — Round 1 (1930, 1950-1970 and 1986-present: group stage; 1934-1938: knockout round of 16; 1974-1982: first group stage)
- q — Qualified for upcoming tournament
- •• — Qualified but withdrew
- • — Did not qualify
- × — Did not enter / Withdrew / Banned / Entry not accepted by FIFA
- — Hosts
- — Not affiliated to FIFA
- % — Success rate of reaching the World Cup Finals, only counting the times the team entered the tournament
The team ranking in each tournament is according to FIFA.[11] The rankings, apart from the top four positions (top two in 1930), are not a result of direct competition between the teams; instead, teams eliminated in the same round are ranked by their full results in the tournament. In recent tournaments, FIFA has used its world rankings for seeding in the final tournament draw.[12]
For each tournament, the number of teams in each finals tournament are shown (in parentheses).
| Team |
1930 (13) |
1934 (16) |
1938 (15) |
1950 (13) |
1954 (16) |
1958 (16) |
1962 (16) |
1966 (16) |
1970 (16) |
1974 (16) |
1978 (16) |
1982 (24) |
1986 (24) |
1990 (24) |
1994 (24) |
1998 (32) |
2002 (32) |
2006 (32) |
2010 (32) |
2014 (32) |
2018 (32) |
2022 (32) |
2026 (48) |
Total partici- pations |
Qualifying percentage |
|---|---|---|---|---|---|---|---|---|---|---|---|---|---|---|---|---|---|---|---|---|---|---|---|---|---|
| Part of France | × | • | • | • | R1 13th | R1 22nd | • | • | • | • | • | R1 28th | R2 14th | • | TBD | TBD | 4/13 | 30.8 | |||||||
| Part of Portugal | × | • | • | • | • | • | R1 23rd | • | • | • | TBD | TBD | 1/9 | 11.1 | |||||||||||
| 2nd | R1 T-9th | × | × | × | R1 13th | R1 10th | QF 5th | • | R2 8th | 1st | R2 11th | 1st | 2nd | R2 10th | QF 6th | R1 18th | QF 6th | QF 5th | 2nd | R2 16th | TBD | TBD | 17/18 | 94.4 | |
| × | × | × | × | × | × | × | • | • | R1 14th | • | • | • | • | • | • | • | R2 16th | R1 21st | R1 30th | R1 30th | TBD | TBD | 5/14 | 35.7 | |
| × | 4th | ••[lower-alpha 8] | × | 3rd | R1 15th | × | • | • | • | R2 7th | R2 8th | • | R1 T-18th | • | R1 23rd | • | • | • | • | • | TBD | TBD | 7/18 | 38.9 | |
| R1 11th | R1 15th | R1 13th | × | R1 12th | • | • | • | R1 T-10th | • | • | R2 10th | 4th | R2 11th | R2 11th | R1 19th | R2 14th | • | • | QF 6th | 3rd | TBD | TBD | 13/20 | 65 | |
| R1 12th | × | × | R1 13th | × | • | • | • | • | • | • | • | • | • | R1 21st | • | • | • | • | • | • | TBD | TBD | 3/18 | 16.7 | |
| Part of Yugoslavia[lower-alpha 1] | × | • | • | • | • | R1 20th | • | TBD | TBD | 1/6 | 16.7 | ||||||||||||||
| R1 6th | R1 14th | 3rd | 2nd | QF 5th | 1st | 1st | R1 11th | 1st | 4th | 3rd | R2 5th | QF 5th | R2 9th | 1st | 2nd | 1st | QF 5th | QF 6th | 4th | QF 6th | TBD | TBD | 21/21 | 100 | |
| × | • | • | × | • | • | R1 15th | R1 15th | R1 13th | R1 12th | • | • | R2 15th | • | 4th | R1 29th | • | • | • | • | • | TBD | TBD | 7/19 | 36.8 | |
| Part of France | × | × | • | • | • | R1 17th | • | QF 7th | R1 22nd | R1 25th | R1 20th | • | R1 31st | R1 32nd | • | TBD | TBD | 7/13 | 53.8 | ||||||
| × | × | × | × | × | • | × | × | • | • | • | • | R1 24th | • | • | • | • | • | • | • | • | TBD | q | 1/14 | 7.1 | |
| R1 5th | × | × | R1 9th | • | • | 3rd | R1 T-13th | • | R1 11th | • | R1 22nd | • | • | × | R2 16th | • | • | R2 10th | R2 9th | • | TBD | TBD | 9/18 | 50 | |
| Republic of China | × | × | • | × | × | × | × | × | • | • | • | • | • | R1 31st | • | • | • | • | TBD | TBD | 1/11 | 9.1 | |||
| × | × | × | • | R1 14th | • | • | • | • | • | • | R2 14th | R1 19th | R1 21st | • | • | • | QF 5th | R2 9th | TBD | TBD | 6/16 | 37.5 | |||
| × | × | × | × | × | • | • | • | • | • | • | • | • | R2 13th | • | • | R1 19th | R1 31st | • | QF 8th | R1 29th | TBD | TBD | 5/16 | 31.3 | |
| Part of Yugoslavia[lower-alpha 1] | × | 3rd | R1 23rd | R1 22nd | • | R1 19th | 2nd | TBD | TBD | 5/6 | 83.3 | ||||||||||||||
| • | QF 8th | • | × | × | × | • | × | × | • | • | × | • | × | • | • | • | • | • | • | TBD | TBD | 1/13 | 7.7 | ||
| × | 2nd | QF 5th | × | R1 14th | R1 9th | 2nd | • | R1 15th | • | • | R1 19th | • | QF 6th | • | • | • | R1 20th | • | • | • | TBD | TBD | 9/19 | 47.4 | |
| × | × | × | × | × | • | × | • | • | • | • | • | R2 9th | • | • | QF 8th | R2 10th | • | R1 24th | • | R2 11th | TBD | TBD | 5/15 | 33.3 | |
| Part of Belgium | × | × | R1 16th | × | • | • | • | • | • | • | • | • | • | • | TBD | TBD | 1/12 | 9.1 | |||||||
| Part of Germany | × | × | • | • | • | • | R2 6th | • | • | • | • | Part of Germany | 1/9 | 11.1 | |||||||||||
| × | × | × | × | × | × | • | • | • | • | • | • | • | • | • | • | R1 24th | R2 12th | • | R1 17th | • | TBD | TBD | 3/15 | 20 | |
| × | R1 13th | × | × | • | × | × | × | × | • | • | • | • | R1 20th | • | • | • | • | • | • | R1 31st | TBD | TBD | 3/14 | 21.4 | |
| Team | 1930 (13) |
1934 (16) |
1938 (15) |
1950 (13) |
1954 (16) |
1958 (16) |
1962 (16) |
1966 (16) |
1970 (16) |
1974 (16) |
1978 (16) |
1982 (24) |
1986 (24) |
1990 (24) |
1994 (24) |
1998 (32) |
2002 (32) |
2006 (32) |
2010 (32) |
2014 (32) |
2018 (32) |
2022 (32) |
2026 (48) |
Total partici- pations |
Qualifying percentage |
| × | × | × | × | × | × | R1 16th | • | • | R1 24th | • | • | • | • | • | • | • | • | • | TBD | TBD | 2/13 | 15.4 | |||
| × | × | × | R1 8th | QF 6th | R1 11th | QF 8th | 1st | QF 8th | • | • | R2 6th | QF 8th | 4th | • | R2 9th | QF 6th | QF 7th | R2 13th | R1 26th | 4th | TBD | TBD | 15/18 | 83.3 | |
| R1 7th | R1 T-9th | QF 6th | •• | R1 11th | 3rd | • | R1 T-13th | • | • | R1 12th | 4th | 3rd | • | • | 1st | R1 28th | 2nd | R1 29th | QF 7th | 1st | TBD | TBD | 15/21 | 71.4 | |
| × | 3rd | R1 10th | × | 1st | 4th | QF 7th | 2nd | 3rd | 1st | R2 6th | 2nd | 2nd | 1st | QF 5th | QF 7th | 2nd | 3rd | 3rd | 1st | R1 22nd | TBD | TBD | 19/19 | 100 | |
| Part of the United Kingdom | × | • | × | • | • | • | × | • | • | • | • | • | R2 13th | QF 7th | R1 25th | • | TBD | TBD | 3/13 | 23.1 | |||||
| × | • | • | × | • | • | • | • | • | • | • | • | • | • | R1 24th | • | • | • | R1 25th | R2 13th | • | TBD | TBD | 3/19 | 15.8 | |
| • | × | × | • | × | × | × | • | R1 15th | • | • | • | × | • | • | • | • | • | • | • | TBD | TBD | 1/14 | 7.1 | ||
| × | × | × | × | × | × | • | • | • | • | × | R1 18th | • | • | • | • | • | • | R1 30th | R1 31st | • | TBD | TBD | 3/14 | 21.4 | |
| × | QF 6th | 2nd | × | 2nd | R1 10th | QF 5th | QF 6th | • | • | R1 15th | R1 14th | R1 18th | • | • | • | • | • | • | • | • | TBD | TBD | 9/19 | 47.4 | |
| × | × | × | × | × | • | × | × | × | • | • | • | • | • | • | • | • | • | • | • | R1 28th | TBD | TBD | 1/13 | 7.7 | |
| × | × | R1 15th | × | × | • | × | × | × | • | • | • | • | • | • | • | • | • | • | • | × | TBD | TBD | 1/13 | 7.7 | |
| × | × | × | × | × | × | × | × | • | R1 14th | × | × | • | • | R1 20th | • | R1 T-25th | • | R1 28th | R1 18th | TBD | TBD | 5/10 | 50 | ||
| × | × | × | × | × | × | × | × | • | × | • | R1 23rd | • | • | • | • | • | • | • | • | TBD | TBD | 1/11 | 9.1 | ||
| × | • | • | • | • | • | • | • | R1 12th | • | • | • | • | • | • | • | • | • | • | • | • | TBD | TBD | 1/20 | 5 | |
| × | 1st | 1st | R1 7th | R1 10th | • | R1 9th | R1 9th | 2nd | R1 10th | 4th | 1st | R2 12th | 3rd | 2nd | QF 5th | R2 15th | 1st | R1 26th | R1 22nd | • | TBD | TBD | 18/20 | 90 | |
| Part of France | × | × | × | • | • | × | • | • | • | • | • | R1 19th | R1 17th | R1 21st | • | TBD | TBD | 3/11 | 27.3 | ||||||
| Part of the United Kingdom | × | • | • | × | • | • | × | • | • | R1 22nd | • | • | • | • | • | TBD | TBD | 1/12 | 8.3 | ||||||
| × | × | × | × | • | × | • | × | • | • | • | • | • | • | • | R1 31st | R2 9th | R1 T-28th | R2 9th | R1 29th | R2 15th | TBD | TBD | 6/15 | 40 | |
| × | × | × | × | × | × | × | × | × | • | • | R1 21st | • | • | • | • | • | • | • | • | • | TBD | TBD | 1/12 | 8.3 | |
| R1 13th | • | × | R1 12th | R1 13th | R1 16th | R1 11th | R1 12th | QF 6th | • | R1 16th | • | QF 6th | × | R2 13th | R2 13th | R2 11th | R2 15th | R2 14th | R2 10th | R2 12th | TBD | q | 16/19 | 84.2 | |
| Part of France | • | × | R1 14th | • | • | • | R2 11th | • | R1 23rd | R1 18th | • | • | • | • | R1 27th | TBD | TBD | 5/14 | 35.7 | ||||||
| × | R1 T-9th | R1 14th | × | × | • | • | • | • | 2nd | 2nd | • | • | R2 15th | QF 7th | 4th | • | R2 11th | 2nd | 3rd | • | TBD | TBD | 10/18 | 55.6 | |
| × | × | × | × | × | • | • | • | R1 23rd | • | • | • | • | • | • | R1 22nd | • | • | TBD | TBD | 2/13 | 15.4 | ||||
| Part of the United Kingdom | • | × | • | • | • | • | • | • | R2 9th | R2 12th | R1 27th | • | R1 27th | R2 16th | R1 21st | TBD | TBD | 6/14 | 42.9 | ||||||
| Part of Japan | × | × | QF 8th | × | • | × | • | • | • | • | × | × | • | R1 32nd | • | • | TBD | TBD | 2/10 | 20 | |||||
| × | × | × | • | • | QF 8th | • | • | • | • | • | R2 9th | R1 21st | • | • | • | • | • | • | • | • | TBD | TBD | 3/18 | 16.7 | |
| × | × | R1 12th | × | • | • | • | • | • | • | • | • | • | • | R1 17th | R2 15th | • | • | • | • | • | TBD | TBD | 3/18 | 16.7 | |
| Team | 1930 (13) |
1934 (16) |
1938 (15) |
1950 (13) |
1954 (16) |
1958 (16) |
1962 (16) |
1966 (16) |
1970 (16) |
1974 (16) |
1978 (16) |
1982 (24) |
1986 (24) |
1990 (24) |
1994 (24) |
1998 (32) |
2002 (32) |
2006 (32) |
2010 (32) |
2014 (32) |
2018 (32) |
2022 (32) |
2026 (48) |
Total partici- pations |
Qualifying percentage |
| × | × | × | × | × | × | × | × | × | × | • | • | • | • | • | • | • | • | • | • | R1 32nd | TBD | TBD | 1/11 | 9.1 | |
| R1 9th | × | × | R1 11th | • | R1 12th | • | • | • | • | • | • | R2 13th | • | • | R2 14th | R2 16th | R1 18th | QF 8th | • | • | TBD | TBD | 8/19 | 42.1 | |
| R1 10th | × | × | × | × | • | • | • | QF 7th | • | R2 8th | R1 20th | • | • | • | • | • | • | • | • | R1 20th | TBD | TBD | 5/17 | 29.4 | |
| × | • | R1 11th | × | × | • | • | • | • | 3rd | R2 5th | 3rd | R2 14th | • | • | • | R1 25th | R1 21st | • | • | R1 25th | TBD | TBD | 8/18 | 44.4 | |
| × | • | • | • | • | • | • | 3rd | • | • | • | • | R1 17th | • | • | • | R1 21st | 4th | R2 11th | R1 18th | R2 13th | TBD | TBD | 7/20 | 35 | |
| × | × | × | × | × | × | × | × | × | × | • | • | • | • | • | • | • | • | • | • | • | q | TBD | |||
| × | • | • | • | • | • | • | • | • | • | • | • | • | QF 8th | R2 16th | • | R2 12th | • | • | • | • | TBD | TBD | 3/20 | 15 | |
| R1 8th | R1 12th | R1 9th | × | • | • | • | • | R1 T-10th | • | • | • | • | R2 12th | QF 6th | R2 11th | • | • | • | • | • | TBD | TBD | 7/20 | 35 | |
| × | × | × | × | × | QF 7th | QF 6th | 4th | QF 5th | • | • | R2 7th | R2 10th | R1 17th | R1 18th | • | R1 22nd | • | • | R1 24th | QF 8th | TBD | TBD | 11/16 | 68.8 | |
| × | × | × | × | × | • | • | • | • | R2 12th | R1 28th | R1 32nd | R1 T-28th | • | • | R1 26th | TBD | TBD | 5/11 | 45.5 | ||||||
| × | × | × | •• | R1 15th | R1 14th | • | • | • | R1 9th | R1 11th | R1 15th | R1 19th | R1 T-18th | • | R1 27th | • | • | • | • | • | TBD | TBD | 8/18 | 44.4 | |
| Part of France | × | × | × | • | • | • | • | × | • | • | QF 7th | • | • | • | R1 17th | TBD | TBD | 2/11 | 18.2 | ||||||
| 4th[lower-alpha 2] | • | • | R1 5th | QF 7th | QF 5th | 4th | • | • | R2 7th | • | R1 16th | • | QF 5th | × | R2 10th | • | R1 32nd | R1 23rd | • | R1 23rd | TBD | TBD | 12/20 | 60 | |
| Part of Czechoslovakia[lower-alpha 4] | • | • | • | R2 16th | • | • | TBD | TBD | 1/6 | 16.7 | |||||||||||||||
| Part of Yugoslavia[lower-alpha 1] | × | • | R1 30th | • | R1 18th | • | • | TBD | TBD | 2/6 | 33.3 | ||||||||||||||
| × | × | × | × | × | × | × | × | × | × | • | R1 24th | R1 17th | • | R1 20th | • | • | TBD | TBD | 3/7 | 42.9 | |||||
| Part of Japan | × | R1 16th | × | • | × | • | • | • | • | R1 20th | R1 22nd | R1 20th | R1 30th | 4th | R1 17th | R2 15th | R1 27th | R1 19th | TBD | TBD | 10/15 | 66.7 | |||
| × | QF 5th | × | 4th | • | • | R1 12th | R1 10th | • | • | R1 10th | R2 12th | QF 7th | R2 10th | QF 8th | R1 17th | QF 5th | R2 9th | 1st | R1 23rd | R2 10th | TBD | TBD | 15/19 | 78.9 | |
| × | QF 8th | 4th | 3rd | • | 2nd | • | • | R1 9th | R2 5th | R1 13th | • | • | R1 21st | 3rd | • | R2 13th | R2 14th | • | • | QF 7th | TBD | TBD | 12/20 | 60 | |
| × | QF 7th | QF 7th | R1 6th | QF 8th | • | R1 16th | R1 16th | • | • | • | • | • | • | R2 15th | • | • | R2 10th | R1 19th | R2 11th | R2 14th | TBD | TBD | 11/20 | 55 | |
| Part of France | × | × | × | • | • | • | × | × | • | • | • | R1 30th | • | • | • | TBD | TBD | 1/10 | 10 | ||||||
| Part of the United Kingdom | • | • | • | • | • | • | • | • | • | • | R1 27th | • | • | • | TBD | TBD | 1/14 | 7.1 | |||||||
| Part of France | • | × | • | • | R1 9th | • | • | • | • | R1 26th | R1 29th | R1 24th | • | • | R1 24th | TBD | TBD | 5/14 | 35.7 | ||||||
| × | × | × | •• | R1 9th | × | • | • | • | • | • | • | • | • | • | • | 3rd | • | • | • | • | TBD | TBD | 2/17 | 11.8 | |
| Part of Soviet Union[lower-alpha 3] | × | • | • | QF 8th | • | • | • | TBD | TBD | 1/6 | 16.7 | ||||||||||||||
| × | × | × | • | R1 24th | • | • | • | • | • | • | • | TBD | TBD | 1/9 | 11.1 | ||||||||||
| 3rd[lower-alpha 2] | R1 16th | × | R1 10th | • | • | • | • | • | • | • | • | • | R1 23rd | R2 14th | R1 32nd | QF 8th | R1 T-25th | R2 12th | R2 15th | • | TBD | q | 10/20 | 50 | |
| 1st | × | × | 1st | 4th | • | R1 13th | QF 7th | 4th | R1 13th | • | • | R2 16th | R2 16th | • | • | R1 26th | • | 4th | R2 12th | QF 5th | TBD | TBD | 13/19 | 68.4 | |
| × | × | × | • | • | QF 6th | • | • | • | • | • | • | • | • | • | • | • | • | • | • | • | TBD | TBD | 1/18 | 5.6 | |
| Team | 1930 (13) |
1934 (16) |
1938 (15) |
1950 (13) |
1954 (16) |
1958 (16) |
1962 (16) |
1966 (16) |
1970 (16) |
1974 (16) |
1978 (16) |
1982 (24) |
1986 (24) |
1990 (24) |
1994 (24) |
1998 (32) |
2002 (32) |
2006 (32) |
2010 (32) |
2014 (32) |
2018 (32) |
2022 (32) |
2026 (48) |
Total partici- pations |
Qualifying percentage |
Results of host nations
Except in 1934, host nations are granted an automatic spot in the World Cup group stage. The first host ever to fail to advance past the first round was South Africa in 2010. † denotes the best result in the team's history, ‡ - the best result at the time of the competition (improved later).
| No. | Year | Host Nation | Finish |
|---|---|---|---|
| 1 | 1930 | Champions† | |
| 2 | 1934 | Champions† | |
| 3 | 1938 | Quarter-Final‡ | |
| 4 | 1950 | Runners-up‡ | |
| 5 | 1954 | Quarter-Final† | |
| 6 | 1958 | Runners-up† | |
| 7 | 1962 | Third Place† | |
| 8 | 1966 | Champions† | |
| 9 | 1970 | Quarter-Final† | |
| 10 | 1974 | Champions† | |
| 11 | 1978 | Champions† | |
| 12 | 1982 | Round 2 (Top 12) | |
| 13 | 1986 | Quarter-Final† | |
| 14 | 1990 | Third Place | |
| 15 | 1994 | Round of 16 | |
| 16 | 1998 | Champions† | |
| 17 | 2002 | Fourth Place† | |
| Round of 16† | |||
| 18 | 2006 | Third Place | |
| 19 | 2010 | Group Stage† | |
| 20 | 2014 | Fourth Place | |
| 21 | 2018 | Quarter-Final | |
| 22 | 2022 | TBD†[lower-alpha 11] | |
| 23 | 2026 | TBD | |
| TBD | |||
| TBD | |||
Results of defending champions and runners-up
The defending World Cup champions were formerly granted an automatic spot in the Cup finals field. As of the 2006 tournament, this berth is no longer guaranteed.[14] However, no defending World Cup champion has yet failed to qualify. Automatic berths have never been given for defending World Cup runners-up. Defending runners-up are 15-for-18 in qualification efforts for the following World Cup.
| Year | Defending champions | Finish | Defending runners-up | Finish |
|---|---|---|---|---|
| 1934 | Did not enter | Round 1 (Round of 16) | ||
| 1938 | Champions | Quarter-Final | ||
| 1950 | Group Stage | Did not enter | ||
| 1954 | Fourth Place | Quarter-Final | ||
| 1958 | Fourth Place | Group Stage | ||
| 1962 | Champions | Did not qualify | ||
| 1966 | Group Stage | Did not qualify | ||
| 1970 | Quarter-Final | Third Place | ||
| 1974 | Fourth Place | Group Stage | ||
| 1978 | Round 2 (top 8) | Runners-up | ||
| 1982 | Round 2 (top 12) | Did not qualify | ||
| 1986 | Round of 16 | Runners-up | ||
| 1990 | Runners-up | Champions | ||
| 1994 | Quarter-Final | Round of 16 | ||
| 1998 | Runners-up | Quarter-Final | ||
| 2002 | Group Stage | Champions | ||
| 2006 | Quarter-Final | Third Place | ||
| 2010 | Group Stage | Group Stage | ||
| 2014 | Group Stage | Third Place | ||
| 2018 | Group Stage | Round of 16 | ||
| 2022 | TBD | TBD | ||
Results by confederation
AFC
| Year | Teams | Top 16 | Top 8/12 | Top 4 | Top 2 | Team | Result |
|---|---|---|---|---|---|---|---|
| Progress in the tournament | Best performance | ||||||
| 1938 | 1 | N/A[lower-alpha 12] | 0 | 0 | 0 | First round | |
| 1954 | 1 | 0 | 0 | 0 | Group stage | ||
| 1966 | 1 | 1 | 0 | 0 | Quarter-finals | ||
| 1970 | 1 | 0 | 0 | 0 | Group stage | ||
| 1978 | 1 | 0 | 0 | 0 | Group stage | ||
| 1982 | 1 | 0[lower-alpha 13] | 0 | 0 | Group stage | ||
| 1986 | 2 | 0 | 0 | 0 | 0 | Group stage | |
| 1990 | 2 | 0 | 0 | 0 | 0 | Group stage | |
| 1994 | 2 | 1 | 0 | 0 | 0 | Round of 16 | |
| 1998 | 4 | 0 | 0 | 0 | 0 | Group stage | |
| 2002 | 4 | 2 | 1 | 1 | 0 | Fourth place | |
| 2006 | 4 | 0 | 0 | 0 | 0 | Group stage | |
| 2010 | 4 | 2 | 0 | 0 | 0 | Round of 16 | |
| 2014 | 4 | 0 | 0 | 0 | 0 | Group stage | |
| 2018 | 5 | 1 | 0 | 0 | 0 | Round of 16 | |
| Total | 37 | 6 | 2 | 1 | 0 | Fourth place | |
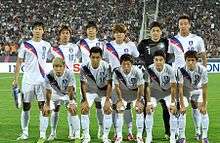
CAF
.jpg)
.jpg)
| Year | Teams | Top 16 | Top 8/12 | Top 4 | Top 2 | Team | Result |
|---|---|---|---|---|---|---|---|
| Progress in the tournament | Best performance | ||||||
| 1934 | 1 | N/A[lower-alpha 12] | 0 | 0 | 0 | First round | |
| 1970 | 1 | 0 | 0 | 0 | Group stage | ||
| 1974 | 1 | 0 | 0 | 0 | Group stage | ||
| 1978 | 1 | 0 | 0 | 0 | Group stage | ||
| 1982 | 2 | 0[lower-alpha 13] | 0 | 0 | Group stage 1 | ||
| 1986 | 2 | 1 | 0 | 0 | 0 | Round of 16 | |
| 1990 | 2 | 1 | 1 | 0 | 0 | Quarter-finals | |
| 1994 | 3 | 1 | 0 | 0 | 0 | Round of 16 | |
| 1998 | 5 | 1 | 0 | 0 | 0 | Round of 16 | |
| 2002 | 5 | 1 | 1 | 0 | 0 | Quarter-finals | |
| 2006 | 5 | 1 | 0 | 0 | 0 | Round of 16 | |
| 2010 | 6 | 1 | 1 | 0 | 0 | Quarter-finals | |
| 2014 | 5 | 2 | 0 | 0 | 0 | Round of 16 | |
| 2018 | 5 | 0 | 0 | 0 | 0 | Group stage | |
| Total | 44 | 9 | 3 | 0 | 0 | Quarter-finals | |
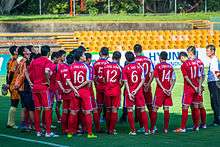
CONCACAF

.jpg)
| Year | Teams | Top 16 | Top 8/12 | Top 4 | Top 2 | Team | Result |
|---|---|---|---|---|---|---|---|
| Progress in the tournament | Best performance | ||||||
| 1930 | 2 | N/A[lower-alpha 12] | N/A[lower-alpha 14] | 1 | 0 | Third place[lower-alpha 2] | |
| 1934 | 1 | 0 | 0 | 0 | First round | ||
| 1938 | 1 | 1 | 0 | 0 | Quarter-finals | ||
| 1950 | 2 | N/A[lower-alpha 14] | 0 | 0 | Group stage | ||
| 1954 | 1 | 0 | 0 | 0 | Group stage | ||
| 1958 | 1 | 0 | 0 | 0 | Group stage | ||
| 1962 | 1 | 0 | 0 | 0 | Group stage | ||
| 1966 | 1 | 0 | 0 | 0 | Group stage | ||
| 1970 | 2 | 1 | 0 | 0 | Quarter-finals | ||
| 1974 | 1 | 0 | 0 | 0 | Group stage | ||
| 1978 | 1 | 0 | 0 | 0 | Group stage | ||
| 1982 | 2 | 0[lower-alpha 13] | 0 | 0 | Group stage 1 | ||
| 1986 | 2 | 1 | 1 | 0 | 0 | Quarter-finals | |
| 1990 | 2 | 1 | 0 | 0 | 0 | Round of 16 | |
| 1994 | 2 | 2 | 0 | 0 | 0 | Round of 16 | |
| 1998 | 3 | 1 | 0 | 0 | 0 | Round of 16 | |
| 2002 | 3 | 2 | 1 | 0 | 0 | Quarter-finals | |
| 2006 | 4 | 1 | 0 | 0 | 0 | Round of 16 | |
| 2010 | 3 | 2 | 0 | 0 | 0 | Round of 16 | |
| 2014 | 4 | 3 | 1 | 0 | 0 | Quarter-finals | |
| 2018 | 3 | 1 | 0 | 0 | 0 | Round of 16 | |
| Total | 42 | 14 | 5 | 1 | 0 | Third place | |
CONMEBOL
| Year | Teams | Top 16 | Top 8/12 | Top 4 | Top 2 | Team | Result |
|---|---|---|---|---|---|---|---|
| Progress in the tournament | Best performance | ||||||
| 1930 | 7 | N/A[lower-alpha 12] | N/A[lower-alpha 14] | 2 | 2 | Winners | |
| 1934 | 2 | 0 | 0 | 0 | First round | ||
| 1938 | 1 | 1 | 1 | 0 | Third place | ||
| 1950 | 5 | N/A[lower-alpha 14] | 2 | 2 | Winners | ||
| 1954 | 2 | 2 | 1 | 0 | Fourth place | ||
| 1958 | 3 | 1 | 1 | 1 | Winners | ||
| 1962 | 5 | 2 | 2 | 1 | Winners | ||
| 1966 | 4 | 2 | 0 | 0 | Quarter-finals | ||
| 1970 | 3 | 3 | 2 | 1 | Winners | ||
| 1974 | 4 | 2 | 1 | 0 | Fourth place | ||
| 1978 | 3 | 3 | 2 | 1 | Winners | ||
| 1982 | 4 | 2[lower-alpha 13] | 0 | 0 | Group stage 2 | ||
| 1986 | 4 | 4 | 2 | 1 | 1 | Winners | |
| 1990 | 4 | 4 | 1 | 1 | 1 | Runners-up | |
| 1994 | 4 | 2 | 1 | 1 | 1 | Winners | |
| 1998 | 5 | 4 | 2 | 1 | 1 | Runners-up | |
| 2002 | 5 | 2 | 1 | 1 | 1 | Winners | |
| 2006 | 4 | 3 | 2 | 0 | 0 | Quarter-finals | |
| 2010 | 5 | 5 | 4 | 1 | 0 | Fourth place | |
| 2014 | 6 | 5 | 3 | 2 | 1 | Runners-up | |
| 2018 | 5 | 4 | 2 | 0 | 0 | Quarter-finals | |
| Total | 85 | 33 | 36 | 22 | 14 | Winners (5 times) | |
OFC

| Year | Teams | Top 16 | Top 8/12 | Top 4 | Top 2 | Team | Result |
|---|---|---|---|---|---|---|---|
| Progress in the tournament | Best performance | ||||||
| 1974 | 1 | N/A[lower-alpha 12] | 0 | 0 | 0 | Group stage | |
| 1982 | 1 | 0[lower-alpha 13] | 0 | 0 | Group stage 1 | ||
| 2006 | 1 | 1 | 0 | 0 | 0 | Round of 16 | |
| 2010 | 1 | 0 | 0 | 0 | 0 | Group stage | |
| Total | 4 | 1 | 0 | 0 | 0 | Round of 16 | |
UEFA
| Year | Teams | Top 16 | Top 8/12 | Top 4 | Top 2 | Team | Result |
|---|---|---|---|---|---|---|---|
| Progress in the tournament | Best performance | ||||||
| 1930 | 4 | N/A[lower-alpha 12] | N/A[lower-alpha 14] | 1 | 0 | Fourth place[lower-alpha 2] | |
| 1934 | 12 | 8 | 4 | 2 | Winners | ||
| 1938 | 12 | 6 | 3 | 2 | Winners | ||
| 1950 | 6 | N/A[lower-alpha 14] | 2 | 0 | Third place | ||
| 1954 | 12 | 6 | 3 | 2 | Winners | ||
| 1958 | 12 | 7 | 3 | 1 | Runners-up | ||
| 1962 | 10 | 6 | 2 | 1 | Runners-up | ||
| 1966 | 10 | 5 | 4 | 2 | Winners | ||
| 1970 | 9 | 4 | 2 | 1 | Runners-up | ||
| 1974 | 9 | 6 | 3 | 2 | Winners | ||
| 1978 | 10 | 5 | 2 | 1 | Runners-up | ||
| 1982 | 14 | 10[lower-alpha 13] | 4 | 2 | Winners | ||
| 1986 | 14 | 10 | 5 | 3 | 1 | Runners-up | |
| 1990 | 14 | 10 | 6 | 3 | 1 | Winners | |
| 1994 | 13 | 10 | 7 | 3 | 1 | Runners-up | |
| 1998 | 15 | 10 | 6 | 3 | 1 | Winners | |
| 2002 | 15 | 9 | 4 | 2 | 1 | Runners-up | |
| 2006 | 14 | 10 | 6 | 4 | 2 | Winners | |
| 2010 | 13 | 6 | 3 | 3 | 2 | Winners | |
| 2014 | 13 | 6 | 4 | 2 | 1 | Winners | |
| 2018 | 14 | 10 | 6 | 4 | 2 | Winners | |
| Total | 245 | 81 | 110 | 60 | 28 | Winners (4 times each) | |
Overall
After the first twenty-one World Cups, all top 2 finishes, and all but two top 4 finishes, have been achieved by European (UEFA) and South American (CONMEBOL) countries. The other four football regions together have got just one third place, won by the United States in the inaugural 1930 tournament,[lower-alpha 2] and one fourth place, won by South Korea on home soil in 2002.
| AFC | CAF | CONCACAF | CONMEBOL | OFC | UEFA | Total | |
|---|---|---|---|---|---|---|---|
| Nations | 11[lower-alpha 15] | 13 | 11 | 9 | 2[lower-alpha 15] | 34 | 79 |
| Participations | 37 | 44 | 42 | 85 | 4 | 245 | 457 |
| Top 16 | 6 | 9 | 14 | 33 | 1 | 81 | 144 |
| Top 8/12[lower-alpha 13] | 2 | 3 | 5 | 36 | 0 | 110 | 156[lower-alpha 16] |
| Top 4 | 1 | 0 | 1 | 22 | 0 | 60 | 84 |
| Top 2 | 0 | 0 | 0 | 14 | 0 | 28 | 42 |
| 1st | 0 | 0 | 0 | 9 | 0 | 12 | 21 |
| 2nd | 0 | 0 | 0 | 5 | 0 | 16 | 21 |
| 3rd | 0 | 0 | 1 | 3 | 0 | 17 | 21 |
| 4th | 1 | 0 | 0 | 5 | 0 | 15 | 21 |
Footnotes
- 1 2 3 4 5 6 7 8 Serbia is considered the inheritor of the records of the
.svg.png)

- 1 2 3 4 5 6 7 8 There was no third place match in 1930. The USA and Yugoslavia lost in the semi-finals. Both captains received bronze medals. Currently, FIFA recognizes USA as the third-placed team and Yugoslavia as the fourth-placed team, using the overall records of the teams in the 1930 World Cup.[13]
- 1 2 3 4 5 Russia is considered the inheritor of the records of the
- 1 2 3 4 5 The Czech Republic is considered the inheritor of the records of

- 1 2 3 Indonesia competed in 1938 as

- 1 2 3 DR Congo was known as

- 1 2 3 4 5 Post-reunification Germany is considered the inheritor of the records of pre-war
.svg.png)

- ↑ Austria qualified in 1938, but withdrew to play as part of Germany after being annexed.
- ↑ Israel competed as Eretz Yisrael (Land of Israel) in 1934 and in 1938, with a team consisting exclusively of Jewish and British footballers from the Palestine Mandate.
- ↑ Republic of Ireland competed as the Irish Free State in 1934 and then as Ireland in 1938 and 1950.
- ↑ Qatar will debut in the tournament in 2022, so its result will also be its best result in history.
- 1 2 3 4 5 6 From 1930 to 1978, the FIFA World Cup finals tournament featured 16 or fewer teams, while in 1982, the tournament featured 24 teams and a second round with 12 teams.[15]
- 1 2 3 4 5 6 7 The 1982 edition in Spain had a format with a second round consisting of 12 teams from which 4 teams qualified to the semi-final round.
- 1 2 3 4 5 6 The 1930 and 1950 tournaments progressed directly from the first round to semi-finals.
- 1 2 Australia has participated as part of OFC and AFC
- ↑ The 1930 and 1950 tournaments did not have a quarter-final round, while 1982 had a second round consisting of 12 teams, of which 4 advanced.
References
- ↑ "The History of the FIFA World Cup". FIFA. Retrieved June 26, 2018.
- ↑ "World Cup". Rec.Sport.Soccer Statistics Foundation. Retrieved June 26, 2018.
- ↑ "Formats of the FIFA World Cup final competitions 1930 – 2010" (PDF). FIFA. Retrieved June 26, 2018.
- ↑ "Quiz! Can you name all 79 countries to have appeared at a World Cup finals?". FourFourTwo. June 18, 2018. Retrieved June 26, 2018.
- ↑ "FIFA World Cup Teams Statistics: Teams with the most tournament participations". FIFA. Retrieved June 26, 2018.
- ↑ Dawson, Alan (May 28, 2018). "The 2018 World Cup is only 2 weeks away — here's who has won every tournament since 1930". Business Insider. Retrieved June 26, 2018.
- ↑ "World Cup 2018: Can you name the losing finalists from previous tournaments?". BBC Sport. June 9, 2018. Retrieved June 26, 2018.
- ↑ "World Cup All-Time Tables (including Qualifying)". Rec.Sport.Soccer Statistics Foundation. Retrieved June 26, 2018.
- ↑ "FIFA World Cup™ Teams Statistics". FIFA.
- ↑ "1930 FIFA World Cup Uruguay: Teams". FIFA. Retrieved June 26, 2018.
- ↑ "Fact Sheet - FIFA World Cup™: All-time ranking" (PDF). FIFA. (through 2010)
- ↑ "OC for FIFA Competitions approves procedures for the Final Draw of the 2018 FIFA World Cup". FIFA. 14 Sep 2017.
- ↑ "1930 FIFA World Cup Uruguay". FIFA.com. FIFA.
- ↑ Bond, David (30 November 2001). "World Cup winners will have to qualify". EveningStandard. Retrieved 14 October 2015.
- ↑ "FIFA World Cup All Time Statistics". FIFA. Retrieved June 26, 2018.
External links
| Tournaments |
|
|---|---|
| Qualification | |
| Finals | |
| Squads | |
| Seedings | |
| Broadcasters | |
| Bids | |
| Statistics | |
| Disciplinary record | |
| Team appearances | |
| Overall records | |
| Miscellaneous | |
| |