List of countries by papaya production
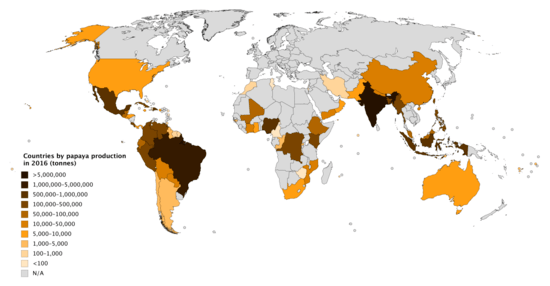
Countries by papaya production in 2016
This is a list of countries by papaya production in 2016, based on data from the Food and Agriculture Organization Corporate Statistical Database.[1] The total world production for papayas in 2016 was 13,050,749 metric tonnes. India was by far the largest producer, accounting for nearly 43.7% of global production. Dependent territories are shown in italics.
Production by country
>100,000 tonnes
| Rank | Country/Region | Papaya production (tonnes) |
|---|---|---|
| 1 | 5,699,000 | |
| 2 | 1,424,650 | |
| 3 | 951,922 | |
| 4 | 904,284 | |
| 5 | 863,201 | |
| 6 | 836,702 | |
| 7 | 215,263 | |
| 8 | 212,579 | |
| 9 | 188,305 | |
| 10 | 169,942 | |
| 11 | 169,437 | |
| 12 | 162,481 | |
| 13 | 160,955 | |
| 14 | 130,371 | |
| 15 | 128,131 | |
| 16 | 118,661 | |
| 17 | 100,000 | |
1,000–100,000 tonnes
| Rank | Country/Region | Papaya production (tonnes) |
|---|---|---|
| 18 | 96,896 | |
| 19 | 65,967 | |
| 20 | 54,664 | |
| 21 | 50,901 | |
| 22 | 50,396 | |
| 23 | 42,502 | |
| 24 | 37,985 | |
| 25 | 25,929 | |
| 26 | 18,216 | |
| 27 | 15,951 | |
| 28 | 14,137 | |
| 29 | 11,400 | |
| 30 | 10,791 | |
| 31 | 9,920 | |
| 32 | 9,705 | |
| 33 | 8,963 | |
| 34 | 8,582 | |
| 35 | 8,151 | |
| 36 | 7,778 | |
| 37 | 7,750 | |
| 38 | 6,642 | |
| 39 | 6,261 | |
| 40 | 5,772 | |
| 41 | 5,561 | |
| 42 | 4,915 | |
| 43 | 4,207 | |
| 44 | 3,705 | |
| 45 | 3,471 | |
| 46 | 3,116 | |
| 47 | 2,920 | |
| 48 | 2,712 | |
| 49 | 2,129 | |
| 50 | 1,417 | |
<1,000 tonnes
| Rank | Country/Region | Papaya production (tonnes) |
|---|---|---|
| 51 | 942 | |
| 52 | 742 | |
| 53 | 713 | |
| 54 | 617 | |
| 55 | 551 | |
| 56 | 550 | |
| 57 | 527 | |
| 58 | 189 | |
| 59 | 172 | |
| 60 | 99 | |
| 61 | 83 | |
| 62 | 72 | |
| 63 | 61 | |
| 64 | 44 | |
| 65 | 43 | |
| 65 | 43 | |
References
This article is issued from
Wikipedia.
The text is licensed under Creative Commons - Attribution - Sharealike.
Additional terms may apply for the media files.