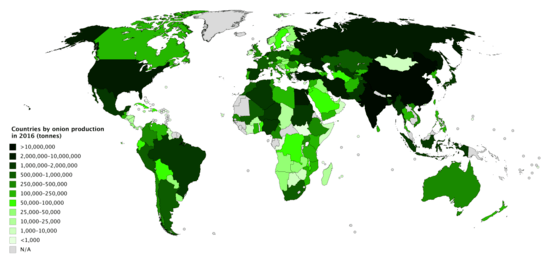
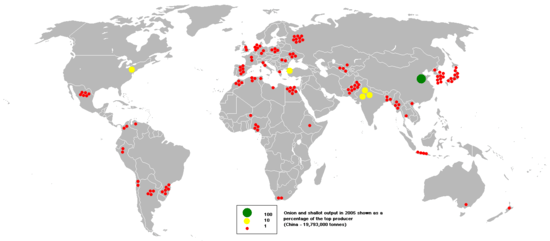
Production by country
>1,000,000 tonnes
| Rank | Country/Region | Onion production (tonnes) |
| 1 |  China China | 24,783,760 |
| 2 |  India India | 19,415,425 |
| 3 |  Egypt Egypt | 3,115,482 |
| 4 |  United States United States | 3,025,700 |
| 5 |  Iran Iran | 2,345,768 |
| 6 |  Turkey Turkey | 2,255,060 |
| 7 |  Russia Russia | 2,023,271 |
| 8 |  Japan Japan | 1,792,749 |
| 9 |  Pakistan Pakistan | 1,739,054 |
| 10 |  Mexico Mexico | 1,735,951 |
| 11 |  Bangladesh Bangladesh | 1,735,334 |
| 12 |  South Korea South Korea | 1,710,951 |
| 13 |  Niger Niger | 1,691,275 |
| 14 |  Brazil Brazil | 1,657,441 |
| 15 |  Sudan Sudan | 1,583,900 |
| 16 |  Algeria Algeria | 1,526,339 |
| 17 |  Netherlands Netherlands | 1,497,073 |
| 18 |  Indonesia Indonesia | 1,446,869 |
| 19 |  Spain Spain | 1,281,393 |
| 20 |  Nigeria Nigeria | 1,251,628 |
| 21 |  Uzbekistan Uzbekistan | 1,184,863 |
| 22 |  Myanmar Myanmar | 1,123,084 |
| 23 |  Ukraine Ukraine | 1,046,660 |
|
500,000–1,000,000 tonnes
| Rank | Country/Region | Onion production (tonnes) |
| 24 |  Kazakhstan Kazakhstan | 761,332 |
| 25 |  Morocco Morocco | 712,898 |
| 26 |  Peru Peru | 705,633 |
| 27 |  South Africa South Africa | 677,291 |
| 28 |  Poland Poland | 651,349 |
| 29 |  Greece Greece | 641,715 |
| 30 |  Germany Germany | 616,505 |
| 31 |  Argentina Argentina | 600,000 |
| 32 |  Mali Mali | 598,690 |
| 33 |  Tajikistan Tajikistan | 556,955 |
| 34 |  France France | 507,495 |
|
100,000–500,000 tonnes
| Rank | Country/Region | Onion production (tonnes) |
| 35 |  Colombia Colombia | 484,321 |
| 36 |  Tunisia Tunisia | 469,277 |
| 37 |  Italy Italy | 450,645[n 2] |
| 38 |  Senegal Senegal | 416,217 |
| 39 |  United Kingdom United Kingdom | 390,674 |
| 40 |  Ethiopia Ethiopia | 363,399 |
| 41 |  Vietnam Vietnam | 352,884 |
| 42 |  Chile Chile | 346,778 |
| 43 |  Uganda Uganda | 333,779 |
| 44 |  Romania Romania | 325,074 |
| 45 |  Cameroon Cameroon | 303,781 |
| 46 |  Australia Australia | 264,547 |
| 47 |  Yemen Yemen | 241,872 |
| 48 |  Libya Libya | 235,185 |
| 49 |  Tanzania Tanzania | 228,869 |
| 50 |  Canada Canada | 219,071 |
| 51 |  Venezuela Venezuela | 213,729 |
| 52 |  Belarus Belarus | 208,873 |
| 53 |  New Zealand New Zealand | 203,449 |
| 54 |  Portugal Portugal | 194,325 |
| 55 |  Kyrgyzstan Kyrgyzstan | 185,344 |
| 56 |  Azerbaijan Azerbaijan | 180,318 |
| 57 |  North Korea North Korea | 175,748 |
| 58 |  Thailand Thailand | 170,822 |
| 59 |  Austria Austria | 163,292 |
| 60 |  Mozambique Mozambique | 162,000 |
| 61 |  Taiwan Taiwan | 152,715 |
| 62 |  Sri Lanka Sri Lanka | 145,262 |
| 63 |  Ghana Ghana | 143,982 |
| 64 |  Guatemala Guatemala | 142,709 |
| 65 |  Afghanistan Afghanistan | 141,649 |
| 66 |  Albania Albania | 137,181 |
| 67 |  Syria Syria | 132,555 |
| 68 | .svg.png) Belgium Belgium | 130,775 |
| 69 |  Kenya Kenya | 122,841 |
| 70 |  Philippines Philippines | 122,595 |
| 71 |  Israel Israel | 101,864 |
|
50,000–100,000 tonnes
| Rank | Country/Region | Onion production (tonnes) |
| 72 |  Ecuador Ecuador | 98,894 |
| 73 |  Turkmenistan Turkmenistan | 94,477 |
| 74 |  Cuba Cuba | 89,604 |
| 75 |  Saudi Arabia Saudi Arabia | 88,744 |
| 76 |  Benin Benin | 81,177 |
| 77 |  Bolivia Bolivia | 79,794 |
| 78 |  Lebanon Lebanon | 70,638 |
| 79 |  Jordan Jordan | 66,759 |
| 80 |  Macedonia Macedonia | 63,077 |
| 81 |  Denmark Denmark | 61,950 |
| 82 |  Sweden Sweden | 59,360 |
| 83 |  Moldova Moldova | 57,936[n 2] |
| 84 |  Serbia Serbia | 57,880 |
| 85 |  Dominican Republic Dominican Republic | 57,133 |
| 86 |  Democratic Republic of the Congo Democratic Republic of the Congo | 56,617 |
| 87 |  Armenia Armenia | 53,922 |
| 88 |  Malawi Malawi | 53,793 |
|
10,000–50,000 tonnes
| Rank | Country/Region | Onion production (tonnes) |
| 89 |  Hungary Hungary | 49,963 |
| 90 |  Bosnia and Herzegovina Bosnia and Herzegovina | 44,996 |
| 91 |  Iraq Iraq | 43,098 |
| 92 |  Switzerland Switzerland | 42,175 |
| 93 |  Czech Republic Czech Republic | 42,018 |
| 94 |  Paraguay Paraguay | 39,086 |
| 95 |  Zambia Zambia | 37,585 |
| 96 |  Costa Rica Costa Rica | 35,277 |
| 97 |  Palestine Palestine | 35,162 |
| 98 |  Norway Norway | 32,020 |
| 99 |  Uruguay Uruguay | 31,312 |
| 100 |  Namibia Namibia | 29,492 |
| 101 |  Slovakia Slovakia | 29,302 |
| 102 |  Angola Angola | 27,602 |
| 103 |  Croatia Croatia | 26,858 |
| 104 |  Lithuania Lithuania | 26,521 |
| 105 |  Finland Finland | 26,242 |
| 106 |  United Arab Emirates United Arab Emirates | 25,752 |
| 107 |  Nicaragua Nicaragua | 23,102 |
| 108 |  Bulgaria Bulgaria | 20,751 |
| 109 |  Chad Chad | 19,602 |
| 110 |  Georgia Georgia | 18,500 |
| 111 |  Burkina Faso Burkina Faso | 18,449 |
| 112 |  Jamaica Jamaica | 15,922 |
| 113 |  Panama Panama | 15,588 |
| 114 |  Latvia Latvia | 15,154 |
| 115 |  Honduras Honduras | 14,953 |
| 116 |  Rwanda Rwanda | 14,522 |
| 117 |  Kuwait Kuwait | 12,773 |
| 118 |  Madagascar Madagascar | 11,306 |
| 119 |  Slovenia Slovenia | 11,274 |
|
1,000–10,000 tonnes
| Rank | Country/Region | Onion production (tonnes) |
| 120 |  Mongolia Mongolia | 9,985 |
| 121 |  Haiti Haiti | 9,160 |
| 122 |  Oman Oman | 8,324 |
| 123 |  Cyprus Cyprus | 8,306 |
| 124 |  Malta Malta | 8,234 |
| 125 |  Côte d'Ivoire Côte d'Ivoire | 7,699 |
| 126 |  Mauritius Mauritius | 7,550 |
| 127 |  Ireland Ireland | 6,000 |
| 128 |  Somalia Somalia | 5,074 |
| 129 |  Cape Verde Cape Verde | 5,066 |
| — | Réunion | 4,806 |
| — |  Hong Kong Hong Kong | 4,403 |
| 130 |  Botswana Botswana | 4,277 |
| 131 |  Zimbabwe Zimbabwe | 3,569 |
| 132 |  Qatar Qatar | 2,467 |
| 133 |  El Salvador El Salvador | 2,133 |
| — |  Puerto Rico Puerto Rico | 2,093 |
| 134 |  Guyana Guyana | 1,616 |
| 135 |  Bahamas Bahamas | 1,591 |
|
Notes
- ↑ Shallots are also included in statistics as they are a type of onion.
- 1 2 Data not available for "Onion, shallots, green". "Onions, dry" data shown only.
References
- ↑ "Crops". FAOSTAT. Retrieved 2018-08-21.
Countries - Select All; Regions - World + (Total); Elements - Production Quantity; Items - Onion, dry + Onions, shallots, green; Years - 2016