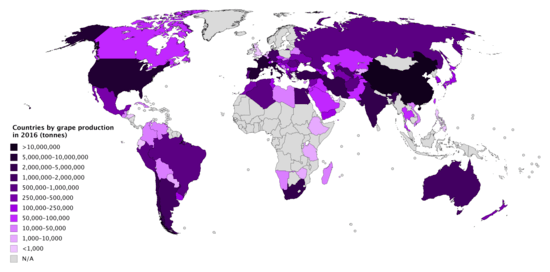
Production by country
>1,000,000 tonnes
| Rank | Country/Region | Grape production (tonnes) |
| 1 |  China China | 14,763,000 |
| 2 |  Italy Italy | 8,201,914 |
| 3 |  United States United States | 7,097,723 |
| 4 |  France France | 6,247,034 |
| 5 |  Spain Spain | 5,934,239 |
| 6 |  Turkey Turkey | 4,000,000 |
| 7 |  India India | 2,590,000 |
| 8 |  Chile Chile | 2,473,588 |
| 9 |  Iran Iran | 2,450,021 |
| 10 |  South Africa South Africa | 2,008,819 |
| 11 |  Australia Australia | 1,772,911 |
| 12 |  Argentina Argentina | 1,758,418 |
| 13 |  Egypt Egypt | 1,716,846 |
| 14 |  Uzbekistan Uzbekistan | 1,642,349 |
| 15 |  Germany Germany | 1,225,570 |
|
100,000–1,000,000 tonnes
| Rank | Country/Region | Grape production (tonnes) |
| 16 |  Greece Greece | 990,289 |
| 17 |  Brazil Brazil | 984,481 |
| 18 |  Afghanistan Afghanistan | 874,541 |
| 19 |  Portugal Portugal | 773,904 |
| 20 |  Romania Romania | 736,892 |
| 21 |  Peru Peru | 689,957 |
| 22 |  Moldova Moldova | 615,739 |
| 23 |  Algeria Algeria | 570,972 |
| 24 |  Russia Russia | 551,733 |
| 25 |  Hungary Hungary | 422,967 |
| 26 |  New Zealand New Zealand | 408,531 |
| 27 |  Ukraine Ukraine | 377,780 |
| 28 |  Morocco Morocco | 364,866 |
| 29 |  Mexico Mexico | 351,310 |
| 30 |  Macedonia Macedonia | 333,319 |
| 31 |  Turkmenistan Turkmenistan | 287,922 |
| 32 |  Syria Syria | 265,849 |
| 33 |  Austria Austria | 260,337 |
| 34 |  South Korea South Korea | 245,285 |
| 35 |  Tajikistan Tajikistan | 214,775 |
| 36 |  Bulgaria Bulgaria | 211,083 |
| 37 |  Albania Albania | 205,001 |
| 38 |  Japan Japan | 179,200 |
| 39 |  Armenia Armenia | 178,752 |
| 40 |  Georgia Georgia | 159,200 |
| 41 |  Yemen Yemen | 153,046 |
| 42 |  Serbia Serbia | 145,829 |
| 43 |  Azerbaijan Azerbaijan | 136,499 |
| 44 |  Switzerland Switzerland | 136,352 |
| 45 |  Tunisia Tunisia | 134,000 |
| 46 |  Croatia Croatia | 123,651 |
| 47 |  Uruguay Uruguay | 104,506 |
|
10,000–100,000 tonnes
| Rank | Country/Region | Grape production (tonnes) |
| 48 |  Slovenia Slovenia | 94,780 |
| 49 |  Iraq Iraq | 94,103 |
| 50 |  Canada Canada | 90,911 |
| 51 |  Saudi Arabia Saudi Arabia | 89,789 |
| 52 |  Thailand Thailand | 80,837 |
| 53 |  Taiwan Taiwan | 79,680 |
| 54 |  Czech Republic Czech Republic | 75,905 |
| 55 |  Kazakhstan Kazakhstan | 75,041 |
| 56 |  Lebanon Lebanon | 69,395 |
| 57 |  Israel Israel | 66,002 |
| 58 |  Pakistan Pakistan | 64,516 |
| 59 |  Jordan Jordan | 62,328 |
| 60 |  Palestine Palestine | 40,556 |
| 61 |  Slovakia Slovakia | 37,832 |
| 62 |  Bosnia and Herzegovina Bosnia and Herzegovina | 36,904 |
| 63 |  Libya Libya | 32,686 |
| 64 |  Namibia Namibia | 26,879 |
| 65 |  Vietnam Vietnam | 26,774 |
| 66 |  Colombia Colombia | 24,990 |
| 67 |  Montenegro Montenegro | 22,746 |
| 68 |  Cuba Cuba | 21,783 |
| 69 |  Bolivia Bolivia | 21,167 |
| 70 |  Cyprus Cyprus | 19,856 |
| 71 |  Guatemala Guatemala | 19,117 |
| 72 |  Venezuela Venezuela | 18,885 |
| 73 |  Belarus Belarus | 17,362 |
| 74 |  Madagascar Madagascar | 13,374 |
| 75 |  Luxembourg Luxembourg | 11,032 |
|
References
- ↑ "Crops". FAOSTAT. Retrieved 2018-08-27.
Countries - Select All; Regions - World + (Total); Elements - Production Quantity; Items - Grapes; Years - 2016