List of countries by proven oil reserves
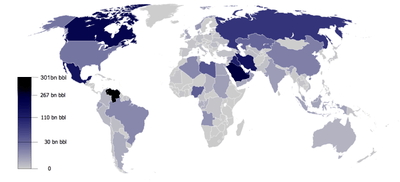
This is a list of countries by proven oil reserves. Proven reserves are those quantities of petroleum which, by analysis of geological and engineering data, can be estimated, with a high degree of confidence, to be commercially recoverable from a given date forward from known reservoirs and under current economic conditions.
Some statistics on this page are disputed and controversial. Different sources (OPEC, CIA World Factbook, oil companies) give different figures. Some of the differences reflect different types of oil included. Different estimates may or may not include oil shale, mined oil sands or natural gas liquids.
---2017---US-EIA---Jo-Di-graphics.jpg)
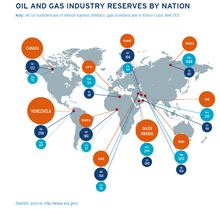
Because proven reserves include oil recoverable under current economic conditions, nations may see large increases in proven reserves when known, but previously uneconomic deposits become economic to develop. In this way, Canada's proven reserves increased suddenly in 2003 when the oil sands of Alberta were seen to be economically viable. Similarly, Venezuela's proven reserves jumped in the late 2000s when the heavy oil of the Orinoco was judged economic.
Countries
Reserves amounts are listed in millions of barrels (MMbbl).
| Proven reserves (millions of barrels) | U.S. EIA (start of 2017)[1] | OPEC (end of 2015)[2] | BP (end of 2015)[3] | Other | ||||
|---|---|---|---|---|---|---|---|---|
| Country | Rank | Reserves | Rank | Reserves | Rank | Reserves | Source/Date | Reserves |
| 1 | 300,878 | 1 | 300,878 | 1 | 300,900 | |||
| 2 | 266,455 | 2 | 266,455 | 2 | 266,600 | |||
| 3 | 169,709 | 26 | 4,118[4] | 3 | 172,200 | Natural Resources Canada, end 2014[5] | 171,000 | |
| 4 | 158,400 | 3 | 158,400 | 4 | 157,800 | |||
| 5 | 142,503 | 4 | 142,503 | 5 | 143,100 | |||
| 6 | 101,500 | 5 | 101,500 | 7 | 101,500 | |||
| 7 | 97,800 | 6 | 97,800 | 8 | 97,800 | |||
| 8 | 80,000 | 7 | 80,000 | 6 | 102,400 | |||
| 9 | 48,000 | 8 | 74,363 | 9 | 78,400 | |||
| 10 | 37,062 | 9 | 37,062 | 11 | 37,100 | |||
| 11 | 35,000 | 10 | 36,685 | 10 | 55,000 | ENI, end of 2015[6] | 43,629 | |
| 12 | 30,000 | 11 | 30,000 | 12 | 30,000 | |||
| 13 | 25,620 | 13 | 25,132 | 14 | 18,500 | |||
| 14 | 25,244 | 12 | 25,244 | 13 | 25,244 | |||
| 15 | 12,999 | 14 | 16,184 | 15 | 13,000 | ENI, end of 2015[6] | 16,848 | |
| 16 | 12,200 | 15 | 12,200 | 17 | 12,200 | |||
| 17 / 18 | 8,273 | 17 | 9,524 | 16 | 12,700 | |||
| 17 / 18 | 8,273 | 18 | 8,273 | 19 / 20 | 8,000 | |||
| 19 | 7,300 | 16 | 9,711 | 18 | 10,800 | PEMEX[7] Start of 2015 | 9.700 | |
| 20 | 7,000 | 19 | 7,000 | 21 | 7,000 | |||
| 21 | 6,611 | 33 | 5,139 | 19 / 20 | 8,000 | |||
| 22 | 5,373 | 21 | 5,306 | 23 | 5,300 | |||
| 23 | 5,000 | 32 | 5,000 | 24 | Sudan 1,500 / S. Sudan 3,500 | |||
| 24 | 4,600 | 20 | 5,680 | 22 | 5,680 | ENI, end of 2015[6] | 5,692 | |
| 25 / 26 | 4,400 | 24 / 25 | 4,400 | 29 | 3,500 | |||
| 25 / 26 | 4,400 | 24 / 25 | 4,400 | 25 | 4,000 | |||
| 27 / 28 | 3,600 | 29 | 3,230 | 27 / 28 | 3,600 | ENI, end of 2015[6] | 3,497 | |
| 27 / 28 | 3,600 | 28 | 3,750 | 27 / 28 | 3,600 | ENI, end of 2015[6] | 5,542 | |
| 29 | 3,000 | 30 | 3,000 | |||||
| 30 | 2,564 | 30 | 2,755 | 31 | 2,800 | UK Oil & Gas Authority, end 2015[8] | 2,618 | |
| 31 / 32 | 2,500 | 31 | 2,500 | 32 | 2,500 | |||
| 31 / 32 | 2,500 | |||||||
| 33 | 2,185 | 32 | 2,380 | 33 | 2,400 | Argentine Petroleum Institute[9] | 2,330 | |
| 34 | 2,002 | 33 | 2,308 | 34 | 2,300 | |||
| 35 | 2,000 | 34 | 2,000 | 35 | 2,000 | |||
| 36 | 1,821 | 27 | 3,982 | 26 | 4,000 | Geoscience Australia[10] end of 2014 | 4,002 | |
| 37 | 1,600 | 36 | 1,600 | |||||
| 38 | 1,500 | 37 | 1,500 | |||||
| 39 / 40 | 1,100 | 35 | 1,100 | 39 / 40 | 1,100 | |||
| 39 / 40 | 1,100 | 39 / 40 | 1,100 | |||||
| 41 | 660 | |||||||
| 42 / 43 | 600 | 42 / 46 | 600 | |||||
| 42 / 43 | 600 | 36 | 600 | 42 / 46 | 600 | |||
| 44 | 594 | 37 | 594 | 42 / 46 | 600 | |||
| 45 | 557 | 42 / 46 | 600 | ENI, end of 2015[6] | 595 | |||
| 46 | 491 | 38 | 511 | 42 / 46 | 600 | ENI, end of 2015[6] | 550 | |
| 47 | 473 | 38 | 1,400 | ENI, end of 2015[6] | 1,489 | |||
| 48 | 425 | 47 / 48 | 400 | |||||
| 49 | 396 | 47 / 48 | 400 | |||||
| 50 | 395 | 39 | 395 | |||||
| 51 | 350 | ENI, end of 2015[6] | 236 | |||||
| 52 | 300 | ENI, end of 2015[6] | 284 | |||||
| 53 | 243 | 41 | 700 | ENI, end of 2015[6] | 830 | |||
| 54 | 211 | ENI, end of 2015[6] | 210 | |||||
| 55 | 200 | |||||||
| 56 | 198 | 40 | 198 | |||||
| 57 | 180 | |||||||
| 58 | 168 | |||||||
| 59 | 159 | ENI, end of 2015[6] | 158 | |||||
| 60 / 62 | 150 | |||||||
| 60 / 62 | 150 | |||||||
| 60 / 62 | 150 | |||||||
| 63 | 145 | ENI, end of 2015[6] | 229 | |||||
| 64 | 139 | |||||||
| 65 | 139 | |||||||
| 66 | 138 | ENI, end of 2015[6] | 151 | |||||
| 67 | 125 | |||||||
| 68 | 124 | ENI, end of 2015[6] | 124 | |||||
| 69 | 113 | ENI, end of 2015[6] | 141 | |||||
| 70 | 100 | |||||||
| 70 | 83.9 | |||||||
| 71 | 83.1 | |||||||
| 72 | 72.4 | |||||||
| 73 | 77.5 | |||||||
| 74 | 71.0 | |||||||
| 75 | 56.9 | |||||||
| 76 | 44.1 | |||||||
| 77 | 43.0 | |||||||
| 78 | 40.0 | |||||||
| 79 | 35.0 | |||||||
| 80 | 28.0 | |||||||
| 81 | 25.1 | ENI, end of 2015[6] | 35 | |||||
| 82 | 20.0 | |||||||
| 83 / 85 | 15.0 | |||||||
| 83 / 85 | 15.0 | |||||||
| 83 / 85 | 15.0 | |||||||
| 86 | 12.7 | ENI, end of 2015[6] | 12 | |||||
| 87 / 88 | 12.0 | |||||||
| 87 / 88 | 12.0 | |||||||
| 89 | 10.0 | |||||||
| 90 | 9.00 | |||||||
| 91 | 8.00 | |||||||
| 92 | 6.70 | |||||||
| 93 | 2.38 | |||||||
| 94 | 2.08 | |||||||
| 95 | 1.00 | ENI, end of 2015[6] | 1 | |||||
| 96 | 0.68 | |||||||
| 97 | 0.43 | |||||||
| 0 | US Geological Survey[11] | 80 | ||||||
| World total | 1,726,685 | 1,481,526 | 1,697,600 | |||||
Different sources
Sources sometimes differ on the volume of proven oil reserves. The differences sometimes result from different classes of oil included, and sometimes result from different definitions of proven.
Comparison of proven oil reserves from some widely used sources (billions of barrels, as of 31 Dec. 2014/1 Jan. 2015)
| Source | Canada | Iran | Russia | Saudi Arabia | United States | Venezuela |
|---|---|---|---|---|---|---|
| BP[12] | 172.9 | 157.8 | 103.2 | 267.0 | 48.5 | 298.3 |
| OPEC[13] | 4.2[4] | 157.5 | 80.0 | 266.6 | 36.5 | 300.0 |
| US Central Intelligence Agency[14] | 171.0 | 157.8 | 103.2 | 268.3 | 36.5 | 298.4 |
| US Energy Information Administration[15] | 172.5 | 157.8 | 80.0 | 268.3 | 39.9 | 298.4 |
See also
References
- ↑ U.S. Energy Information Administration, International Energy Statistics, crude oil including lease condensate, accessed 16 July 2018.
- ↑ OPEC, Annual Statistical Bulletin 2016
- ↑ BP, Statistical Review of World Energy, June 2016.
- ↑ OPEC does not include mined oil sand.
- ↑ Oil Resources, Natural Resources Canada, 16 Feb. 2016.
- 1 2 3 4 5 6 7 8 9 10 11 12 13 14 15 16 17 18 19 20 ENI, World Oil and Gas Review, 2016.
- ↑ 20150909%20Reservas%20al%201%20de%20enero%202015_e.pd... , PEMEX, accessed 1 Sept 2016
- ↑ Oil and Gas reserves and Resources, UK Oil & Gas Authority, 5 Aug. 2016.
- ↑ Instituto Argentino del Petróleo y el Gas – Reservas comprobadas de petróleo, en miles de m3 (proven reserves as of 2013)
- ↑ Geoscience Australia, Oil, accessed 3 Sept. 2016. (crude oil + condensate).
- ↑ "Minerals in Afghanistan" (PDF). USGS Minerals gov. Retrieved 24 December 2013.
- ↑ BP Statistical Review of World Energy, 2015
- ↑ OPEC Statistical Bulletin, 2015.
- ↑ World Factbook, US Central Intelligence Agency, 2015.
- ↑ US Reserves: Curde Oil and Lease Condensate, US EIA.