List of administrative divisions of Greater China by Human Development Index
 |
| First or provincial level Administrative divisions of China by: |
|---|
This is a list of the first-level administrative divisions of the People's Republic of China (PRC), including all provinces, autonomous regions and municipalities, in order of their Human Development Index (HDI), alongside Taiwan. The 2014 figures for PRC divisions come from the 2016 China National Human Development Report (2016中国人类发展报告), published by United Nations Development Programme, the China Development Research Foundation, and the Renmin University of China. This report did not cover Hong Kong and Macau, which are special administrative regions of the PRC, nor Taiwan, which is governed by the Republic of China (ROC).
The HDI values of Hong Kong, as given in the UN Human Development Report, and of Macau and Taiwan, as provided by their respective governments, are included for comparison purposes.
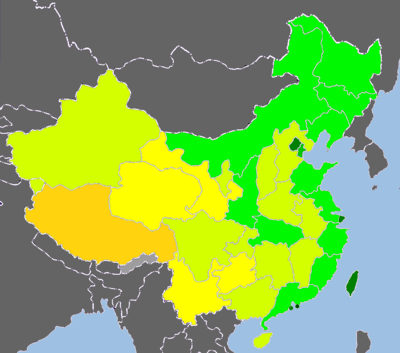
List of administrative divisions of Greater China by Human Development Index (2014)
|
Very High Human Development 0.900 and above
0.850–0.899
0.800–0.849 |
High Human Development 0.750–0.799
0.700–0.749 |
Medium Human Development 0.650–0.699
0.600–0.649 |
Data unavailable |
| Rank | Province | HDI Score (2014)[1] | Comparable Country (2014 data)[2] |
|---|---|---|---|
| Very High human development | |||
| - | 0.910[2] | ||
| - | 0.894[3] | ||
| - | 0.882[4] | ||
| 1 | Beijing | 0.869 | |
| 2 | Shanghai | 0.852 | |
| 3 | Tianjin | 0.843 | |
| High human development | |||
| 4 | Jiangsu | 0.798 | |
| 5 | Zhejiang | 0.798 | |
| 6 | Liaoning | 0.798 | |
| 7 | Guangdong | 0.772 | |
| 8 | Shandong | 0.769 | |
| 9 | Jilin | 0.768 | |
| 10 | Inner Mongolia | 0.766 | |
| 11 | Fujian | 0.758 | |
| 12 | Heilongjiang | 0.755 | |
| 13 | Hubei | 0.754 | |
| — | 0.754 | ||
| 14 | Shaanxi | 0.751 | |
| 15 | Chongqing | 0.747 | |
| 16 | Shanxi | 0.738 | |
| 17 | Hainan | 0.738 | |
| 18 | Hunan | 0.735 | |
| 19 | Hebei | 0.735 | |
| 20 | Henan | 0.727 | |
| 21 | Ningxia | 0.727 | |
| 22 | Jiangxi | 0.726 | |
| 23 | Anhui | 0.720 | |
| 24 | Sichuan | 0.720 | |
| 25 | Xinjiang | 0.718 | |
| 26 | Guangxi | 0.713 | |
| Medium human development | |||
| 27 | Qinghai | 0.694 | |
| 28 | Gansu | 0.689 | |
| 29 | Guizhou | 0.673 | |
| 30 | Yunnan | 0.668 | |
| 31 | Tibet | 0.600 | |
List of large and medium-sized cities of Greater China by Human Development Index (2015)
| City | HDI Score (2015)[5] |
|---|---|
| Guangzhou | 0.869 |
| Beijing | 0.860 |
| Nanjing | 0.859 |
| Shenyang | 0.854 |
| Shenzhen | 0.851 |
| Shanghai | 0.848 |
| Tianjin | 0.841 |
| Xiamen | 0.841 |
| Wuhan | 0.839 |
| Dalian | 0.839 |
| Hangzhou | 0.839 |
| Ningbo | 0.823 |
| Qingdao | 0.822 |
| Changsha | 0.817 |
| Jinan | 0.811 |
| Taiyuan | 0.800 |
| Changchun | 0.799 |
| Zhengzhou | 0.797 |
| Hohhot | 0.792 |
| Hefei | 0.791 |
| Chengdu | 0.791 |
| Haikou | 0.788 |
| Nanchang | 0.787 |
| Fuzhou | 0.785 |
| Yinchuan | 0.784 |
| Kunming | 0.782 |
| Harbin | 0.776 |
| Xi'an | 0.770 |
| Urumqi | 0.769 |
| Lanzhou | 0.767 |
| Guiyang | 0.761 |
| Nanning | 0.757 |
| Shijiazhuang | 0.757 |
| Chongqing | 0.747 |
| Xining | 0.743 |
Trend
| Legend | ||||
|---|---|---|---|---|
|
Very High human development 0.900 and above
0.850–0.899
0.800–0.849 |
High human development 0.750–0.799
0.700–0.749 |
Medium human development 0.650–0.699
0.600–0.649
0.550–0.599 |
Data unavailable | |
- 2010-2014 HDI
- 2014 data
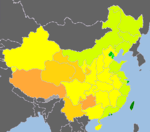 2010 data
| Legend | ||||
|---|---|---|---|---|
|
Very High human development 0.900–0.949 |
High human development 0.850–0.899
0.800–0.849 |
Medium human development 0.750–0.799
0.700–0.749
0.650–0.699
0.600–0.649
0.550–0.599
0.500–0.549 |
Low human development 0.450–0.499
0.400–0.449
0.350–0.399 |
Data unavailable |
- 1982-2008 HDI
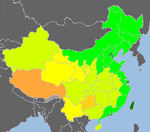 2008 data
 2005 data
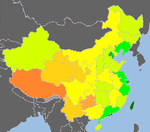 2003 data
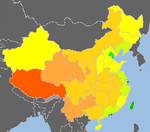 1999 data
 1997 data
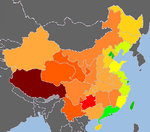 1995 data
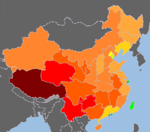 1990 data
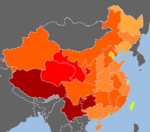 1982 data
See also
References
- ↑ "China National Human Development Report 2016 Social Innovation for Inclusive Human Development" (PDF). China Publishing Group Corporation China Translation & Publishing House China. 2016.
- 1 2 "Human Development Report 2015 – "Work for Human Development"" (PDF). HDRO (Human Development Report Office) United Nations Development Programme. Retrieved 2017-12-05.
- ↑ "Macau in Figures, 2016". 澳門統計暨普查局(DSEC). Retrieved 2017-12-05.
- ↑ "人類發展指數(HDI)" (Excel) (in Chinese). Directorate General of Budget, Accounting and Statistics, Executive Yuan, R.O.C. Retrieved 2017-12-05.
- ↑ "China Sustainable Cities Report 2016: Measuring Ecological Input and Human Development" (PDF). United Nations Development Programme China. 2016.