Kings—Hants Nova Scotia electoral district Nova Scotia electoral district |
|---|
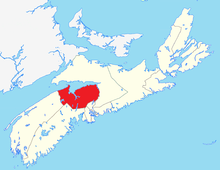 Kings—Hants in relation to the other Nova Scotia federal electoral districts (2003 boundaries) |
| Federal electoral district |
|---|
| Legislature |
House of Commons |
|---|
| MP |
Scott Brison
Liberal |
|---|
| District created |
1966 |
|---|
| First contested |
1968 |
|---|
| Last contested |
2015 |
|---|
| District webpage |
profile, map |
|---|
| Demographics |
|---|
| Population (2016)[1] |
83,465 |
|---|
| Electors (2015) |
66,454 |
|---|
| Area (km²)[2] |
4,124 |
|---|
| Pop. density (per km²) |
20.2 |
|---|
| Census divisions |
Hants, Kings |
|---|
| Census subdivisions |
Cambridge 32, East Hants, Glooscap 35, Hantsport, Indian Brook 14, Kentville, Kings, Subd. A, Kings, Subd. B, Kings, Subd. C, Kings, Subd. D, West Hants, Windsor, Wolfville |
|---|
Kings—Hants (formerly Annapolis Valley—Hants and Annapolis Valley) is a federal electoral district in Nova Scotia, Canada, that has been represented in the House of Commons of Canada since 1968.
It is a largely rural and fairly conservative riding, but its conservatism is in the Red Tory tradition of the rest of the Maritimes, i.e., there is a strong concern for social programs.
Demographics
| Historical population |
|---|
| Year | Pop. | ±% |
|---|
| 2001 | 79,286 | — |
|---|
| 2006 | 81,531 | +2.8% |
|---|
| 2011 | 83,306 | +2.2% |
|---|
| 2016 | 83,465 | +0.2% |
|---|
- According to the Canada 2011 Census; 2013 representation[3][4]
Ethnic groups: 93.8% White, 3.6% Aboriginal, 1.3% Black
Languages: 96.2% English, 1.4% French
Religions: 71.7% Christian (17.4% Baptist, 17.1% Catholic, 15.3% United Church, 12.5% Anglican, 1.7% Presbyterian, 1.5% Pentecostal, 6.1% Other), 27.4% No religion
Median income (2010): $27,133
Average income (2010): $33,726
Election results
Kings—Hants, 2013 Representation Order
| Canadian federal election, 2015 |
| Party |
Candidate |
Votes | % | ±% | Expenditures |
|
Liberal | Scott Brison | 33,026 | 70.74 | +31.19 | $88,355.31 |
|
Conservative | David Morse | 8,677 | 18.59 | –18.05 | $80,877.49 |
|
New Democratic | Hugh Curry | 2,998 | 6.42 | –13.60 | $15,831.09 |
|
Green | Will Cooper | 1,569 | 3.36 | –0.42 | $1,277.65 |
|
Rhinoceros | Megan Brown-Hodges | 184 | 0.39 | – | $730.27 |
|
Independent | Edd Twohig | 132 | 0.28 | – | $1,070.96 |
|
Independent | Cliff James Williams | 100 | 0.21 | – | – |
| Total valid votes/Expense limit |
46,686 | 100.00 | | $200,775.69 |
| Total rejected ballots |
202 | 0.43 |
| Turnout |
46,888 | 70.56 |
| Eligible voters |
66,454 |
|
Liberal hold |
Swing |
+24.62
|
| Source: Elections Canada[5][6] |
Kings—Hants, 2003 Representation Order
| Canadian federal election, 2011 |
| Party |
Candidate |
Votes | % | ±% | Expenditures |
|
Liberal | Scott Brison | 15,887 | 39.56 | -4.62 | $74,312.84 |
|
Conservative | David Morse | 14,714 | 36.63 | +10.49 | $79,610.04 |
|
New Democratic | Mark Rogers | 8,043 | 20.03 | -1.98 | $30,929.92 |
|
Green | Sheila Richardson | 1,520 | 3.78 | -2.46 | $1,566.57 |
| Total valid votes/Expense limit |
40,164 | 100.0 | | $82,155.51 |
| Total rejected, unmarked and declined ballots |
200 | 0.50 | +0.01 |
| Turnout |
40,364 | 61.76 | +3.17 |
| Eligible voters |
65,355 |
|
Liberal hold |
Swing |
-7.56
|
| Sources:[7][8] |
| Canadian federal election, 2008 |
| Party |
Candidate |
Votes | % | ±% | Expenditures |
|
Liberal | Scott Brison | 16,641 | 44.18 | -1.38 | $57,579.50 |
|
Conservative | Rosemary Segado | 9,846 | 26.14 | -6.05 | $59,850.46 |
|
New Democratic | Carol Harris | 8,291 | 22.01 | +2.99 | $19,364.79 |
|
Green | Brendan MacNeill | 2,353 | 6.24 | +4.04 | $2,914.98 |
|
Christian Heritage | Jim Hnatiuk | 528 | 1.40 | – | $11,240.76 |
| Total valid votes/Expense limit |
37,659 | 100.0 | | $79,171 |
| Total rejected, unmarked and declined ballots |
187 | 0.49 | +0.08 |
| Turnout |
37,846 | 58.59 | -6.60 |
| Eligible voters |
64,593 |
|
Liberal hold |
Swing |
+2.34
|
| Canadian federal election, 2006 |
| Party |
Candidate |
Votes | % | ±% | Expenditures |
|
Liberal | Scott Brison | 19,491 | 45.56 | -1.05 | $74,044.26 |
|
Conservative | Bob Mullan | 13,772 | 32.19 | +2.07 | $65,675.63 |
|
New Democratic | Mary Dewolfe | 8,138 | 19.02 | +1.33 | $19,691.41 |
|
Green | Sheila Richardson | 947 | 2.21 | -1.41 | $1,181.00 |
|
Marijuana | Chummy Anthony | 436 | 1.02 | – | none listed |
| Total valid votes/Expense limit |
42,784 | 100.0 | | $74,073 |
| Total rejected, unmarked and declined ballots |
177 | 0.41 | -0.35 |
| Turnout |
42,961 | 65.19 | +2.77 |
| Eligible voters |
65,898 |
|
Liberal hold |
Swing |
-1.56
|
| Canadian federal election, 2004 |
| Party |
Candidate |
Votes | % | ±% | Expenditures |
|
Liberal | Scott Brison | 17,555 | 46.61 | +16.11 | $68,487.35 |
|
Conservative | Bob Mullan | 11,344 | 30.12 | -19.42 | $64,737.24 |
|
New Democratic | Skip Hambling | 6,663 | 17.69 | +0.08 | $24,085.01 |
|
Green | Kevin Stacey | 1,364 | 3.62 | – | $2,710.55 |
|
Christian Heritage | Jim Hnatiuk | 493 | 1.31 | – | $7,088.07 |
|
Independent | Richard Hennigar | 242 | 0.64 | +0.34 | $5,710.00 |
| Total valid votes/Expense limit |
37,661 | 100.0 | | $70,804 |
| Total rejected, unmarked and declined ballots |
289 | 0.76 |
| Turnout |
37,950 | 62.42 |
| Eligible voters |
60,801 |
|
Liberal gain from Progressive Conservative |
Swing |
+18.56
|
| Changes from 2000 are based on redistributed results. Changes for Liberal candidate Scott Brison from 2000 are based on the Liberal Party's results. He received +6.48% votes from his results as a Progressive Conservative. Conservative Party change is based on the combination of Canadian Alliance and Progressive Conservative Party totals. Change for independent candidate Richard Hennigar is based on his 2000 results as a Natural Law candidate (results not redistributed). |
Kings—Hants, 1996 Representation Order
All changes are based on the 2000 by-election, except the Liberal Party and the Natural Law Party, which did not field a candidate; and Communist Party candidate Graham Jake MacDonald, who ran as an Independent.
| Canadian federal by-election, September 11, 2000 |
| Party |
Candidate |
Votes | % | ±% | Expenditures |
| |
Progressive Conservative |
Joe Clark |
14,525 |
53.45 |
+17.18 |
$38,552 |
|
New Democratic | Kaye Johnson | 7,375 | 27.14 | +8.17 | $45,722 |
|
Alliance | Gerry Fulton | 4,385 | 16.14 | +2.75 | $40,044 |
| |
N/A (Marijuana) |
Alex Néron |
670 |
2.47 |
|
$371 |
| |
Independent |
John Turmel |
221 |
0.81 |
|
$0 |
| Total valid votes |
27,176 | 100.00 |
| Total rejected ballots |
232 |
| Turnout |
27,408 | 39.54 |
| Electors on the lists |
69,319 |
| Cause of by-election: resignation of Scott Brison on July 24, 2000. Canadian Alliance percentages are contrasted with the Reform Party figures from 1997. Sources: Official Results, Elections Canada and Financial Returns, Elections Canada. |
Annapolis Valley—Hants
Changes from the 1988 election for both Progressive Conservative candidate Jim White and Independent candidate Pat Nowlan are based on the same 1988 result, when Pat Nowlan ran as a Progressive Conservative. Independent Rik Gates was the youngest candidate to run for MP at the age of twenty two.