Japanese general election, 1983
|
|
|
All 511 seats to the House of Representatives of Japan
256 seats needed for a majority |
|---|
| Turnout |
67.94% ( 6.63%) 6.63%) |
|---|
| |
First party |
Second party |
Third party |
| |
 |
|
|
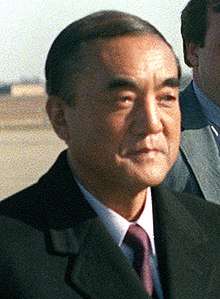
| Leader |
Yasuhiro Nakasone |
Masashi Ishibashi |
Yoshikatsu Takeiri |
| Party |
Liberal Democratic |
Socialist |
Komeito |
| Last election |
284 seats, 47.88% |
107 seats, 19.31% |
33 seats, 9.03% |
| Seats won |
250 |
112 |
58 |
| Seat change |
34 |
 5 5 |
25 |
| Popular vote |
25,982,785 |
11,065,082 |
5,745,751 |
| Percentage |
45.76% |
19.49% |
10.12% |
| Swing |
2.12% |
0.18% |
1.09% |
|
| |
Fourth party |
Fifth party |
Sixth party |
| |
 |
|
|
| Leader |
Sasaki Ryōsaku |
Sanzō Nosaka |
Seiichi Tagawa |
| Party |
Democratic Socialist |
Communist |
New Liberal |
| Last election |
32 seats, 6.60% |
29 seats, 9.83% |
12 seats, 2.99% |
| Seats won |
38 |
26 |
8 |
| Seat change |
6 |
3 |
4 |
| Popular vote |
4,129,907 |
5,302,485 |
1,341,584 |
| Percentage |
7.27% |
9.34% |
2.36% |
| Swing |
0.67% |
0.49% |
0.63% |
|
| |
Seventh party |
|
| |
|
|
| Leader |
Hideo Den |
|
| Party |
Socialist Democratic |
|
| Last election |
3 seats, 0.68% |
|
| Seats won |
3 |
|
| Seat change |
 0 0 |
|
| Popular vote |
381,045 |
|
| Percentage |
0.63% |
|
| Swing |
0.05% |
|
|
|
The Japanese general election, 1983 was an election held in Japan in 1983 for the House of Representatives.
Election results
Summary of the 18 December 1983 Japanese House of Representatives election results[1][2]
| Parties |
Candidates | Votes[3] | % | Seats | +/-
(last election) |
| |
Liberal Democratic Party (LDP) |
339 | 25,982,785 | 45.76% | 250 | 34 |
| |
Japanese Socialist Party (JSP) |
144 | 11,065,082 | 19.49% | 112 | 5 |
| |
Japanese Communist Party (JCP) |
129 | 5,302,485 | 9.34% | 26 | 3 |
| |
Justice Party |
59 | 5,745,751 | 10.12% | 58 | 25 |
| Democratic Socialist Party (DSP) |
54 | 4,129,907 | 7.27% | 38 | 6 |
| New Liberal Club (NLC) |
17 | 1,341,584 | 2.36% | 8 | 4 |
| Social Democratic Federation (SDF) |
4 | 381,045 | 0.67% | 3 | 0 |
| Center-left opposition |
134 | 11,598,287 | 20.43% | 107 | 27 |
| |
Others |
18 | 62,323 | 0.11% | 0 | 0 |
| |
Independents |
84 | 2,768,735 | 4.88% | 16 | 5 |
| Totals (Turnout 67.9%) |
848 | 56,779,697 | 100.00% | 511 | 0 |
| Vote share |
|---|
|
|
|
|
|
| LDP |
|
45.76% |
| JSP |
|
19.49% |
| KP |
|
10.12% |
| JCP |
|
9.34% |
| DSP |
|
7.27% |
| NLC |
|
2.36% |
| SDF |
|
0.67% |
| Independents |
|
4.88% |
| Others |
|
0.11% |
|
| Parliament seats |
|---|
|
|
|
|
|
| LDP |
|
48.92% |
| JSP |
|
21.92% |
| KP |
|
11.35% |
| DSP |
|
7.44% |
| JCP |
|
5.09% |
| NLC |
|
1.57% |
| SDF |
|
0.59% |
| Independents |
|
3.13% |
|