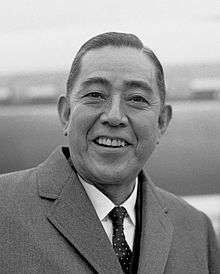
Japanese general election, 1969
|
| ||||||||||||||||||||||||||||||||||||||||||||||||||||||||||||||||||||
| ||||||||||||||||||||||||||||||||||||||||||||||||||||||||||||||||||||
All 486 seats to the House of Representatives of Japan 244 seats needed for a majority | ||||||||||||||||||||||||||||||||||||||||||||||||||||||||||||||||||||
|---|---|---|---|---|---|---|---|---|---|---|---|---|---|---|---|---|---|---|---|---|---|---|---|---|---|---|---|---|---|---|---|---|---|---|---|---|---|---|---|---|---|---|---|---|---|---|---|---|---|---|---|---|---|---|---|---|---|---|---|---|---|---|---|---|---|---|---|---|
| Turnout |
68.51% ( | |||||||||||||||||||||||||||||||||||||||||||||||||||||||||||||||||||
| ||||||||||||||||||||||||||||||||||||||||||||||||||||||||||||||||||||
| ||||||||||||||||||||||||||||||||||||||||||||||||||||||||||||||||||||
 |
|---|
| This article is part of a series on the politics and government of Japan |
|
Foreign relations |
|
|
General elections were held in Japan on 27 December 1969. The result was a victory for the Liberal Democratic Party, which won 288 of the 486 seats. [1] Voter turnout was 68.51%.
Results
| Party | Votes | % | Seats | +/- |
|---|---|---|---|---|
| Liberal Democratic Party | 22,381,570 | 47.6 | 288 | +11 |
| Japan Socialist Party | 10,074,101 | 21.4 | 90 | -50 |
| Komeitō | 5,124,666 | 10.9 | 47 | +22 |
| Democratic Socialist Party | 3,636,591 | 7.7 | 31 | +1 |
| Japanese Communist Party | 3,199,032 | 6.8 | 14 | +9 |
| Other parties | 81,373 | 0.2 | 0 | 0 |
| Independents | 2,492,560 | 5.3 | 16 | +7 |
| Total | 47,442,400 | 100 | 486 | 0 |
| Source: http://www.stat.go.jp/data/chouki/27.htm | ||||
References
This article is issued from
Wikipedia.
The text is licensed under Creative Commons - Attribution - Sharealike.
Additional terms may apply for the media files.

