Churchill—Keewatinook Aski
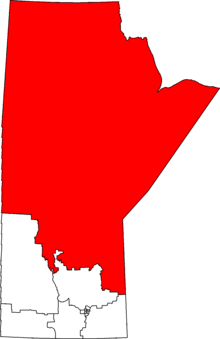 Churchill—Keewatinook Aski in relation to other Manitoba federal electoral districts as of the 2013 Representation Order. | |||
| Federal electoral district | |||
| Legislature | House of Commons | ||
| MP |
New Democratic | ||
| District created | 1933 | ||
| First contested | 1935 | ||
| Last contested | 2015 | ||
| District webpage | profile, map | ||
| Demographics | |||
| Population (2011)[1] | 85,148 | ||
| Electors (2015) | 47,940 | ||
| Area (km²)[1] | 494,701 | ||
| Pop. density (per km²) | 0.17 | ||
| Census divisions | Division No. 19, Division No. 21, Division No. 22, Division No. 23 | ||
| Census subdivisions | Thompson, Flin Flon, The Pas, Churchill, Norway House 17, St. Theresa Point, Kelsey, Opaskwayak Cree Nation 21E, Fort Alexander 3, Nelson House 170 | ||
Churchill—Keewatinook Aski (formerly Churchill) is a federal electoral district in Manitoba, Canada, that has been represented in the House of Commons of Canada since 1935. It covers the northern four-fifths of Manitoba, a vast wilderness area dotted with small municipalities and First Nations reserves. It was named after the town of Churchill, Manitoba, which resides on Churchill River. It is the fifth-largest riding in all of Canada.
The riding has the highest percentage of Aboriginal peoples (61.1%) in Canada.;[2] the highest percentage of Cree speakers - both those whose mother tongue (21.6%) is Cree[3] as well as those that use it as home language (16.6%)[4] - is also to be found there.
History
The riding was created in 1933 when Nelson riding was abolished. The entire area of Nelson was transferred into the new riding of Churchill.
This riding gained territory from Selkirk—Interlake and was renamed "Churchill—Keewatinook Aski" during the 2012 electoral redistribution.
2006 election
Incumbent Bev Desjarlais[5] ran as an independent candidate in the 2006 election. The New Democratic Party candidate was Niki Ashton,[6] daughter of Manitoba Member of the Legislative Assembly (MLA) and cabinet minister Steve Ashton. The Liberals fielded actress Tina Keeper, who won the election.[7] The Conservatives nominated longtime party member and Flin Flon city councillor Nazir Ahmad,[8] while the Greens ran former substitute teacher Jeff Fountain.[9] Brad Bodnar, a resident of The Pas, ran as an independent.
2008 election
The New Democratic Party candidate was Niki Ashton,[6] for the second time. The Liberals fielded incumbent Tina Keeper.[10] The Conservatives nominated Wally Daudrich.[11] The fourth candidate was Green Party of Canada new-comer, Saara Harvie.[12]
Members of Parliament
This riding has elected the following Members of Parliament:
| Parliament | Years | Member | Party | |
|---|---|---|---|---|
| Churchill Riding created from Nelson |
||||
| 18th | 1935–1940 | Thomas Crerar | Liberal | |
| 19th | 1940–1945 | |||
| 20th | 1945–1949 | Ronald Moore | Co-operative Commonwealth | |
| 21st | 1949–1953 | George Weaver | Liberal | |
| 22nd | 1953–1957 | |||
| 23rd | 1957–1958 | Robert Simpson | Progressive Conservative | |
| 24th | 1958–1962 | |||
| 25th | 1962–1963 | |||
| 26th | 1963–1965 | |||
| 27th | 1965–1968 | |||
| 28th | 1968–1972 | |||
| 29th | 1972–1974 | Charles Keith Taylor | ||
| 30th | 1974–1979 | Cecil Smith | ||
| 31st | 1979–1980 | Rod Murphy | New Democratic | |
| 32nd | 1980–1984 | |||
| 33rd | 1984–1988 | |||
| 34th | 1988–1993 | |||
| 35th | 1993–1997 | Elijah Harper | Liberal | |
| 36th | 1997–2000 | Bev Desjarlais | New Democratic | |
| 37th | 2000–2004 | |||
| 38th | 2004–2005 | |||
| 2005–2006 | Independent | |||
| 39th | 2006–2008 | Tina Keeper | Liberal | |
| 40th | 2008–2011 | Niki Ashton | New Democratic | |
| 41st | 2011–2015 | |||
| Churchill—Keewatinook Aski | ||||
| 42nd | 2015–Present | Niki Ashton | New Democratic | |
Current Member of Parliament
Its Member of Parliament (MP) is Niki Ashton. Ashton ran in the 2006 election, but lost to Tina Keeper. She is a member of the New Democratic Party.
Election results
Churchill—Keewatinook Aski, 2015–present
| Canadian federal election, 2015 | ||||||||
|---|---|---|---|---|---|---|---|---|
| Party | Candidate | Votes | % | ±% | Expenditures | |||
| New Democratic | Niki Ashton | 13,487 | 45.04 | -6.65 | $107,253.16 | |||
| Liberal | Rebecca Chartrand | 12,575 | 42.00 | +22.13 | $108,676.93 | |||
| Conservative | Kyle G. Mirecki | 3,090 | 10.32 | -15.81 | – | |||
| Green | August Hastmann | 537 | 1.79 | -0.52 | – | |||
| Libertarian | Zachary Linnick | 255 | 0.85 | – | – | |||
| Total valid votes/Expense limit | 29,944 | 100.00 | $233,135.69 | |||||
| Total rejected ballots | 252 | 0.83 | – | |||||
| Turnout | 30,196 | 61.58 | – | |||||
| Eligible voters | 49,036 | |||||||
| New Democratic hold | Swing | -14.39 | ||||||
| Source: Elections Canada[13][14] | ||||||||
| 2011 federal election redistributed results[15] | |||
|---|---|---|---|
| Party | Vote | % | |
| New Democratic | 10,962 | 51.70 | |
| Conservative | 5,540 | 26.13 | |
| Liberal | 4,212 | 19.86 | |
| Green | 491 | 2.32 | |
Churchill, 1935–2015
| Canadian federal election, 2011 | ||||||||
|---|---|---|---|---|---|---|---|---|
| Party | Candidate | Votes | % | ±% | Expenditures | |||
| New Democratic | Niki Ashton | 10,262 | 51.12 | +3.36 | – | |||
| Conservative | Wally Daudrich | 5,256 | 26.18 | +5.68 | – | |||
| Liberal | Sydney Garrioch | 4,087 | 20.36 | -8.38 | – | |||
| Green | Alberteen Spence | 471 | 2.35 | -0.94 | – | |||
| Total valid votes/Expense limit | 20,076 | 100.00 | ||||||
| Total rejected ballots | 107 | 0.53 | -0.02 | |||||
| Turnout | 20,183 | 45.35 | +5.20 | |||||
| Eligible voters | 44,509 | – | – | |||||
| Canadian federal election, 2008 | ||||||||
|---|---|---|---|---|---|---|---|---|
| Party | Candidate | Votes | % | ±% | Expenditures | |||
| New Democratic | Niki Ashton | 8,734 | 47.76 | +19.35 | $79,086 | |||
| Liberal | Tina Keeper | 5,289 | 28.74 | -11.94 | – | |||
| Conservative | Wally Daudrich | 3,773 | 20.50 | +8.95 | $45,616 | |||
| Green | Saara Harvie | 606 | 3.29 | +1.69 | $28 | |||
| Total valid votes/Expense limit | 18,402 | 100.00 | $91,452 | |||||
| Total rejected ballots | 102 | 0.55 | +0.19 | |||||
| Turnout | 18,504 | 40.15 | -13.48 | |||||
| New Democrat gain from Liberal | Swing | + | ||||||
| Canadian federal election, 2006 | ||||||||
|---|---|---|---|---|---|---|---|---|
| Party | Candidate | Votes | % | ±% | Expenditures | |||
| Liberal | Tina Keeper | 10,159 | 40.68 | +2.3 | $75,179 | |||
| New Democratic | Niki Ashton | 7,103 | 28.41 | -15.0 | $70,290 | |||
| Independent | Bev Desjarlais | 4,283 | 17.15 | -26.3 | $23,042 | |||
| Conservative | Nazir Ahmad | 2,886 | 11.55 | -3.6 | $23,875 | |||
| Green | Jeff Fountain | 401 | 1.60 | -1.4 | $2,837 | |||
| Independent | Brad Bodnar | 146 | 0.58 | – | $69 | |||
| Total valid votes | 24,966 | 100.00 | – | |||||
| Total rejected ballots | 90 | 0.36 | – | |||||
| Turnout | 25,056 | 53.63 | +14.1 | |||||
| Liberal gain from New Democrat | Swing | +8.7 | ||||||
| Canadian federal election, 2004 | ||||||||
|---|---|---|---|---|---|---|---|---|
| Party | Candidate | Votes | % | ±% | Expenditures | |||
| New Democratic | Bev Desjarlais | 8,612 | 43.4 | -1.5 | $45,705 | |||
| Liberal | Ron Evans | 7,604 | 38.4 | +6.1 | $61,955 | |||
| Conservative | Bill Archer | 2,999 | 15.1 | -7.7 | $10,379 | |||
| Green | David Nickarz | 612 | 3.1 | – | $646 | |||
| Total valid votes | 19,827 | 100.0 | – | |||||
| Total rejected ballots | 88 | 0.4 | 0.0 | |||||
| Turnout | 19,915 | 41.4 | -9.7 | |||||
Note: Conservative vote is compared to the total of the Canadian Alliance vote and Progressive Conservative vote in 2000 election.
| Canadian federal election, 2000 | ||||||||
|---|---|---|---|---|---|---|---|---|
| Party | Candidate | Votes | % | ±% | Expenditures | |||
| New Democratic | Bev Desjarlais | 10,477 | 44.9 | +3.8 | $41,854 | |||
| Liberal | Elijah Harper | 7,514 | 32.2 | +2.9 | $55,871 | |||
| Alliance | Jason Shaw | 4,126 | 17.7 | -1.3 | $7,444 | |||
| Progressive Conservative | Doreen Murray | 1,198 | 5.1 | -5.4 | $2,722 | |||
| Total valid votes | 23,315 | 100.0 | – | |||||
| Total rejected ballots | 98 | 0.4 | -0.3 | |||||
| Turnout | 23,413 | 51.1 | +0.8 | |||||
Note: Canadian Alliance vote is compared to the Reform vote in 1997 election.
| Canadian federal election, 1997 | ||||||||
|---|---|---|---|---|---|---|---|---|
| Party | Candidate | Votes | % | ±% | Expenditures | |||
| New Democratic | Bev Desjarlais | 9,616 | 41.2 | +4.3 | $45,525 | |||
| Liberal | Elijah Harper | 6,852 | 29.3 | -11.4 | $59,373 | |||
| Reform | Corky Peterson | 4,438 | 19.0 | +9.4 | $11,803 | |||
| Progressive Conservative | Don Knight | 2,452 | 10.5 | +0.2 | $10,729 | |||
| Total valid votes | 23,358 | 100.0 | – | |||||
| Total rejected ballots | 158 | 0.7 | – | |||||
| Turnout | 23,516 | 50.3 | – | |||||
| Canadian federal election, 1993 | ||||||||
|---|---|---|---|---|---|---|---|---|
| Party | Candidate | Votes | % | ±% | ||||
| Liberal | Elijah Harper | 9,658 | 40.7 | +17.7 | ||||
| New Democratic | Rod Murphy | 8,751 | 36.9 | -19.5 | ||||
| Progressive Conservative | Don Knight | 2,438 | 10.3 | -10.3 | ||||
| Reform | Wally Daudrich | 2,275 | 9.6 | |||||
| National | Charles Settee | 590 | 2.5 | – | ||||
| Total valid votes | 23,712 | 100.0 | ||||||
| Canadian federal election, 1988 | ||||||||
|---|---|---|---|---|---|---|---|---|
| Party | Candidate | Votes | % | ±% | ||||
| New Democratic | Rod Murphy | 14,168 | 56.4 | +10.8 | ||||
| Liberal | Rodney Spence | 5,800 | 23.1 | +5.1 | ||||
| Progressive Conservative | Nazir Ahmad | 5,164 | 20.5 | -13.2 | ||||
| Total valid votes | 25,132 | 100.0 | ||||||
| Canadian federal election, 1984 | ||||||||
|---|---|---|---|---|---|---|---|---|
| Party | Candidate | Votes | % | ±% | ||||
| New Democratic | Rod Murphy | 10,829 | 45.6 | +2.3 | ||||
| Progressive Conservative | Harvey Hanson | 8,010 | 33.7 | +8.2 | ||||
| Liberal | Jack Kennedy | 4,272 | 18.0 | -11.8 | ||||
| Independent | Andrew Kirkness | 377 | 1.6 | – | ||||
| Libertarian | Ketih B.P. Muirhead | 281 | 1.2 | |||||
| Total valid votes | 23,769 | 100.0 | ||||||
| Canadian federal election, 1980 | ||||||||
|---|---|---|---|---|---|---|---|---|
| Party | Candidate | Votes | % | ±% | ||||
| New Democratic | Rod Murphy | 10,319 | 43.3 | -8.4 | ||||
| Liberal | Alan Ross | 7,092 | 29.7 | +13.5 | ||||
| Progressive Conservative | Cec Smith | 6,084 | 25.5 | -6.6 | ||||
| Rhinoceros | Roland Campbell | 352 | 1.5 | |||||
| Total valid votes | 23,847 | 100.0 | ||||||
| Canadian federal election, 1979 | ||||||||
|---|---|---|---|---|---|---|---|---|
| Party | Candidate | Votes | % | ±% | ||||
| New Democratic | Rod Murphy | 12,544 | 51.7 | +21.0 | ||||
| Progressive Conservative | Cecil Smith | 7,802 | 32.1 | -8.8 | ||||
| Liberal | Andrew Kirkness | 3,936 | 16.2 | -10.1 | ||||
| Total valid votes | 24,282 | 100.0 | ||||||
| Canadian federal election, 1974 | ||||||||
|---|---|---|---|---|---|---|---|---|
| Party | Candidate | Votes | % | ±% | ||||
| Progressive Conservative | Cecil Smith | 11,225 | 40.9 | +6.4 | ||||
| New Democratic | Dan Reagan | 8,415 | 30.7 | -2.4 | ||||
| Liberal | Jean René Allard | 7,212 | 26.3 | -4.9 | ||||
| Social Credit | Ed Heinrichs | 577 | 2.1 | |||||
| Total valid votes | 27,429 | 100.0 | ||||||
| Canadian federal election, 1972 | ||||||||
|---|---|---|---|---|---|---|---|---|
| Party | Candidate | Votes | % | ±% | ||||
| Progressive Conservative | Keith Taylor | 9,462 | 34.6 | -7.2 | ||||
| New Democratic | Don Duff | 9,059 | 33.1 | +10.4 | ||||
| Liberal | Bruce Dunlop | 8,536 | 31.2 | -4.4 | ||||
| Independent | R. Jim Henry | 327 | 1.2 | |||||
| Total valid votes | 27,384 | 100.0 | ||||||
| Canadian federal election, 1968 | ||||||||
|---|---|---|---|---|---|---|---|---|
| Party | Candidate | Votes | % | ±% | ||||
| Progressive Conservative | Robert Simpson | 9,009 | 41.8 | -9.2 | ||||
| Liberal | Frank Dembinsky | 7,673 | 35.6 | +8.6 | ||||
| New Democratic | Brian Koshul | 4,888 | 22.7 | +7.0 | ||||
| Total valid votes | 21,570 | 100.0 | ||||||
| Canadian federal election, 1965 | ||||||||
|---|---|---|---|---|---|---|---|---|
| Party | Candidate | Votes | % | ±% | ||||
| Progressive Conservative | Robert Simpson | 10,773 | 51.0 | -2.3 | ||||
| Liberal | F.L. Jobin | 5,694 | 27.0 | -6.1 | ||||
| New Democratic | Ken MacMaster | 3,306 | 15.6 | +2.0 | ||||
| Social Credit | Curt R. Shielman | 1,352 | 6.4 | |||||
| Total valid votes | 21,125 | 100.0 | ||||||
| Canadian federal election, 1963 | ||||||||
|---|---|---|---|---|---|---|---|---|
| Party | Candidate | Votes | % | ±% | ||||
| Progressive Conservative | Robert Simpson | 11,707 | 53.3 | +2.0 | ||||
| Liberal | Bruce Dunlop | 7,253 | 33.0 | +2.5 | ||||
| New Democratic | Florence Matthews | 2,990 | 13.6 | -4.5 | ||||
| Total valid votes | 21,950 | 100.0 | ||||||
| Canadian federal election, 1962 | ||||||||
|---|---|---|---|---|---|---|---|---|
| Party | Candidate | Votes | % | ±% | ||||
| Progressive Conservative | Robert Simpson | 10,943 | 51.3 | -13.4 | ||||
| Liberal | Francis Laurence Jobin | 6,511 | 30.6 | +7.2 | ||||
| New Democratic | Florence Matthews | 3,858 | 18.1 | +6.2 | ||||
| Total valid votes | 21,312 | 100.0 | ||||||
Note: NDP vote is compared to CCF vote in 1958 election.
| Canadian federal election, 1958 | ||||||||
|---|---|---|---|---|---|---|---|---|
| Party | Candidate | Votes | % | ±% | ||||
| Progressive Conservative | Robert Simpson | 11,506 | 64.7 | +25.9 | ||||
| Liberal | Lorne Paterson Ferg | 4,159 | 23.4 | -7.9 | ||||
| Co-operative Commonwealth | Jack Freedman | 2,118 | 11.9 | +0.2 | ||||
| Total valid votes | 17,783 | 100.0 | ||||||
| Canadian federal election, 1957 | ||||||||
|---|---|---|---|---|---|---|---|---|
| Party | Candidate | Votes | % | ±% | ||||
| Progressive Conservative | Robert Simpson | 6,191 | 38.8 | +20.8 | ||||
| Liberal | George Dyer Weaver | 4,993 | 31.3 | -9.1 | ||||
| Social Credit | Bruce Moore | 2,891 | 18.1 | -2.1 | ||||
| Co-operative Commonwealth | Gerald Robert Clarkson | 1,870 | 11.7 | -6.9 | ||||
| Total valid votes | 15,945 | 100.0 | ||||||
| Canadian federal election, 1953 | ||||||||
|---|---|---|---|---|---|---|---|---|
| Party | Candidate | Votes | % | ±% | ||||
| Liberal | George Dyer Weaver | 4,984 | 40.4 | -5.2 | ||||
| Progressive Conservative | William George Thompson | 2,567 | 20.8 | -3.0 | ||||
| Social Credit | Delbert Leroy Downs | 2,490 | 20.2 | |||||
| Co-operative Commonwealth | Ronald Stewart Moore | 2,293 | 18.6 | -12.0 | ||||
| Total valid votes | 12,334 | 100.0 | ||||||
| Canadian federal election, 1949 | ||||||||
|---|---|---|---|---|---|---|---|---|
| Party | Candidate | Votes | % | ±% | ||||
| Liberal | George Dyer Weaver | 6,847 | 45.6 | +13.2 | ||||
| Co-operative Commonwealth | Ronald Stewart Moore | 4,595 | 30.6 | -8.2 | ||||
| Progressive Conservative | Robert Franklin Milton | 3,570 | 23.8 | -5.1 | ||||
| Total valid votes | 15,012 | 100.0 | ||||||
| Canadian federal election, 1945 | ||||||||
|---|---|---|---|---|---|---|---|---|
| Party | Candidate | Votes | % | ±% | ||||
| Co-operative Commonwealth | Ronald Moore | 5,226 | 38.8 | |||||
| Liberal | George Dyer Weaver | 4,359 | 32.4 | -30.1 | ||||
| Progressive Conservative | Cecil Ruddock Neely | 3,884 | 28.8 | -8.7 | ||||
| Total valid votes | 13,469 | 100.0 | ||||||
Note: Progressive Conservative vote is compared to "National Government" vote in 1940 election.
| Canadian federal election, 1940 | ||||||||
|---|---|---|---|---|---|---|---|---|
| Party | Candidate | Votes | % | ±% | ||||
| Liberal | Thomas Crerar | 8,276 | 62.5 | +22.5 | ||||
| National Government | Will Blakeman Scarth | 4,963 | 37.5 | +3.2 | ||||
| Total valid votes | 13,239 | 100.0 | ||||||
Note: "National Government" vote is compared to Conservative vote in 1935 election.
| Canadian federal election, 1935 | ||||||||
|---|---|---|---|---|---|---|---|---|
| Party | Candidate | Votes | % | |||||
| Liberal | Thomas Crerar | 3,603 | 40.0 | |||||
| Conservative | Barney M. Stitt | 3,091 | 34.3 | |||||
| Co-operative Commonwealth | Alexander Stewart | 2,313 | 25.7 | |||||
| Total valid votes | 9,007 | 100.0 | ||||||
See also
References
- "(Code 46003) Census Profile". 2011 census. Statistics Canada. 2012. Retrieved 2011-03-03.
- Riding history for Churchill (1933– ) from the Library of Parliament
- Expenditures - 2008
- Expenditures - 2004
- Expenditures - 2000
- Expenditures - 1997
Notes
- 1 2 Statistics Canada: 2012
- ↑ "Aboriginal Identity (8), Sex (3) and Age Groups (12) for the Population of Canada, Provinces, Territories and Federal Electoral Districts (2003 Representation Order), 2006 Census - 20% Sample Data". 2.statcan.gc.ca. Retrieved 2012-11-19.
- ↑ "2011 Census of Canada: Topic-based tabulations | Detailed Mother Tongue (232), Knowledge of Official Languages (5), Age Groups (17A) and Sex (3) for the Population Excluding Institutional Residents of Canada, Provinces, Territories and Federal Electoral Districts (2003 Representation Order), 2011 Census". 2.statcan.gc.ca. Retrieved 2012-11-19.
- ↑ "First Official Language Spoken (7), Detailed Language Spoken Most Often at Home (232), Age Groups (17A) and Sex (3) for the Population Excluding Institutional Residents of Canada, Provinces, Territories and Federal Electoral Districts (2003 Representation Order), 2011 Census". 2.statcan.gc.ca. Retrieved 2012-11-19.
- ↑ "Archived copy". Archived from the original on 2005-12-10. Retrieved 2005-12-02.
- 1 2 "Archived copy". Archived from the original on 2011-12-19. Retrieved 2011-11-21.
- ↑ CBC.ca 25 Oct 2005
- ↑ Conservative Party website
- ↑ Gren Party website Archived 2007-03-13 at the Wayback Machine.
- ↑ "Archived copy". Archived from the original on 2008-09-24. Retrieved 2008-10-15.
- ↑ http://www.wallydaudrich.ca/%5Bpermanent+dead+link%5D
- ↑ "Archived copy". Archived from the original on 2008-09-30. Retrieved 2008-10-15.
- ↑ Elections Canada – Confirmed candidates for Churchill—Keewatinook Aski, 30 September 2015
- ↑ Elections Canada – Preliminary Election Expenses Limits for Candidates Archived August 15, 2015, at the Wayback Machine.
- ↑ Pundits' Guide to Canadian Elections