Calgary Centre
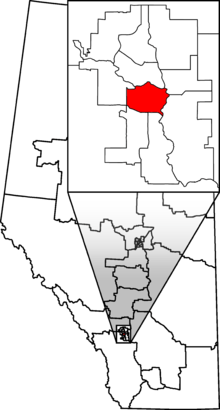 Calgary Centre in relation to other Alberta federal electoral districts as of the 2013 Representation Order. | |||
| Coordinates: | 51°02′25″N 114°06′06″W / 51.04028°N 114.10167°WCoordinates: 51°02′25″N 114°06′06″W / 51.04028°N 114.10167°W | ||
| Federal electoral district | |||
| Legislature | House of Commons | ||
| MP |
Liberal | ||
| District created | 1966 | ||
| First contested | 1968 | ||
| Last contested | 2015 | ||
| District webpage | profile, map | ||
| Demographics | |||
| Population (2011)[1] | 108,931 | ||
| Electors (2015) | 84,960 | ||
| Area (km²)[1] | 49 | ||
| Pop. density (per km²) | 2,223.1 | ||
| Census divisions | Division No. 6 | ||
| Census subdivisions | Calgary | ||
Calgary Centre (French: Calgary-Centre; formerly known as Calgary South Centre) is a federal electoral district in Alberta, Canada, that has been represented in the House of Commons of Canada since 1968. The riding consists of many young adults who have a relatively high average household income and education level. As the riding encompasses the downtown core and large swaths of apartment blocks in the communities west and south of downtown, Calgary Centre has a low home ownership rate compared to the rest of Canada.
History
The original Calgary Centre was created in 1966 from parts of the former electoral districts of Calgary North and Calgary South. This riding was abolished in the 2003 Representation Order when parts of it went to the neighbouring electoral districts of Calgary North Centre and Calgary West and to Calgary South Centre. The latter was renamed Calgary Centre in 2004. When it was created in 2003 (as Calgary South Centre), it included 70,972 people from the abolished district of Calgary Centre, 38,889 people from Calgary West and 7,578 from Calgary Southwest.
The riding was notable at the 2000 federal election when residents elected former Prime Minister Joe Clark, representing the Progressive Conservatives, making the riding one of the few areas in Alberta that did not elect a candidate from the Canadian Alliance.
This riding lost territory to Calgary Signal Hill and gained territory from Calgary East during the 2012 electoral redistribution.
Geography
The riding contains the neighbourhoods of Downtown Calgary, Beltline, Mission, Cliff Bungalow, Mount Royal, Elbow Park, Scarboro, Sunalta, Shaganappi, Killarney/Glengarry, Richmond, Bankview, South Calgary, Rutland Park, CFB - Currie, Lincoln Park, CFB - Lincoln Park, Altadore, North Glenmore Park, Britannia, Elboya, Windsor Park, Manchester, Bel-Aire, Mayfair, Meadowlark Park, Inglewood, Ramsay, Parkhill, Erlton, Rideau/Roxboro, Eau Claire, Chinatown, Downtown East Village
Demographics
Ethnic groups (2006): 78.80% White, 5.89% Chinese, 2.76% Black, 2.44% Aboriginal, 2.29% South Asian, 2.05% Filipino, 1.21% Latin American, 1.09% Arab
Languages (2011): 73.19% English, 4.13% Chinese, 2.09% French, 2.04% Spanish, 1.76% Tagalog, 1.21% Arabic, 1.21% Korean
Religions (2001): 32.63% Protestant, 24.52% Catholic, 2.23% Christian Orthodox, 4.88% Other Christian, 2.60% Muslim, 1.09% Jewish, 1.04% Buddhist, 30.14% No religion
Median income (2005): $30,729
Members of Parliament
This riding has elected the following members of the House of Commons of Canada:
| Parliament | Years | Member | Party | |
|---|---|---|---|---|
| Calgary Centre Riding created from Calgary North and Calgary South |
||||
| 28th | 1968–1972 | Douglas Harkness | Progressive Conservative | |
| 29th | 1972–1974 | Harvie Andre | ||
| 30th | 1974–1979 | |||
| 31st | 1979–1980 | |||
| 32nd | 1980–1984 | |||
| 33rd | 1984–1988 | |||
| 34th | 1988–1993 | |||
| 35th | 1993–1997 | Jim Silye | Reform | |
| 36th | 1997–2000[nb 1] | Eric Lowther | ||
| 2000–2000 | Alliance | |||
| 37th | 2000–2003[nb 2] | Joe Clark | Progressive Conservative | |
| 2003–2004 | Independent | |||
| 38th | 2004–2006 | Lee Richardson | Conservative | |
| 39th | 2006–2008 | |||
| 40th | 2008–2011 | |||
| 41st | 2011–2012[nb 3] | |||
| 2012–2015 | Joan Crockatt | |||
| 42nd | 2015–Present | Kent Hehr | Liberal | |
Current Member of Parliament
This seat is held by Kent Hehr, a former MLA for Calgary-Buffalo. Hehr, a member of the Liberal Party of Canada, was elected in the 2015 federal election.
Election results
Calgary Centre, 2006–present
| Canadian federal election, 2015 | ||||||||
|---|---|---|---|---|---|---|---|---|
| Party | Candidate | Votes | % | ±% | Expenditures | |||
| Liberal | Kent Hehr | 28,496 | 46.52 | +27.40 | $190,509.57 | |||
| Conservative | Joan Crockatt | 27,746 | 45.30 | -10.07 | $157,845.73 | |||
| New Democratic | Jillian Ratti | 3,412 | 5.57 | -9.59 | $19,466.71 | |||
| Green | Thana Boonlert | 1,347 | 2.20 | -8.13 | $3,584.84 | |||
| Independent | Yogi Henderson | 248 | 0.39 | $1,203.28 | ||||
| Total valid votes/Expense limit | 61,249 | 100.00 | $222,181.20 | |||||
| Total rejected ballots | 227 | 0.37 | – | |||||
| Turnout | 61,476 | 72.36 | – | |||||
| Eligible voters | 84,960 | |||||||
| Liberal gain from Conservative | Swing | +18.73 | ||||||
| Source: Elections Canada[2][3] | ||||||||
| 2011 federal election redistributed results[4] | |||
|---|---|---|---|
| Party | Vote | % | |
| Conservative | 22,949 | 55.37 | |
| Liberal | 7,926 | 19.12 | |
| New Democratic | 6,285 | 15.16 | |
| Green | 4,282 | 10.33 | |
| Others | 8 | 0.02 | |
| Canadian federal by-election, November 26, 2012 | ||||||||
|---|---|---|---|---|---|---|---|---|
| Party | Candidate | Votes | % | ±% | Expenditures | |||
| Conservative | Joan Crockatt | 10,191 | 36.87 | −20.81 | $95,251 | |||
| Liberal | Harvey Locke | 9,033 | 32.68 | +15.15 | $97,025 | |||
| Green | Chris Turner | 7,090 | 25.65 | +15.74 | $100,180 | |||
| New Democratic | Dan Meades | 1,064 | 3.85 | −11.01 | $90,148 | |||
| Independent | Antoni Grochowski | 141 | 0.51 | – | $0 | |||
| Libertarian | Tony Prashad | 121 | 0.44 | – | $255 | |||
| Total valid votes/Expense limit | 27,640 | 100.00 | – | $102,128.86 | ||||
| Total rejected ballots | 92 | |||||||
| Turnout | 27,732 | 29.51 | ||||||
| Eligible voters | 93,984 | |||||||
| Conservative hold | Swing | −35.96 | ||||||
| By-election due to the resignation of Lee Richardson. | ||||||||
| Source: "November 26, 2012 By-elections". Elections Canada. November 27, 2012. Retrieved 27 November 2012. | ||||||||
| Canadian federal election, 2011 | ||||||||
|---|---|---|---|---|---|---|---|---|
| Party | Candidate | Votes | % | ±% | Expenditures | |||
| Conservative | Lee Richardson | 28,401 | 57.68 | +2.08 | $80,989.16 | |||
| Liberal | Jennifer Pollock | 8,631 | 17.53 | -0.37 | $52,961.24 | |||
| New Democratic | Donna Marlis Montgomery | 7,314 | 14.86 | +5.85 | $0.00 | |||
| Green | William Hamilton | 4,889 | 9.93 | -6.64 | $30,754.09 | |||
| Total valid votes/Expense limit | 49,235 | 100.00 | $93,844.88 | |||||
| Total rejected ballots | 261 | 0.53 | – | |||||
| Turnout | 49,496 | 55.41 | – | |||||
| Eligible voters | 89,322 | – | – | |||||
| Conservative hold | Swing | +1.2 | ||||||
| Canadian federal election, 2008 | ||||||||
|---|---|---|---|---|---|---|---|---|
| Party | Candidate | Votes | % | ±% | Expenditures | |||
| Conservative | Lee Richardson | 26,085 | 55.60 | +0.19 | $72,165 | |||
| Liberal | Heesung Kim | 8,402 | 17.90 | -1.29 | $34,321 | |||
| Green | Natalie Odd | 7,778 | 16.57 | +4.89 | $29,509 | |||
| New Democratic | Tyler Kinch | 4,229 | 9.01 | -4.24 | $9,881 | |||
| Independent | Antony Grochowski | 420 | 0.89 | * | n/a | |||
| Total valid votes/Expense limit | 46,914 | 100.00 | $90,677 | |||||
| Total rejected ballots | 228 | 0.48 | -0.02 | |||||
| Turnout | 47,142 | 53.16 | -8.86 | |||||
| Conservative hold | Swing | +0.7 | ||||||
| Canadian federal election, 2006 | ||||||||
|---|---|---|---|---|---|---|---|---|
| Party | Candidate | Votes | % | ±% | Expenditures | |||
| Conservative | Lee Richardson | 30,213 | 55.41 | +4.26 | $82,276 | |||
| Liberal | Heesung Kim | 10,464 | 19.19 | -10.70 | $36,623 | |||
| New Democratic | Brian Pincott | 7,227 | 13.25 | +4.76 | $8,689 | |||
| Green | John Johnson | 6,372 | 11.68 | +176 | $3,431 | |||
| Canadian Action | Trevor Grover | 259 | 0.45 | -0.08 | ||||
| Total valid votes | 54,525 | 100.00 | – | |||||
| Total rejected ballots | 275 | 0.50 | +0.11 | |||||
| Turnout | 54,800 | 62.02 | +4.48 | |||||
| Conservative hold | Swing | +7.5 | ||||||
Calgary South Centre, 2004–2005
| Canadian federal election, 2004 | ||||||||
|---|---|---|---|---|---|---|---|---|
| Party | Candidate | Votes | % | ±% | Expenditures | |||
| Conservative | Lee Richardson | 26,192 | 51.15 | -33.42 | $78,167 | |||
| Liberal | Julia Turnbull | 15,305 | 29.89 | +20.06 | $71,037 | |||
| Green | Phillip K. Liesemer | 5,080 | 9.92 | +7.88 | $1,898 | |||
| New Democratic | Keith Purdy | 4,350 | 8.49 | +5.69 | $4,667 | |||
| Canadian Action | Trevor Grover | 274 | 0.53 | * | n/a | |||
| Total valid votes | 51,201 | 100.00 | - 6,041 | – | ||||
| Total rejected ballots | 202 | 0.39 | +0.02 | |||||
| Turnout | 51,403 | 57.54 | +0.76 | |||||
| Conservative hold | Swing | -23.21 | ||||||
Results based on redistributed results. Conservative Party change is compared to a combination of Progressive Conservative Party and Canadian Alliance totals.
Calgary Centre, 1966–2003
| Canadian federal election, 2000 | ||||||||
|---|---|---|---|---|---|---|---|---|
| Party | Candidate | Votes | % | ±% | Expenditures | |||
| Progressive Conservative | Joe Clark | 26,358 | 46.05 | +27.49 | $67,789 | |||
| Alliance | Eric Lowther | 22,054 | 38.52 | -1.55 | $72,436 | |||
| Liberal | Joanne Levy | 5,630 | 9.83 | -22.80 | $45,827 | |||
| New Democratic | Don LePan | 1,604 | 2.80 | -3.25 | $1,780 | |||
| Green | Michael Alvarez-Toye | 1,170 | 2.04 | +0.25 | $1,062 | |||
| Independent | Beverley Smith | 293 | 0.51 | * | $5,223 | |||
| Marxist–Leninist | Margaret Peggy Askin | 133 | 0.23 | -0.10 | $284 | |||
| Total valid votes | 57,242 | 100.00 | +7,501 | – | ||||
| Total rejected ballots | 213 | 0.37 | -0.04 | |||||
| Turnout | 57,455 | 56.78 | -1.12 | |||||
| Progressive Conservative gain from Reform | Swing | -14.5 | ||||||
| Canadian federal election, 1997 | ||||||||
|---|---|---|---|---|---|---|---|---|
| Party | Candidate | Votes | % | ±% | Expenditures | |||
| Reform | Eric Lowther | 19,936 | 40.07 | -4.69 | $66,910 | |||
| Liberal | Bev Longstaff | 16,231 | 32.63 | +2.17 | $64,840 | |||
| Progressive Conservative | Rob Gray | 9,230 | 18.55 | +3.81 | $59,080 | |||
| New Democratic | Duncan Green | 3,011 | 6.05 | +1.55 | $8,377 | |||
| Green | Andrea Welling | 893 | 1.79 | +0.82 | $173 | |||
| Natural Law | Roni Shapka | 273 | 0.54 | -0.17 | n/a | |||
| Marxist–Leninist | Marg Askin | 167 | 0.33 | +0.15 | $767 | |||
| Total valid votes | 49,741 | 100.00 | -25 | – | ||||
| Total rejected ballots | 206 | 0.41 | – | |||||
| Turnout | 49,947 | 57.90 | – | |||||
| Canadian federal election, 1993 | ||||||||
|---|---|---|---|---|---|---|---|---|
| Party | Candidate | Votes | % | ±% | ||||
| Reform | Jim Silye | 22,276 | 44.76 | +32.33 | ||||
| Liberal | Bob Blair | 15,157 | 30.46 | +18.74 | ||||
| Progressive Conservative | Sean O'Neil | 7,334 | 14.74 | -38.98 | ||||
| New Democratic | Catherine McCreary | 2,237 | 4.50 | -15.52 | ||||
| National | Peter Hoff | 1,743 | 3.50 | * | ||||
| Green | Rebecca Matiowsky | 482 | 0.97 | -0.28 | ||||
| Natural Law | Annie Anderson | 354 | 0.71 | * | ||||
| Canada Party | Bruce Jackman | 93 | 0.19 | * | ||||
| Marxist–Leninist | Margaret Askin | 90 | 0.18 | -0.02 | ||||
| Total | 49,766 | 100.00 | -3,836 | |||||
| Canadian federal election, 1988 | ||||||||
|---|---|---|---|---|---|---|---|---|
| Party | Candidate | Votes | % | ±% | ||||
| Progressive Conservative | Harvie Andre | 28,794 | 53.72 | -12.63 | ||||
| New Democratic | Elaine Husband | 10,731 | 20.02 | +6.34 | ||||
| Reform | John Hamilton | 6,662 | 12.43 | * | ||||
| Liberal | Bob Robinson | 6,280 | 11.72 | -4.13 | ||||
| Green | Norman Conrad | 670 | 1.25 | -0.78 | ||||
| Libertarian | John King | 358 | 0.67 | +0.19 | ||||
| No affiliation | Marg Askin | 107 | 0.20 | * | ||||
| Total | 53,602 | 100.00 | +16,040 | |||||
| Canadian federal election, 1984 | ||||||||
|---|---|---|---|---|---|---|---|---|
| Party | Candidate | Votes | % | ±% | ||||
| Progressive Conservative | Harvie Andre | 24,924 | 66.35 | +8.96 | ||||
| Liberal | Karen Gainer | 5,955 | 15.85 | -14.06 | ||||
| New Democratic | Susan Keeley | 5,138 | 13.68 | +4.45 | ||||
| Green | Glen Staples | 761 | 2.03 | * | ||||
| Confederation of Regions | Jean Ferguson | 604 | 1.61 | * | ||||
| Libertarian | Joseph Kyriakakis | 180 | 0.48 | * | ||||
| Total | 37,562 | 100.00 | +5,136 | |||||
| Canadian federal election, 1980 | ||||||||
|---|---|---|---|---|---|---|---|---|
| Party | Candidate | Votes | % | ±% | ||||
| Progressive Conservative | Harvie Andre | 18,610 | 57.39 | -1.71 | ||||
| Liberal | George Ho Lem | 9,698 | 29.91 | +1.72 | ||||
| New Democratic | David Jones | 2,994 | 9.23 | -1.71 | ||||
| Rhinoceros | Willy Samoil | 766 | 2.36 | * | ||||
| Social Credit | Thomas Erhart | 257 | 0.79 | -0.60 | ||||
| Communist | Casey Swann | 58 | 0.18 | -0.02 | ||||
| Marxist–Leninist | Julie Northrup | 43 | 0.13 | -0.05 | ||||
| Total | 32,426 | 100.00 | - 5,010 | |||||
| Canadian federal election, 1979 | ||||||||
|---|---|---|---|---|---|---|---|---|
| Party | Candidate | Votes | % | ±% | ||||
| Progressive Conservative | Harvie Andre | 22,124 | 59.10 | -4.05 | ||||
| Liberal | Frances Wright | 10,555 | 28.19 | +1.90 | ||||
| New Democratic | Bohdan Harasymiw | 4,095 | 10.94 | +2.79 | ||||
| Social Credit | Thomas Erhart | 522 | 1.39 | -0.32 | ||||
| Communist | Casey Swann | 74 | 0.20 | -0.25 | ||||
| Marxist–Leninist | Julie Northrup | 66 | 0.18 | -0.06 | ||||
| Total | 37,436 | 100.00 | - 265 | |||||
| Canadian federal election, 1974 | ||||||||
|---|---|---|---|---|---|---|---|---|
| Party | Candidate | Votes | % | ±% | ||||
| Progressive Conservative | Harvie Andre | 23,810 | 63.15 | +9.85 | ||||
| Liberal | Frances Wright | 9,912 | 26.29 | -4.53 | ||||
| New Democratic | George McGuire | 3,072 | 8.15 | -4.87 | ||||
| Social Credit | Clifford Willmott | 646 | 1.71 | -0.83 | ||||
| Communist | David Whitefield | 170 | 0.45 | * | ||||
| Marxist–Leninist | Dean Magel | 91 | 0.24 | * | ||||
| Total | 37,701 | 100.00 | ||||||
| Canadian federal election, 1972 | ||||||||
|---|---|---|---|---|---|---|---|---|
| Party | Candidate | Votes | % | ±% | ||||
| Progressive Conservative | Harvie Andre | 22,669 | 53.30 | +6.23 | ||||
| Liberal | Nick Taylor | 13,110 | 30.82 | -15.42 | ||||
| New Democratic | David Jones | 5,538 | 13.02 | +6.33 | ||||
| Social Credit | Clifford Willmott | 1,081 | 2.54 | * | ||||
| No affiliation | Frank Cottingham | 80 | 0.19 | * | ||||
| No affiliation | Colin Constant | 53 | 0.12 | * | ||||
| Total | 42,531 | 100.00 | ||||||
| Canadian federal election, 1968 | ||||||||
|---|---|---|---|---|---|---|---|---|
| Party | Candidate | Votes | % | |||||
| Progressive Conservative | Douglas Harkness | 16,977 | 47.07 | |||||
| Liberal | Nick Taylor | 16,676 | 46.24 | |||||
| New Democratic | Margaret Jackson | 2,413 | 6.69 | |||||
| Total | 36,066 | 100.00 | ||||||
See also
Notes
- ↑ The Reform Party merged with the Canadian Alliance Party on 27 March 2000.
- ↑ Joe Clark did not join with other Progressive Conservatives in the merger with the Canadian Alliance to form the Conservative Party on 8 December 2003.
- ↑ Lee Richardson resigned as MP on 30 May 2012 to accept an appointment as Principal Secretary to the Premier of Alberta. His successor was elected in a by-election on 26 November 2012.
References
- "(Code 48006) Census Profile". 2011 census. Statistics Canada. 2012. Retrieved 2011-03-06.
- Riding history for Calgary Centre (1966 - 2003) from the Library of Parliament
- Riding history for Calgary South Centre (2003 - 2004) from the Library of Parliament
- Riding history for Calgary Centre (2004 - 2008) from the Library of Parliament
- 2011 results from Elections Canada
- Canadian Census, 2001 profile of Calgary Centre
- Canadian Census, 2001 profile of Calgary South Centre
- Expenditures - 2008
- Expenditures - 2004
- Expenditures - 2000
- Expenditures - 1997
- SI/2003-154: Electoral Boundaries Readjustment Act: Proclamation Declaring the Representation Order to be in Force Effective on the First Dissolution of Parliament that Occurs after August 25, 2004, Canada Gazette Part II, Vol. 137, No. 6 Extra, 29 August 2003
- 2003 Representation Order Transposition of Population
- 1 2 Statistics Canada: 2011
- ↑ "October 19, 2015 Election Results — Calgary Centre (Validated results)". Elections Canada. 21 October 2015. Retrieved 4 November 2015.
- ↑ Elections Canada – Preliminary Election Expenses Limits for Candidates Archived 2016-03-04 at the Wayback Machine.
- ↑ Pundits' Guide to Canadian Elections
.png)
.png)