Connecticut's 2nd congressional district
| Connecticut's 2nd congressional district | |
|---|---|
.tif.png) Connecticut's 2nd congressional district – since January 3, 2013. | |
| Current Representative | Joe Courtney (D–Vernon) |
| Area | 2,143 sq mi (5,550 km2) |
| Distribution |
|
| Population (2010) | 714,819 |
| Median income | 54,498 |
| Ethnicity |
|
| Cook PVI | D+3[1] |
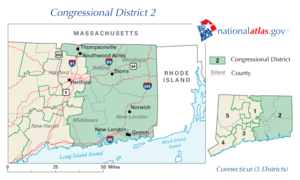
Connecticut's 2nd Congressional District is a congressional district in the U.S. state of Connecticut. Located in the eastern part of the state, the district includes all of New London County, Tolland County, and Windham County, along with parts of Hartford, Middlesex, and New Haven counties.
Principal cities include: Enfield, Norwich, New London, and Groton.
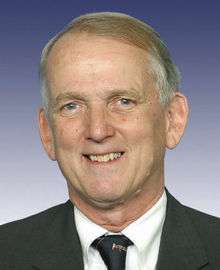
The district is currently represented by Democrat Joe Courtney.
Towns in the District
Hartford County – Enfield, Glastonbury (part), Marlborough, and Suffield.
Middlesex County – Chester, Clinton, Deep River, East Haddam, East Hampton, Essex, Haddam, Killingworth, Old Saybrook, and Westbrook.
New Haven County – Madison.
New London County – Bozrah, Colchester, East Lyme, Franklin, Griswold, Groton, Lebanon, Ledyard, Lisbon, Lyme, Montville, New London, North Stonington, Norwich, Old Lyme, Preston, Salem, Sprague, Stonington, Voluntown, and Waterford.
Tolland County – Andover, Bolton, Columbia, Coventry, Ellington, Hebron, Mansfield, Somers, Stafford, Tolland, Union, Vernon, and Willington.
Windham County – Ashford, Brooklyn, Canterbury, Chaplin, Eastford, Hampton, Killingly, Plainfield, Pomfret, Putnam, Scotland, Sterling, Thompson, Windham, and Woodstock.
Voter Registration
| Voter Registration and Party Enrollment as of October 30, 2012[2] | |||||
|---|---|---|---|---|---|
| Party | Active | Inactive | Total | Percentage | |
| Democratic | 119,995 | 5,501 | 125,496 | 28.94% | |
| Republican | 90,371 | 4,174 | 94,545 | 21.80% | |
| Minor Parties | 580 | 48 | 628 | 0.14% | |
| Unaffiliated | 201,003 | 12,027 | 213,030 | 49.12% | |
| Total | 411,949 | 21,750 | 433,699 | 100% | |
Recent presidential elections
| Election results from presidential races | ||
|---|---|---|
| Year | Office | Results |
| 2000 | President | Gore 55 – 38% |
| 2004 | President | Kerry 54 – 44% |
| 2008 | President | Obama 58 – 40% |
| 2012 | President | Obama 56 – 43% |
| 2016 | President | Clinton 49 – 46% |
Recent elections
1992
| Party | Candidate | Votes | % | ± | |
|---|---|---|---|---|---|
| Democratic | Samuel Gejdenson (incumbent) | 123,291 | 51% | ||
| Republican | Edward W. Munster | 119,416 | 49% | ||
| Democratic hold | Swing | ||||
| Turnout | 242,707 | 100% | |||
1994
| Party | Candidate | Votes | % | ± | |
|---|---|---|---|---|---|
| Democratic | Samuel Gejdenson (incumbent) | 79,188 | 43% | ||
| Republican | Edward W. Munster | 79,167 | 43% | ||
| A Connecticut Party | David Bingham | 27,716 | 14% | ||
| Democratic hold | Swing | ||||
| Turnout | 186,071 | 100% | |||
1996
| Party | Candidate | Votes | % | ± | |
|---|---|---|---|---|---|
| Democratic | Samuel Gejdenson (incumbent) | 115,175 | 52% | ||
| Republican | Edward W. Munster | 100,332 | 45% | ||
| Independence Party of America | Dianne G. Ondusko | 6,477 | 3% | ||
| Natural Law | Thomas E. Hall | 1,263 | 0.4% | ||
| Democratic hold | Swing | ||||
| Turnout | 223,258 | 100% | |||
1998
| Party | Candidate | Votes | % | ± | |
|---|---|---|---|---|---|
| Democratic | Samuel Gejdenson (inc.) | 99,567 | 61% | ||
| Republican | Gary M. Koval | 57,860 | 35% | ||
| Independence Party of America | Dianne G. Ondusko | 5,116 | 3% | ||
| Term Limits | Paul W. Cook | 658 | 0.4% | ||
| Democratic hold | Swing | ||||
| Turnout | 163,201 | 100% | |||
2000
| Party | Candidate | Votes | % | ± | |
|---|---|---|---|---|---|
| Republican | Rob Simmons | 114,380 | 51% | ||
| Democratic | Samuel Gejdenson (incumbent) | 111,520 | 49% | ||
| Republican gain from Democratic | Swing | ||||
| Turnout | 225,900 | 100% | |||
2002
| Party | Candidate | Votes | % | ± | |
|---|---|---|---|---|---|
| Republican | Rob Simmons (incumbent) | 117,434 | 54% | ||
| Democratic | Joe Courtney | 99,674 | 46% | ||
| Republican hold | Swing | ||||
| Turnout | 217,108 | 100% | |||
2004
| Party | Candidate | Votes | % | ± | |
|---|---|---|---|---|---|
| Republican | Rob Simmons (inc.) | 165,558 | 54% | ||
| Democratic | James Sullivan | 139,987 | 46% | - | |
| Republican hold | Swing | ||||
| Turnout | 305,545 | 100% | |||
2006
| Party | Candidate | Votes | % | ± | |
|---|---|---|---|---|---|
| Democratic | Joe Courtney | 121,248 | 50% | ||
| Republican | Rob Simmons (incumbent) | 121,158 | 50% | ||
| Democratic gain from Republican | Swing | ||||
| Turnout | 242,413 | 100% | |||
2008
| Party | Candidate | Votes | % | ± | |
|---|---|---|---|---|---|
| Democratic | Joe Courtney (incumbent) | 212,411 | 66% | ||
| Republican | Sean Sullivan | 104,469 | 32% | ||
| Green | G. Scott Deshefy | 6,287 | 2% | ||
| Democratic hold | Swing | ||||
| Turnout | 323,167 | 100% | |||
2010
| Party | Candidate | Votes | % | ± | |
|---|---|---|---|---|---|
| Democratic | Joe Courtney (incumbent) | 147,748 | 60% | ||
| Republican | Janet Peckinpaugh | 95,671 | 39% | ||
| Green | G. Scott Deshefy | 3,344 | 1% | ||
| Democratic hold | Swing | ||||
| Turnout | 246,763 | 100% | |||
2012
| Party | Candidate | Votes | % | ± | |
|---|---|---|---|---|---|
| Democratic | Joe Courtney (incumbent) | 204,691 | 68% | ||
| Republican | Paul Formica | 87,828 | 29% | ||
| Green | Colin Bennett | 3,269 | 2% | ||
| Libertarian | Daniel Reale | 3,504 | 1% | ||
| Democratic hold | Swing | ||||
| Turnout | 299,652 | 100% | |||
2014
| Party | Candidate | Votes | % | ± | |
|---|---|---|---|---|---|
| Democratic | Joe Courtney (incumbent) | 141,948 | 62% | ||
| Republican | Lori Hopkins-Cavanagh | 80,837 | 36% | ||
| Green | William Clyde | 2,602 | 1% | ||
| Libertarian | Daniel Reale | 2,549 | 1% | ||
| Democratic hold | Swing | ||||
| Turnout | 227,936 | 100% | |||
2016
| Party | Candidate | Votes | % | ± | |
|---|---|---|---|---|---|
| Democratic | Joe Courtney (incumbent) | 207,584 | 63% | ||
| Republican | Daria Novak | 111,587 | 34% | ||
| Green | Jonathan Pelto | 5,332 | 2% | ||
| Libertarian | Daniel Reale | 5,016 | 1% | ||
| Democratic hold | Swing | ||||
| Turnout | 329,519 | 100% | |||
List of representatives
| Representative | Party | Years of Service | Hometown | Note |
|---|---|---|---|---|
| District organized from Connecticut's At-large congressional district in 1837 | ||||
 | Democratic | March 4, 1837 – March 3, 1839 | Essex | Lost Re-election |
| Whig | March 4, 1839 – June, 1840 | Middletown | Resigned/Appointed Associate Justice of CT Supreme Court |
| Vacant | June, 1840 – December 7, 1840 | |||
| Whig | December 7, 1840 – March 3, 1843 | New Haven | Retired |
| Democratic | March 4, 1843 – March 3, 1845 | Chatham | Lost Re-election |
 | Whig | March 4, 1845 – March 3, 1849 | Middletown | Retired |
 | Free Soil | March 4, 1849 – March 3, 1851 | Meriden | Lost Re-election |
| Democratic | March 4, 1851 – March 3, 1855 | New Haven | Retired |
 | American | March 4, 1855 – March 3, 1857 | New Haven | Lost Re-election |
 | Democratic | March 4, 1857 – March 3, 1859 | Haddam | Retired |
| Republican | March 4, 1859 – March 3, 1861 | New Haven | Retired |
 | Democratic | March 4, 1861 – March 3, 1865 | New Haven | Retired |
 | Republican | March 4, 1865 – March 3, 1867 | Middletown | Retired |
 | Democratic | March 4, 1867 – March 3, 1869 | Waterbury | Retired |
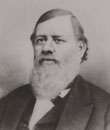
.jpg) | Republican | March 4, 1869 – March 3, 1875 | Waterbury | Lost Re-election |
 | Democratic | March 4, 1875 – March 3, 1883 | Essex | Retired |
.jpg) | Democratic | March 4, 1883 – March 3, 1887 | New Haven | Retired |
.jpg) | Democratic | March 4, 1887 – March 3, 1889 | Seymour | Retired |
.jpg) | Democratic | March 4, 1889 – March 3, 1893 | Chester | Retired |
.jpg) | Democratic | March 4, 1893 – March 3, 1895 | New Haven | Lost Re-election |
.jpg) | Republican | March 4, 1895 – March 3, 1911 | New Haven | Retired |
 | Democratic | March 4, 1911 – March 3, 1913 | Meriden | Re-districted to 3rd District |
 | Democratic | March 4, 1913 – March 3, 1915 | New London | Lost Re-election |
 | Republican | March 4, 1915 – March 3, 1933 | New London | Lost Re-election |
.jpg) | Republican | March 4, 1933 – January 3, 1937 | Coventry | Lost Re-election |
| Democratic | January 3, 1937 – January 3, 1939 | Norwich | Lost Re-election |
| Republican | January 3, 1939 – January 3, 1941 | Old Lyme | Lost Re-election |
| Democratic | January 3, 1941 – January 3, 1943 | Norwich | Lost Re-election |
| Republican | January 3, 1943 – January 3, 1945 | Norwich | Lost Re-election |
 | Democratic | January 3, 1945 – January 3, 1947 | Sprague | Lost Re-election |
.jpg) | Republican | January 3, 1947 – January 3, 1949 | Pomfret | Lost Re-election |
| Democratic | January 3, 1949 – January 3, 1951 | Sprague | Lost Re-election |
| Republican | January 3, 1951 – January 3, 1959 | Pomfret | Lost Re-election |
.jpg) | Democratic | January 3, 1959 – January 3, 1961 | Essex | Appointed Under Secretary of State |
| Republican | January 3, 1961 – January 3, 1963 | Pomfret | Unsuccessful candidate for US Senate |
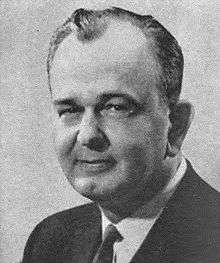 | Democratic | January 3, 1963 – May 1, 1970 | Putnam | Died |
| Vacant | May 1, 1970 – November 3, 1970 | |||
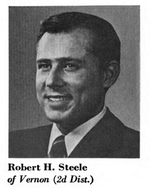 | Republican | November 3, 1970 – January 3, 1975 | Vernon | Unsuccessful candidate for Governor |
 | Democratic | January 3, 1975 – January 3, 1981 | Norwich | Elected to US Senate |
 | Democratic | January 3, 1981 – January 3, 2001 | Bozrah | Lost Re-election |
 | Republican | January 3, 2001 – January 3, 2007 | Stonington | Lost Re-election |
.jpg) | Democratic | January 3, 2007 – | Vernon | Incumbent |
Living former Members
As of June 2016, there are four living former members of the U.S. House of Representatives from Connecticut's 2nd congressional district.
| Representative | Term in office | Date of birth (and age) |
|---|---|---|
| Robert H. Steele | 1970–1975 | November 3, 1938 |
| Chris Dodd | 1975–1981 | May 27, 1944 |
| Sam Gejdenson | 1981–2001 | May 20, 1948 |
| Rob Simmons | 2001–2007 | February 11, 1943 |
References
- ↑ "Partisan Voting Index – Districts of the 115th Congress" (PDF). The Cook Political Report. April 7, 2017. Retrieved April 7, 2017.
- ↑ "Registration and Party Enrollment Statistics as of October 30, 2012" (PDF). Connecticut Secretary of State. Archived from the original (PDF) on 2006-09-23. Retrieved 2012-10-30.
- ↑ "Archived copy" (PDF). Archived from the original (PDF) on 2006-12-16. Retrieved 2006-12-04. 2006 Official Election Results
- Martis, Kenneth C. (1989). The Historical Atlas of Political Parties in the United States Congress. New York: Macmillan Publishing Company.
- Martis, Kenneth C. (1982). The Historical Atlas of United States Congressional Districts. New York: Macmillan Publishing Company.
- Congressional Biographical Directory of the United States 1774–present
Coordinates: 41°39′13″N 72°12′23″W / 41.65361°N 72.20639°W