City of Cardiff Council election, 2012
|
| |||||||||||||||||||||||||
| |||||||||||||||||||||||||
All 75 seats to City of Cardiff Council 38 seats needed for a majority | |||||||||||||||||||||||||
|---|---|---|---|---|---|---|---|---|---|---|---|---|---|---|---|---|---|---|---|---|---|---|---|---|---|
| |||||||||||||||||||||||||
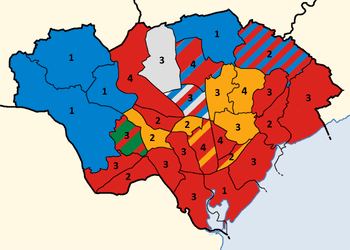 Map showing the results of the 2012 City of Cardiff Council Elections. | |||||||||||||||||||||||||
| |||||||||||||||||||||||||
The 2012 Cardiff Council election took place on Thursday 3 May 2012 to elect members of Cardiff Council in Wales.[1] This was the same day as other United Kingdom local elections.[2] It was preceded by the 2008 election and followed by the 2017 election
Election result
Labour gained control of the council from the Liberal Democrats and Plaid Cymru, after gaining 32 seats.[3] The Liberal Democrat leader of the council, Rodney Berman, lost his seat by 51 votes after two recounts,[4] bringing Labour's gains to 33. Sixty-one-year-old Labour councillor Heather Joyce, nicknamed 'Supernan' by the local newspaper, became the new council leader.[5]
| Party | Seats | Gains | Losses | Net gain/loss | Seats % | Votes % | Votes | +/− | |
|---|---|---|---|---|---|---|---|---|---|
| Labour | 46 | 32 | 0 | +32 | 61.3 | 37.3 | 36,148 | +10.5 | |
| Liberal Democrat | 16 | 0 | 19 | -19 | 21.3 | 16.4 | 15,878 | -8.3 | |
| Conservative | 7 | 1 | 11 | -10 | 9.3 | 18.5 | 17,886 | -8.0 | |
| Independent | 4 | 1 | 0 | 0 | 4.0 | 4.7 | 4,581 | -0.3 | |
| Plaid Cymru | 2 | 0 | 4 | -4 | 2.7 | 12.8 | 12,397 | -0.6 | |
| Green | 0 | 6.5 | 6,307 | +4.3 | |||||
| Heath/Birchgrove Ind. | 0 | 1.5 | 1,500 | N/A | |||||
| Llandaff North Ind. | 0 | 0.6 | 607 | N/A | |||||
| TUSC | 0 | 0.5 | 456 | N/A | |||||
| UKIP | 0 | 0.5 | 445 | +0.1 | |||||
| Communist | 0 | 0.3 | 335 | +/-0 | |||||
| Christian | 0 | 0.2 | 205 | N/A | |||||
| Socialist Labour | 0 | 0.1 | 106 | N/A | |||||
| Socialist Alternative | - | - | - | - | - | - | - | -0.6 | |
| Left List | - | - | - | - | - | - | - | -0.1 | |
Ward results
Adamstown (two seats)
| Party | Candidate | Votes | % | ± | |
|---|---|---|---|---|---|
| Liberal Democrat | Nigel Howells* | 731 | |||
| Labour | Manzoor Ahmed | 719 | |||
| Liberal Democrat | John Dixon* | 683 | |||
| Labour | Sian Thomas | 681 | |||
| Green | Matthew Townsend | 117 | |||
| Plaid Cymru | Phillip Evans | 97 | |||
| TUSC | Dave Bartlett | 68 | |||
| Plaid Cymru | Dean Minto | 67 | |||
| Conservative | Joel Jackson | 53 | |||
| Communist | Fran Rawlings | 50 | |||
| Conservative | Robert Price | 37 | |||
| Turnout | 28.7 | +1.5 | |||
| Liberal Democrat hold | Swing | ||||
| Labour gain from Liberal Democrat | Swing | ||||
Butetown (one seat)
| Party | Candidate | Votes | % | ± | |
|---|---|---|---|---|---|
| Labour | Ali Ahmed | 777 | 37.3 | +3.1 | |
| Liberal Democrat | Delme Greening* | 673 | 32.3 | -8.5 | |
| Plaid Cymru | Liz Musa | 386 | 18.5 | +18.5 | |
| Conservative | Laura Pike | 126 | 6.0 | -10.9 | |
| Green | Sam Roads | 72 | 3.5 | ||
| UKIP | Simon Zeigler | 49 | 2.4 | ||
| Majority | 104 | 5.0 | |||
| Turnout | 30.3 | +1.4 | |||
| Labour gain from Liberal Democrat | Swing | ||||
Caerau (two seats)
| Party | Candidate | Votes | % | ± | |
|---|---|---|---|---|---|
| Labour | Peter Bradbury | 1,390 | |||
| Labour | Elaine Simmons | 1,290 | |||
| Liberal Democrat | Jacqui Gasson* | 417 | |||
| Liberal Democrat | Roger Burley* | 318 | |||
| Plaid Cymru | Stuart Cosslet | 240 | |||
| Conservative | Clive Williams | 198 | |||
| Conservative | Alec Burns | 186 | |||
| Plaid Cymru | Ruksana Begum | 160 | |||
| Green | Anne Greagsby | 140 | |||
| Turnout | 29.3 | -2.3 | |||
| Labour gain from Liberal Democrat | Swing | ||||
| Labour gain from Liberal Democrat | Swing | ||||
Canton (three seats)
| Party | Candidate | Votes | % | ± | |
|---|---|---|---|---|---|
| Labour | Ramesh Patel* | 2,230 | |||
| Labour | Cerys Furlong* | 2,130 | |||
| Labour | Richard Cook* | 2,128 | |||
| Plaid Cymru | Sian Powell | 910 | |||
| Plaid Cymru | L. Williams | 837 | |||
| Plaid Cymru | Ben Foday | 824 | |||
| Green | David Griffiths | 730 | |||
| Green | N. Pugh | 564 | |||
| Conservative | R. Cadman | 505 | |||
| Green | S. Griggs | 503 | |||
| Conservative | Pamela Richards | 468 | |||
| Conservative | H. Bayoomi | 426 | |||
| Liberal Democrat | Matthew Dixon | 118 | |||
| Socialist Labour | S. Parsons | 106 | |||
| Liberal Democrat | M. Ogrady | 98 | |||
| TUSC | R. Saunders | 90 | |||
| Liberal Democrat | S. Hyde | 84 | |||
| Turnout | 41.3 | -2.9 | |||
| Labour hold | Swing | ||||
| Labour hold | Swing | ||||
| Labour hold | Swing | ||||
Cathays (four seats)
| Party | Candidate | Votes | % | ± | |
|---|---|---|---|---|---|
| Labour | Sarah Merry | 877 | |||
| Labour | S. Knight | 873 | |||
| Liberal Democrat | Elizabeth Clark* | 810 | |||
| Labour | Chris Weaver | 807 | |||
| Liberal Democrat | M. Smith | 794 | |||
| Labour | M. Wong | 786 | |||
| Liberal Democrat | Jonathan Aylwin* | 775 | |||
| Liberal Democrat | A. Ali | 702 | |||
| Green | J. Parker | 633 | |||
| Green | S. Coates | 593 | |||
| Green | S. Howson | 526 | |||
| Green | S. Power | 469 | |||
| Plaid Cymru | Emyr Gruffydd | 266 | |||
| Plaid Cymru | C. Jones | 244 | |||
| Plaid Cymru | G. Page | 235 | |||
| Conservative | J. Ankers | 228 | |||
| Conservative | O. Wannell | 214 | |||
| Conservative | R. Hunter | 207 | |||
| Plaid Cymru | A. Pearce | 204 | |||
| Conservative | G. Carroll | 189 | |||
| Independent | A. Norris | 135 | |||
| Turnout | 17.6 | +1.2 | |||
| Labour gain from Liberal Democrat | Swing | ||||
| Labour gain from Liberal Democrat | Swing | ||||
| Liberal Democrat hold | Swing | ||||
| Labour gain from Liberal Democrat | Swing | ||||
Creigiau & St. Fagans (one seat)
| Party | Candidate | Votes | % | ± | |
|---|---|---|---|---|---|
| Conservative | Graham Thomas | 648 | 38.2 | +15.1 | |
| Plaid Cymru | Wynford Owen | 623 | 36.7 | -25.4 | |
| Labour | S. Evans | 321 | 18.9 | +9.1 | |
| Liberal Democrat | H. Borrow | 53 | 3.1 | -1.8 | |
| Green | T. Jones | 52 | 3.1 | ||
| Majority | 25 | ||||
| Turnout | 1913 | 42.9 | -6.3 | ||
| Conservative gain from Plaid Cymru | Swing | ||||
Cyncoed (three seats)
| Party | Candidate | Votes | % | ± | |
|---|---|---|---|---|---|
| Liberal Democrat | Kate Lloyd* | 1,809 | |||
| Liberal Democrat | Margaret Jones* | 1,727 | |||
| Liberal Democrat | David Rees* | 1,698 | |||
| Conservative | R. England | 1,093 | |||
| Conservative | M. Flynn | 1,006 | |||
| Conservative | Lee Gonzalez | 966 | |||
| Labour | S. Ali | 683 | |||
| Labour | R. Sherrington | 661 | |||
| Labour | S. Masseri | 614 | |||
| Green | G. Allen-Manson | 217 | |||
| Plaid Cymru | G. Williams | 177 | |||
| Plaid Cymru | J. Edwards | 168 | |||
| Turnout | 43.3 | -6.4 | |||
| Liberal Democrat hold | Swing | ||||
| Liberal Democrat hold | Swing | ||||
| Liberal Democrat hold | Swing | ||||
Ely (three seats)
| Party | Candidate | Votes | % | ± | |
|---|---|---|---|---|---|
| Labour | Irene Goddard* | 1,597 | |||
| Labour | James Murphy | 1,481 | |||
| Labour | Russell Goodway* | 1,468 | |||
| Plaid Cymru | L. Sullivam | 791 | |||
| Plaid Cymru | N. Branson | 776 | |||
| Plaid Cymru | P. Sullivan | 767 | |||
| Conservative | R. Jones-Pritchard | 237 | |||
| Conservative | J. Noon | 236 | |||
| Conservative | V. Ward | 230 | |||
| Green | D. Horle | 115 | |||
| Liberal Democrat | Sian Cliff | 95 | |||
| Liberal Democrat | T. Donne | 83 | |||
| Liberal Democrat | J. Richards | 75 | |||
| Turnout | 2719 | 28.7 | +0.2 | ||
| Labour hold | Swing | ||||
| Labour hold | Swing | ||||
| Labour hold | Swing | ||||
Fairwater (three seats)
| Party | Candidate | Votes | % | ± | |
|---|---|---|---|---|---|
| Plaid Cymru | Neil McEvoy* | 1,643 | |||
| Plaid Cymru | Lisa Ford | 1,562 | |||
| Labour | Paul Mitchell | 1,412 | |||
| Labour | J. Monks | 1,384 | |||
| Plaid Cymru | Keith Parry* | 1,341 | |||
| Labour | R. Williams | 1,315 | |||
| Conservative | S. Driscoll | 539 | |||
| Conservative | J. Roach | 419 | |||
| Conservative | D. Morrison | 389 | |||
| Green | B. Pearce | 176 | |||
| Liberal Democrat | P. Randerson | 68 | |||
| Liberal Democrat | J. Scullion | 64 | |||
| Liberal Democrat | M. Ahmed | 62 | |||
| Turnout | 3824 | 40.8 | +5.1 | ||
| Plaid Cymru hold | Swing | ||||
| Plaid Cymru hold | Swing | ||||
| Labour gain from Plaid Cymru | Swing | ||||
Gabalfa (two seats)
| Party | Candidate | Votes | % | ± | |
|---|---|---|---|---|---|
| Liberal Democrat | Ed Bridges* | 936 | |||
| Liberal Democrat | G. Holden | 891 | |||
| Labour | C. Jones | 500 | |||
| Labour | G. Crocker | 497 | |||
| Plaid Cymru | Brian Coman | 125 | |||
| Conservative | J. Breeze | 115 | |||
| Green | E. Mason | 106 | |||
| Conservative | P. Miles | 91 | |||
| Plaid Cymru | S. Evans | 86 | |||
| TUSC | D. Hamblin | 51 | |||
| Turnout | 25.6 | -0.1 | |||
| Liberal Democrat hold | Swing | ||||
| Liberal Democrat hold | Swing | ||||
Grangetown (three seats)
| Party | Candidate | Votes | % | ± | |
|---|---|---|---|---|---|
| Labour | Ashley Govier | 1,812 | |||
| Labour | Chris Lomax | 1,709 | |||
| Labour | Lynda Thorne | 1,704 | |||
| Plaid Cymru | Abdul Sattar | 1,511 | |||
| Plaid Cymru | Mohammed Awan | 1,467 | |||
| Plaid Cymru | Luke Nicholas | 1,391 | |||
| Liberal Democrat | Francesca Montemaggi* | 505 | |||
| Liberal Democrat | David Morgan* | 501 | |||
| Liberal Democrat | Paul Harding | 489 | |||
| Conservative | Vincent Bailey | 308 | |||
| Conservative | Axel Kaehne | 266 | |||
| Conservative | Karys Oram | 251 | |||
| Green | Sian Best | 215 | |||
| Green | Ken Barker | 205 | |||
| Christian | Clive Bate | 84 | |||
| Communist | Rick Newnham | 77 | |||
| Turnout | 4266 | 36.8 | -0.2 | ||
| Labour gain from Liberal Democrat | Swing | ||||
| Labour gain from Liberal Democrat | Swing | ||||
| Labour gain from Liberal Democrat | Swing | ||||
Heath (three seats)
Fenella Bowden, elected as a Liberal Democrat in 2012, stood as an Independent.
| Party | Candidate | Votes | % | ± | |
|---|---|---|---|---|---|
| Independent | Fenella Bowden* | 1,500 | |||
| Labour | Graham Hinchey | 1,416 | |||
| Conservative | Lyn Hudson* | 1,277 | |||
| Conservative | Ron Page* | 1,242 | |||
| Labour | Marie John | 1,240 | |||
| Independent | Steve Bowden | 1,151 | |||
| Labour | Ewan Moor | 1,116 | |||
| Conservative | Mark Branton | 1,101 | |||
| Independent | Katrin O'Malley | 888 | |||
| Liberal Democrat | Jim James | 349 | |||
| Plaid Cymru | Mali Rowlands | 325 | |||
| Independent | Robert Smith | 262 | |||
| Green | Tom Coates | 253 | |||
| Liberal Democrat | Steven Price | 175 | |||
| Liberal Democrat | Ashley Wood | 140 | |||
| Turnout | 44.1 | -7.8 | |||
| Independent gain from Liberal Democrat | Swing | ||||
| Labour gain from Conservative | Swing | ||||
| Conservative hold | Swing | ||||
Lisvane (one seat)
| Party | Candidate | Votes | % | ± | |
|---|---|---|---|---|---|
| Conservative | David Walker* | 999 | 73.1 | -6.8 | |
| Labour | Joshua Lovell | 231 | 16.9 | +4.9 | |
| Liberal Democrat | Myfanwy Price | 61 | 4.5 | -3.6 | |
| Plaid Cymru | Anthony Couch | 49 | 3.6 | +3.6 | |
| Green | Rosa Thomas | 27 | 2.0 | +2.0 | |
| Majority | |||||
| Turnout | 1,369 | 47.7 | |||
| Conservative hold | Swing | ||||
Llandaff (two seats)
| Party | Candidate | Votes | % | ± | |
|---|---|---|---|---|---|
| Liberal Democrat | Kirsty Davies* | 1,121 | |||
| Liberal Democrat | Gareth Aubrey* | 1,081 | |||
| Labour | Catherine Antippas | 989 | |||
| Labour | Simon Jones | 932 | |||
| Conservative | Jason Griffin | 809 | |||
| Conservative | Oliver Owen | 791 | |||
| Plaid Cymru | Gillian Green | 335 | |||
| Plaid Cymru | Heulwen James | 312 | |||
| Green | Benedict Frude | 132 | |||
| Independent | Steve West | 114 | |||
| Christ Proc | Derek Thomson | 64 | |||
| Turnout | 3,355 | 45.7 | |||
| Liberal Democrat hold | Swing | ||||
| Liberal Democrat hold | Swing | ||||
Llandaff North (two seats)
| Party | Candidate | Votes | % | ± | |
|---|---|---|---|---|---|
| Labour | Siobhan Corria | 1,244 | |||
| Labour | Dilwar Ali | 1,156 | |||
| Independent | David Cogan | 607 | |||
| Independent | Megan Price | 507 | |||
| Liberal Democrat | Ann Rowland-James* | 375 | |||
| Liberal Democrat | Jacqui Hooper* | 356 | |||
| Conservative | Joe Trigg | 154 | |||
| Plaid Cymru | Wyn Jones | 141 | |||
| Green | Tim Ware | 101 | |||
| Turnout | 2,325 | 40.6 | -1.6 | ||
| Labour gain from Liberal Democrat | Swing | ||||
| Labour gain from Liberal Democrat | Swing | ||||
Llanishen (four seats)
| Party | Candidate | Votes | % | ± | |
|---|---|---|---|---|---|
| Labour | Garry Hunt | 2,394 | |||
| Labour | Phil Bale | 2,362 | |||
| Labour | Julia Magill | 2,302 | |||
| Conservative | Andrew Graham | 2,033 | |||
| Labour | James Brinning | 1.992 | |||
| Conservative | Richard Foley* | 1,980 | |||
| Conservative | Chris O'Brien | 1,948 | |||
| Conservative | Richard John | 1,782 | |||
| Plaid Cymru | Gwynfor Davies | 418 | |||
| UKIP | Lawrence Gwynn | 396 | |||
| Plaid Cymru | Lona Roberts | 384 | |||
| Green | Linda Atkins | 313 | |||
| Plaid Cymru | Emma Caresimo | 308 | |||
| Liberal Democrat | Molly Hughes | 286 | |||
| Liberal Democrat | Patricia Rees | 268 | |||
| Plaid Cymru | Vito Caresimo | 246 | |||
| Liberal Democrat | Ann Hyde | 222 | |||
| Liberal Democrat | Judith Ahmed | 215 | |||
| Turnout | 4,972 | 37.1 | -9.1 | ||
| Labour gain from Conservative | Swing | ||||
| Labour gain from Conservative | Swing | ||||
| Labour gain from Conservative | Swing | ||||
| Conservative hold | Swing | ||||
Llanrumney (three seats)
| Party | Candidate | Votes | % | ± | |
|---|---|---|---|---|---|
| Labour | Heather Joyce* | 1,671 | |||
| Labour | Keith Jones | 1,653 | |||
| Labour | Derrick Morgan* | 1,643 | |||
| Conservative | John Driscoll | 353 | |||
| Conservative | Wes Jones | 318 | |||
| Conservative | Dai Lowsy | 291 | |||
| Plaid Cymru | Colin Lewis | 269 | |||
| Plaid Cymru | Baindu Foday | 186 | |||
| Plaid Cymru | David Reeves | 134 | |||
| Green | Bethan Lloyd | 94 | |||
| Liberal Democrat | Malcolm Evans | 69 | |||
| Liberal Democrat | Matthew Batten | 66 | |||
| Liberal Democrat | Michael Rees | 62 | |||
| Turnout | 2,278 | 28.3 | -4.7 | ||
| Labour hold | Swing | ||||
| Labour hold | Swing | ||||
| Labour hold | Swing | ||||
Pentwyn (four seats)
| Party | Candidate | Votes | % | ± | |
|---|---|---|---|---|---|
| Liberal Democrat | Judith Woodman* | 1,633 | |||
| Liberal Democrat | Joseph Carter* | 1,563 | |||
| Liberal Democrat | Keith Hyde* | 1,557 | |||
| Liberal Democrat | Paul Chaundy* | 1,546 | |||
| Labour | David Haines | 1,406 | |||
| Labour | Michael Imperato | 1,267 | |||
| Labour | Bernie Bowen-Thomson | 1,262 | |||
| Labour | Jasminc Chowdhury | 1,249 | |||
| Conservative | Kathleen Fisher | 256 | |||
| Conservative | Michael Prothero | 254 | |||
| Conservative | Susan Williams | 232 | |||
| Conservative | Lizzie Lumley | 217 | |||
| Plaid Cymru | Gwenno George | 173 | |||
| Green | Megan David | 167 | |||
| Plaid Cymru | Elin Llyr | 150 | |||
| Plaid Cymru | Meic Peterson | 146 | |||
| Plaid Cymru | John Roberts | 134 | |||
| Communist | Steve Williams | 91 | |||
| Turnout | 3,336 | 31.0 | -3.5 | ||
| Liberal Democrat hold | Swing | ||||
| Liberal Democrat hold | Swing | ||||
| Liberal Democrat hold | Swing | ||||
| Liberal Democrat hold | Swing | ||||
Pentyrch (one seat)
| Party | Candidate | Votes | % | ± | |
|---|---|---|---|---|---|
| Conservative | Craig Williams | 772 | 54.4 | +20.0 | |
| Labour | Christine Priday | 413 | 29.1 | -1.7 | |
| Plaid Cymru | Penri Williams | 171 | 12.1 | -7.7 | |
| Green | Lucy Hiscox | 40 | 2.8 | +2.8 | |
| Liberal Democrat | Adam Evans | 22 | 1.6 | -6.3 | |
| Majority | 359 | 25.3 | +21.7 | ||
| Turnout | 1,427 | 52.3 | +1.5 | ||
| Conservative hold | Swing | ||||
Penylan (three seats)
| Party | Candidate | Votes | % | ± | |
|---|---|---|---|---|---|
| Liberal Democrat | Tricia Burfoot* | 2,173 | |||
| Liberal Democrat | Bill Kelloway* | 2,131 | |||
| Liberal Democrat | Joe Boyle | 2,101 | |||
| Labour | Michael Fogg | 1,176 | |||
| Labour | Reece Emmitt | 1,158 | |||
| Labour | Akbar Mookhtiar | 929 | |||
| Conservative | Peter Hudson | 446 | |||
| Conservative | Roland Hemingway | 440 | |||
| Conservative | Michael Wallbank | 379 | |||
| Green | Kathryn Brock | 377 | |||
| Plaid Cymru | Kelvin Evans | 349 | |||
| Plaid Cymru | Ann Miles | 268 | |||
| Plaid Cymru | Malachy McEvoy | 237 | |||
| Turnout | 4,036 | 39.7 | -5.1 | ||
| Liberal Democrat hold | Swing | ||||
| Liberal Democrat hold | Swing | ||||
| Liberal Democrat hold | Swing | ||||
Plasnewydd (four seats)
| Party | Candidate | Votes | % | ± | |
|---|---|---|---|---|---|
| Labour | Susan Lent | 1,535 | |||
| Labour | Daniel De'ath | 1,438 | |||
| Labour | Mary McGarry | 1,436 | |||
| Labour | Mohammad Javed | 1,413 | |||
| Liberal Democrat | Rodney Berman* | 1,362 | |||
| Liberal Democrat | Geraldine Nichols | 1,314 | |||
| Liberal Democrat | Richard Jerrett* | 1,297 | |||
| Liberal Democrat | Elgan Morgan* | 1,236 | |||
| Green | Anthony Matthews | 535 | |||
| Plaid Cymru | Mohammed Ali | 505 | |||
| Plaid Cymru | Mohammed Hannan | 434 | |||
| Plaid Cymru | Ned Parish | 344 | |||
| Plaid Cymru | Ian Mullis | 338 | |||
| Conservative | Enid Harries | 232 | |||
| Conservative | Hannah Moscrop | 193 | |||
| Conservative | Aled Jones-Pritchard | 174 | |||
| Conservative | Marc Gonzalez | 171 | |||
| Turnout | 3,528 | 25.6 | -1.6 | ||
| Labour gain from Liberal Democrat | Swing | ||||
| Labour gain from Liberal Democrat | Swing | ||||
| Labour gain from Liberal Democrat | Swing | ||||
| Labour gain from Liberal Democrat | Swing | ||||
Pontprennau and Old St. Mellons (two seats)
| Party | Candidate | Votes | % | ± | |
|---|---|---|---|---|---|
| Labour | Georgina Phillips | 1,326 | |||
| Conservative | Dianne Rees* | 1,004 | |||
| Labour | Mark Watkins | 993 | |||
| Conservative | Jane Rogers* | 940 | |||
| Liberal Democrat | Edward Wilson | 141 | |||
| Plaid Cymru | Mauro Caresimo | 130 | |||
| Green | Matthew Lovett | 107 | |||
| Liberal Democrat | Charles Woodman | 79 | |||
| Plaid Cymru | Ceri Tegwyn | 73 | |||
| Turnout | 2,407 | 34.1 | -6.2 | ||
| Labour gain from Conservative | Swing | ||||
| Conservative hold | Swing | ||||
Radyr (one seat)
| Party | Candidate | Votes | % | ± | |
|---|---|---|---|---|---|
| Conservative | Roderick McKerlich* | 1,215 | 53.3 | -6.9 | |
| Labour | Moray Grant | 738 | 32.4 | +12.7 | |
| Plaid Cymru | Ian Hughes | 164 | 7.2 | -2.4 | |
| Liberal Democrat | Laura Pearcy | 95 | 4.2 | -6.3 | |
| Green | Zabelle Aslanyan | 68 | 3.0 | +3.0 | |
| Majority | 477 | 20.9 | -30.6 | ||
| Turnout | 2,285 | 45.8 | -2.7 | ||
| Conservative hold | Swing | ||||
Rhiwbina (three seats)
| Party | Candidate | Votes | % | ± | |
|---|---|---|---|---|---|
| Independent | Jayne Cowan* | 3,808 | |||
| Independent | Adrian Robson* | 3,680 | |||
| Independent | Eleanor Sanders* | 3,420 | |||
| Conservative | Adam Johns | 643 | |||
| Labour | Andrew Newton | 631 | |||
| Labour | Geraint Denison | 611 | |||
| Conservative | Leslie Hopkins | 560 | |||
| Labour | Steven Cushen | 521 | |||
| Conservative | John Lancaster | 507 | |||
| Plaid Cymru | Christopher Davies | 225 | |||
| Green | Daniel Bearpark | 140 | |||
| Liberal Democrat | Peter Borrow | 78 | |||
| Liberal Democrat | Emma-Jayne Sandrey | 67 | |||
| Liberal Democrat | Charlotte Lightman | 52 | |||
| Turnout | 4,986 | 54.1 | -8.3 | ||
| Independent hold | Swing | ||||
| Independent hold | Swing | ||||
| Independent hold | Swing | ||||
Riverside (three seats)
| Party | Candidate | Votes | % | ± | |
|---|---|---|---|---|---|
| Labour | Iona Gordon | 1,731 | |||
| Labour | Cecilia Love | 1,555 | |||
| Labour | Phil Hawkins | 1,431 | |||
| Plaid Cymru | Mohammed Islam* | 1,153 | |||
| Plaid Cymru | Jaswant Singh* | 944 | |||
| Plaid Cymru | Haf Roberts | 940 | |||
| Green | Ceri Hughes | 294 | |||
| Conservative | Jennifer Lay | 286 | |||
| Conservative | Michael Bryan | 276 | |||
| Green | Yvan Maurel | 272 | |||
| Conservative | Gaener Davies | 263 | |||
| Green | Jan Tucker | 189 | |||
| Liberal Democrat | Gwilym Owen | 142 | |||
| Liberal Democrat | Jeremy Townsend | 129 | |||
| Liberal Democrat | Eleri Randerson | 122 | |||
| TUSC | Garmon Gruffudd | 99 | |||
| Turnout | 3,286 | 35.2 | -4.7 | ||
| Labour hold | Swing | ||||
| Labour gain from Plaid Cymru | Swing | ||||
| Labour gain from Plaid Cymru | Swing | ||||
Rumney (two seats)
Duncan Macdonald had been elected as a Conservative in 2008.
| Party | Candidate | Votes | % | ± | |
|---|---|---|---|---|---|
| Labour | Jacqueline Parry | 1,095 | |||
| Labour | Robert Derbyshire | 1,087 | |||
| Conservative | John Ireland* | 625 | |||
| Conservative | Phillip James | 473 | |||
| Independent | Duncan MacDonald* | 262 | |||
| Plaid Cymru | Ian Jones | 78 | |||
| Plaid Cymru | Chad Rickard | 63 | |||
| Christ Proc | Dave Pritchard | 57 | |||
| Green | Jack Price | 53 | |||
| Liberal Democrat | Anabella Rees | 48 | |||
| TUSC | Andrew Wilkes | 43 | |||
| Liberal Democrat | Elizabeth Woodman | 37 | |||
| Turnout | 1,964 | 29.9 | -4.6 | ||
| Labour gain from Conservative | Swing | ||||
| Labour gain from Conservative | Swing | ||||
Splott (three seats)
| Party | Candidate | Votes | % | ± | |
|---|---|---|---|---|---|
| Labour | Luke Holland | 1,686 | |||
| Labour | Huw Thomas | 1,624 | |||
| Labour | Gretta Marshall | 1,432 | |||
| Liberal Democrat | Gavin Cox* | 1,055 | |||
| Liberal Democrat | Bablin Molik | 815 | |||
| Liberal Democrat | Anna White | 775 | |||
| Plaid Cymru | Jebun Choudhury | 250 | |||
| Plaid Cymru | Ioan Bellin | 197 | |||
| Plaid Cymru | Patrick Daley | 167 | |||
| Green | Kelda Rimington | 157 | |||
| Conservative | Margaret Evans | 151 | |||
| Conservative | Janine Jones-Pritchard | 137 | |||
| Conservative | Kyle Smith | 130 | |||
| Communist | Robert Griffiths | 117 | |||
| TUSC | James Connolly | 105 | |||
| Turnout | 2,930 | 31.1 | -7.4 | ||
| Labour hold | Swing | ||||
| Labour hold | Swing | ||||
| Labour gain from Liberal Democrat | Swing | ||||
Trowbridge (three seats)
| Party | Candidate | Votes | % | ± | |
|---|---|---|---|---|---|
| Labour | Ralph Cook | 1,619 | |||
| Labour | Monica Walsh | 1,535 | |||
| Labour | Michael Costas-Michael | 1,380 | |||
| Liberal Democrat | Emma Woodman | 388 | |||
| Conservative | Michelle Michaelis | 372 | |||
| Conservative | Pamela Cunningham | 367 | |||
| Conservative | Wayne Cashin | 358 | |||
| Plaid Cymru | Leanne Lennox | 292 | |||
| Liberal Democrat | Jacqui Sullivan | 255 | |||
| Liberal Democrat | Ian Walton | 244 | |||
| Plaid Cymru | Leigh Canham | 188 | |||
| Plaid Cymru | Joshua Parry | 178 | |||
| Green | Piers Leveroni | 98 | |||
| Turnout | 3,444 | 22.0 | -8.5 | ||
| Labour hold | Swing | ||||
| Labour hold | Swing | ||||
| Labour gain from Liberal Democrat | Swing | ||||
Whitchurch and Tongwynlais (four seats)
| Party | Candidate | Votes | % | ± | |
|---|---|---|---|---|---|
| Labour | Jonathan Evans | 2,529 | |||
| Labour | Chris Davis | 2,454 | |||
| Labour | Benjamin Thomas | 2,354 | |||
| Labour | David Groves | 2,290 | |||
| Conservative | Linda Morgan* | 2,206 | |||
| Conservative | Timothy Davies* | 2,144 | |||
| Conservative | Brian Griffiths* | 2,080 | |||
| Conservative | Michael Jones-Pritchard* | 2,080 | |||
| Plaid Cymru | John Rowlands | 641 | |||
| Plaid Cymru | Heulwen Jones | 623 | |||
| Plaid Cymru | Ceri Morgan | 600 | |||
| Plaid Cymru | Dewi Owen | 588 | |||
| Green | Paul Atkins | 495 | |||
| Liberal Democrat | Joyce Lentern | 265 | |||
| Liberal Democrat | Matthew Harries | 233 | |||
| Liberal Democrat | Ruth Abbott | 226 | |||
| Liberal Democrat | Mark Rees | 183 | |||
| Turnout | 5,518 | 42.5 | -10.6 | ||
| Labour gain from Conservative | Swing | ||||
| Labour gain from Conservative | Swing | ||||
| Labour gain from Conservative | Swing | ||||
| Labour gain from Conservative | Swing | ||||
By-elections 2012-17
Splott by-election (2013)
A by-election was caused by the resignation of Labour councillor Luke Holland with plans to move to London following accusations of non-attendance at council meetings.[9] The by-election was held on 5 December 2013.
| Party | Candidate | Votes | % | ± | |
|---|---|---|---|---|---|
| Labour | Edward Stubbs | 706 | |||
| Liberal Democrat | Jamie Matthews | 604 | |||
| UKIP | George Morris | 209 | |||
| Independent | Elys John | 94 | |||
| Conservative | Daniel Mason | 86 | |||
| TUSC | Katrine Williams | 80 | |||
| Turnout | 1,779 | ||||
| Labour hold | Swing | ||||
Riverside by-election (2013)
The by-election was caused by the resignation of Labour councillor Phil Hawkins for personal reasons.[9] It was held on 5 December 2013.
| Party | Candidate | Votes | % | ± | |
|---|---|---|---|---|---|
| Labour | Darren Williams | 1,120 | |||
| Plaid Cymru | Elizabeth Gould | 773 | |||
| Conservative | Aled Crow | 107 | |||
| UKIP | Simon Zeigler | 97 | |||
| TUSC | Christopher Beer | 70 | |||
| Liberal Democrat | Sian Donne | 58 | |||
| Turnout | 2,225 | ||||
| Labour hold | Swing | ||||
Llandaff North (2014)
A by-election was held on 2 October 2014
| Party | Candidate | Votes | % | ± | |
|---|---|---|---|---|---|
| Labour | Susan White | 898 | |||
| Independent | David Coggins-Cogan | 419 | |||
| UKIP | Simon Zeigler | 204 | |||
| Conservative | Peter Hudson | 136 | |||
| Liberal Democrat | Ann Rowland-James | 134 | |||
| Turnout | 1,791 | ||||
| Labour hold | Swing | ||||
Canton (2014)
A by-election was held on 21 February 2014 following the resignation of Cerys Furlong in December.[10]
| Party | Candidate | Votes | % | ± | |
|---|---|---|---|---|---|
| Labour | Susan Elsmore | 1,201 | |||
| Plaid Cymru | Elin Tudur | 972 | |||
| Conservative | Pamela Richards | 381 | |||
| Green | David Griffiths | 148 | |||
| TUSC | Steffan Bateman | 101 | |||
| Liberal Democrat | Matthew Hemsley | 80 | |||
| Turnout | 2,883 | ||||
| Labour hold | Swing | ||||
Pentyrch (2015)
The by-election was caused by the resignation of Craig Williams, following his election as MP for Cardiff North.
| Party | Candidate | Votes | % | ± | |
|---|---|---|---|---|---|
| Conservative | Gavin Hill-John | 561 | |||
| Plaid Cymru | Hywel Wigley | 543 | |||
| Labour | Paul Fisher | 234 | |||
| Independent | Munawar Mughal | 24 | |||
| Green | Ruth Osner | 22 | |||
| Liberal Democrat | Cadan ap Tomos | 10 | |||
| Majority | 18 | ||||
| Turnout | 1,394 | ||||
| Conservative hold | Swing | ||||
Riverside (2015)
Caused by the resignation of Labour councillor Cecilia Love. On 7 October 2015 the seat was held for Labour by their candidate, Caro Wild.[11]
| Party | Candidate | Votes | % | ± | |
|---|---|---|---|---|---|
| Labour | Caro Wild | 1,071 | |||
| Plaid Cymru | Ruksana Begum | 780 | |||
| Conservative | Sean Driscoll | 155 | |||
| UKIP | Gareth Bennett | 110 | |||
| Green | Hannah Pudner | 109 | |||
| Liberal Democrat | Gwilym Owen | 85 | |||
| TUSC | Steffan Bateman | 21 | |||
| Turnout | 2,331 | ||||
| Labour hold | Swing | ||||
Plasnewydd (2016)
Caused by the death of Labour councillor Mohammed Javed. The by-election, on 20 September 2016, was taken by Liberal Democrat candidate Robin Rea with 48% of the vote.[12]
| Party | Candidate | Votes | % | ± | |
|---|---|---|---|---|---|
| Liberal Democrat | Robin Rea | 1,258 | |||
| Labour | Peter Wong | 910 | |||
| Plaid Cymru | Glenn Page | 177 | |||
| Conservative | Munawar Mughal | 115 | |||
| Green | Michael Cope | 93 | |||
| UKIP | Lawrence Gwynn | 62 | |||
| Turnout | 2,615 | ||||
| Liberal Democrat gain from Labour | Swing | ||||
Grangetown (2016)
Caused by the death of Labour councillor Chris Lomax. The by-election, on 3 November 2016, was taken by Plaid Cymru candidate Tariq Awan.[13]
| Party | Candidate | Votes | % | ± | |
|---|---|---|---|---|---|
| Plaid Cymru | Tariq Awan | 1,163 | |||
| Labour | Maliika Kaaba | 1,049 | |||
| Conservative | Michael Bryan | 287 | |||
| UKIP | Richard Lewis | 141 | |||
| Liberal Democrat | Asghar Ali | 127 | |||
| Turnout | 2,767 | ||||
| Plaid Cymru gain from Labour | Swing | ||||
Defections 2012-17
- In April 2013 Gabalfa Councillor Gareth Holden resigned from The Lib Dems to sit as an independent[14] and later joined Plaid Cymru.[15]
- In June 2015 Rhiwbina Councillors Jayne Cowan and Adrian Robson both joined the Conservatives. [16]
- In January 2016 Trowbridge Councillor Ralph Cook left Labour [17] to sit as an independent. In 2017 he contested his seat for the Lib Dems.
- In May 2016 Llanrumny Councillor Derrick Morgan left the Labour group and sat as an independent.[18]
- In August 2016 Splott Councillor Gretta Marshell resigned from Labour to sit as an independent and later joined Plaid Cymru [19]
- In early 2017 Adamsdown Councillor Manzoor Ahmed was deselected by Labour[20] and joined the Lib Dems.[21]
Vacant seats by 2017
Three seats were vacant by the end of the term caused by the resignation of Margaret Jones (Lib Dem) in Cyncoed[22], the resignation of Susan White (Labour) in Llandaff North[23] and the death of a Derrick Morgan[24] (elected as Labour, then sitting as an independent) in Llanrumny, all of happened within six months of the 2017 election, so no by-elections were held.
References
- ↑ "2012 Local Council Election". Cardiff Council. Retrieved 12 September 2017.
- ↑ "Cardiff Council Election Results 1995-2012" (PDF). The Elections Cente, Plymouth University. Retrieved 23 June 2016.
- ↑ "Cardiff council elections: The story in each ward". Your Cardiff (WalesOnline). 3 May 2012. Archived from the original on 8 May 2012. Retrieved 2012-05-05.
- ↑ "Cardiff council's Rodney Berman toppled in cull of leaders". BBC News. 4 May 2012. Retrieved 2012-05-05.
- ↑ Shipton, Martin (5 May 2012). "Supernan Leads Labour Victory". South Wales Echo. p. 1,4.
- ↑ Law, Peter (5 May 2012). "Triumph before hard reality". South Wales Echo. p. 7.
- ↑ Teale, Andrew. "Local Election Results 2012: Cardiff". Retrieved 2016-11-15.
- ↑ "Election results". Cardiff Council. Retrieved 2018-05-02.
- 1 2 "Two Cardiff Labour councillors resign their seats". Wales Online. 21 October 2013. Retrieved 2018-05-04.
- ↑ Alison Sanders (21 February 2014). "Labour wins Canton by-election with 1,201 votes". Wales Online. Retrieved 2018-05-07.
- ↑ Professor Roger Scully (8 October 2015). "Yesterday's local by-election". Cardiff University Blogs - Elections in Wales - Etholiadau yng Nghymru. Retrieved 2018-05-02.
- ↑ "Labour has lost a by-election in Cardiff's Roath ward amid a surge in Lib Dem votes". Wales Online. 21 September 2016. Retrieved 2018-05-02.
- ↑ "Labour loses second Cardiff council seat in two months". The Cardiffian. School of Journalism, Media and Cultural Studies. 8 November 2016. Retrieved 2018-05-02.
- ↑ https://www.walesonline.co.uk/news/local-news/lib-dem-councillor-leaves-party-2497677
- ↑ https://www.walesonline.co.uk/news/politics/labour-loses-second-cardiff-council-12125231
- ↑ https://www.walesonline.co.uk/news/wales-news/husband-wife-councillor-team-jayne-9412101
- ↑ https://www.walesonline.co.uk/news/politics/former-cardiff-council-deputy-leader-10729269
- ↑ https://www.walesonline.co.uk/news/politics/third-labour-councillor-cardiff-quit-11378692
- ↑ https://www.walesonline.co.uk/news/politics/cardiff-councillor-defected-labour-saying-11695584
- ↑ https://www.walesonline.co.uk/news/wales-news/another-cardiff-councillor-resigns-after-12253048
- ↑ https://www.walesonline.co.uk/news/local-news/councillor-who-quit-labour-claiming-12567699
- ↑ https://www.walesonline.co.uk/news/wales-news/cardiff-councillor-quits-immediate-effect-12378002
- ↑ https://www.walesonline.co.uk/news/politics/sickened-labour-councillor-quits-alleging-12247705
- ↑ https://www.walesonline.co.uk/news/local-news/tributes-been-paid-former-lord-12491039
External links
- 2012 Local Council Election, Cardiff Council website
| City of Cardiff Council | |
|---|---|
| Vale of Glamorgan Council | |
| South Glamorgan County Council |
|