| Barcelona |
|---|
Congress of Deputies
Electoral Constituency |
.png) Location of Barcelona within Spain |
| Province |
Barcelona |
|---|
| Autonomous community |
Catalonia |
|---|
| Population |
5,523,922 (2016) |
|---|
| Electorate |
4,131,319 (2016) |
|---|
| Major settlements |
Barcelona, Hospitalet de Llobregat, Badalona, Terrassa, Sabadell, Mataró, Santa Coloma de Gramanet |
|---|
| Current constituency |
|---|
| Created |
1977 |
|---|
| Seats |
33 (1977–1989)
32 (1989–1996)
31 (1996–) |
|---|
| Member(s) |
|
|---|
Barcelona is one of the 52 constituencies (Spanish: circunscripciones) represented in the Congress of Deputies, the lower chamber of the Spanish parliament, the Cortes Generales. The constituency currently elects 31 deputies. Its boundaries correspond to those of the Spanish province of Barcelona. The electoral system uses the D'Hondt method and a closed-list proportional representation, with a minimum threshold of 3 percent.
Electoral system
The constituency was created as per the Political Reform Act 1977 and was first contested in the 1977 general election. The Act provided for the provinces of Spain to be established as multi-member districts in the Congress of Deputies,[1] with this regulation being maintained under the Spanish Constitution of 1978. Additionally, the Constitution requires for any modification of the provincial limits to be approved under an organic law, needing an absolute majority in the Cortes Generales.[2]
Voting is on the basis of universal suffrage, which comprises all nationals over eighteen and in full enjoyment of their political rights. The only exception was in 1977, when this was limited to nationals over twenty-one and in full enjoyment of their political and civil rights. Amendments to the electoral law in 2011 required for Spaniards abroad to apply for voting before being permitted to vote, a system known as "begged" or expat vote (Spanish: Voto rogado).[3] 348 seats are elected using the D'Hondt method and a closed list proportional representation, with a threshold of 3 percent of valid votes—which includes blank ballots—being applied in each constituency. Parties not reaching the threshold are not taken into consideration for seat distribution. Additionally, the use of the D'Hondt method may result in an effective threshold over three percent, depending on the district magnitude.[4] Each provincial constituency is entitled to an initial minimum of two seats, with the remaining 248 allocated among the constituencies in proportion to their populations. Ceuta and Melilla are allocated the two remaining seats, which are elected using plurality voting.[2][5][6][7]
The electoral law provides that parties, federations, coalitions and groupings of electors are allowed to present lists of candidates. However, groupings of electors are required to secure the signature of at least 1 percent of the electors registered in the constituency for which they are seeking election—0.1 percent and, at least, the signature of 500 electors, until 1985—. Also since 2011, parties, federations or coalitions who have not obtained a mandate in either House of Parliament at the preceding election are required to secure the signature of at least 0.1 percent of the electors registered in the constituency for which they are seeking election. Electors are barred from signing for more than one list of candidates. Concurrently, parties and federations intending to enter in coalition to take part jointly at an election are required to inform the relevant Electoral Commission within ten days of the election being called.[5][7]
Elections
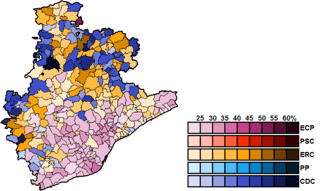
2016 general election
Summary of the 26 June 2016 Congress of Deputies election results in Barcelona
| Parties and coalitions |
Popular vote |
Seats |
| Votes |
% |
±pp |
Total |
+/− |
|
In Common We Can–Let's Win the Change (ECP) |
694,315 | 26.26 | –0.62 |
9 | ±0 |
|
Socialists' Party of Catalonia (PSC–PSOE) |
444,812 | 16.82 | +0.57 |
5 | ±0 |
|
Republican Left–Catalonia Yes (ERC–CatSí) |
438,126 | 16.57 | +2.08 |
5 | ±0 |
|
People's Party (PP) |
357,759 | 13.53 | +2.27 |
4 | ±0 |
|
Democratic Convergence of Catalonia (CDC)1 |
323,824 | 12.25 | –1.00 |
4 | ±0 |
|
Citizens–Party of the Citizenry (C's) |
305,075 | 11.54 | –2.00 |
4 | ±0 |
|
|
Animalist Party Against Mistreatment of Animals (PACMA) |
47,660 | 1.80 | +0.60 |
0 | ±0 |
|
Zero Cuts–Green Group (Recortes Cero–GV) |
8,006 | 0.30 | –0.08 |
0 | ±0 |
|
Communist Party of the Catalan People (PCPC) |
3,275 | 0.12 | –0.07 |
0 | ±0 |
| Blank ballots |
21,081 | 0.80 | +0.17 |
|
|
| Total |
2,643,933 | |
31 | ±0 |
|
| Valid votes |
2,643,933 | 99.40 | –0.08 |
|
| Invalid votes |
15,885 | 0.60 | +0.08 |
| Votes cast / turnout |
2,659,818 | 64.38 | –5.22 |
| Abstentions |
1,471,501 | 35.62 | +5.22 |
| Registered voters |
4,131,319 | |
|
| Sources[8] |
|
|
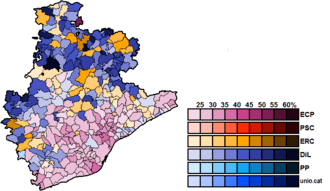
2015 general election
Summary of the 20 December 2015 Congress of Deputies election results in Barcelona
| Parties and coalitions |
Popular vote |
Seats |
| Votes |
% |
±pp |
Total |
+/− |
|
In Common We Can (En Comú)1 |
768,235 | 26.88 | +17.81 |
9 | +6 |
|
Socialists' Party of Catalonia (PSC–PSOE) |
464,588 | 16.25 | –11.55 |
5 | –5 |
|
Republican Left of Catalonia–Catalonia Yes (ERC–CatSí) |
414,163 | 14.49 | +8.01 |
5 | +3 |
|
Citizens–Party of the Citizenry (C's) |
387,061 | 13.54 | New |
4 | +4 |
|
Democracy and Freedom (DiL)2 |
378,723 | 13.25 | –13.90 |
4 | –5 |
|
People's Party (PP) |
321,980 | 11.26 | –9.67 |
4 | –3 |
|
|
Democratic Union of Catalonia (unio.cat) |
48,326 | 1.69 | New |
0 | ±0 |
|
Animalist Party Against Mistreatment of Animals (PACMA) |
34,394 | 1.20 | +0.49 |
0 | ±0 |
|
Zero Cuts–Green Group (Recortes Cero–GV) |
10,730 | 0.38 | New |
0 | ±0 |
|
Union, Progress and Democracy (UPyD) |
6,595 | 0.23 | –1.04 |
0 | ±0 |
|
Communist Party of the Catalan People (PCPC) |
5,493 | 0.19 | New |
0 | ±0 |
| Blank ballots |
18,119 | 0.63 | –1.16 |
|
|
| Total |
2,858,407 | |
31 | ±0 |
|
| Valid votes |
2,858,407 | 99.48 | +0.97 |
|
| Invalid votes |
14,976 | 0.52 | –0.97 |
| Votes cast / turnout |
2,873,383 | 69.60 | +3.69 |
| Abstentions |
1,254,798 | 30.40 | –3.69 |
| Registered voters |
4,128,181 | |
|
| Sources[9] |
|
|
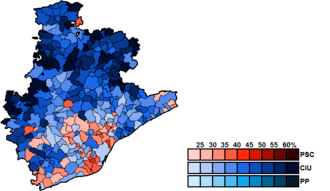
2011 general election
Summary of the 20 November 2011 Congress of Deputies election results in Barcelona
| Parties and coalitions |
Popular vote |
Seats |
| Votes |
% |
±pp |
Total |
+/− |
|
Socialists' Party of Catalonia (PSC–PSOE) |
727,220 | 27.80 | –18.97 |
10 | –6 |
|
Convergence and Union (CiU) |
710,178 | 27.15 | +7.57 |
9 | +3 |
|
People's Party (PP) |
547,376 | 20.93 | +4.12 |
7 | +1 |
|
Initiative for Catalonia Greens–United and Alternative Left: EP (ICV–EUiA) |
237,327 | 9.07 | +3.51 |
3 | +2 |
|
Republican Left of Catalonia–Rally–Catalonia Yes (ERC–RI.cat) |
169,601 | 6.48 | –0.11 |
2 | ±0 |
|
|
Platform for Catalonia (PxC) |
53,142 | 2.03 | New |
0 | ±0 |
|
Blank Seats (EB) |
40,054 | 1.53 | +1.40 |
0 | ±0 |
|
Union, Progress and Democracy (UPyD) |
33,111 | 1.27 | +1.08 |
0 | ±0 |
|
Animalist Party Against Mistreatment of Animals (PACMA) |
18,638 | 0.71 | +0.42 |
0 | ±0 |
|
Pirates of Catalonia (Pirata.cat) |
17,393 | 0.67 | New |
0 | ±0 |
|
Anti-capitalists (Anticapitalistas) |
11,346 | 0.43 | New |
0 | ±0 |
|
Communist Unification of Spain (UCE) |
3,341 | 0.13 | New |
0 | ±0 |
| Blank ballots |
46,738 | 1.79 | +0.27 |
|
|
| Total |
2,615,465 | |
31 | ±0 |
|
| Valid votes |
2,615,465 | 98.51 | –1.03 |
|
| Invalid votes |
39,462 | 1.49 | +1.03 |
| Votes cast / turnout |
2,654,927 | 65.91 | –4.74 |
| Abstentions |
1,373,190 | 34.09 | +4.74 |
| Registered voters |
4,028,117 | |
|
| Sources[10] |
2008 general election
Summary of the 9 March 2008 Congress of Deputies election results in Barcelona
| Parties and coalitions |
Popular vote |
Seats |
| Votes |
% |
±pp |
Total |
+/− |
|
Socialists' Party of Catalonia (PSC–PSOE) |
1,309,171 | 46.77 | +5.11 |
16 | +2 |
|
Convergence and Union (CiU) |
547,993 | 19.58 | +0.30 |
6 | ±0 |
|
People's Party (PP) |
470,677 | 16.81 | +0.86 |
6 | +1 |
|
Republican Left of Catalonia (esquerra) |
184,558 | 6.59 | –7.50 |
2 | –2 |
|
Initiative for Catalonia Greens–United and Alternative Left (ICV–EUiA) |
155,674 | 5.56 | –0.95 |
1 | –1 |
|
|
Citizens–Party of the Citizenry (C's) |
24,220 | 0.87 | New |
0 | ±0 |
|
The Greens–The Ecologist Alternative (EV–AE) |
12,561 | 0.45 | –0.43 |
0 | ±0 |
|
Anti-Bullfighting Party Against Mistreatment of Animals (PACMA) |
8,153 | 0.29 | New |
0 | ±0 |
|
The Greens (EV–LV) |
7,324 | 0.26 | New |
0 | ±0 |
|
Union, Progress and Democracy (UPyD) |
5,179 | 0.19 | New |
0 | ±0 |
|
Catalan Republican Party (RC) |
4,250 | 0.15 | New |
0 | ±0 |
|
Unsubmissive Seats–Alternative of Discontented Democrats (Ei–ADD) |
3,733 | 0.13 | +0.07 |
0 | ±0 |
|
Communist Party of the Catalan People (PCPC) |
3,100 | 0.11 | +0.06 |
0 | ±0 |
|
Pensioners in Action Party (PDLPEA) |
3,050 | 0.11 | New |
0 | ±0 |
|
Citizens for Blank Votes (CenB) |
2,851 | 0.10 | +0.01 |
0 | ±0 |
|
For a Fairer World (PUM+J) |
1,525 | 0.05 | New |
0 | ±0 |
|
Internationalist Socialist Workers' Party (POSI) |
1,486 | 0.05 | New |
0 | ±0 |
|
Republican Left–Left Republican Party (IR–PRE) |
1,387 | 0.05 | –0.01 |
0 | ±0 |
|
National Democracy (DN) |
1,326 | 0.05 | +0.02 |
0 | ±0 |
|
Family and Life Party (PFiV) |
1,279 | 0.05 | ±0.00 |
0 | ±0 |
|
Spanish Phalanx of the CNSO (FE–JONS) |
1,102 | 0.04 | ±0.00 |
0 | ±0 |
|
Engine and Sports Alternative (AMD) |
1,079 | 0.04 | New |
0 | ±0 |
|
Party for Catalonia (PxCat) |
823 | 0.03 | New |
0 | ±0 |
|
Humanist Party (PH) |
627 | 0.02 | –0.02 |
0 | ±0 |
|
Civil Liberties Party (PLCI) |
594 | 0.02 | New |
0 | ±0 |
|
Spain 2000 (E–2000) |
527 | 0.02 | New |
0 | ±0 |
|
Authentic Phalanx (FA) |
524 | 0.02 | New |
0 | ±0 |
|
Spanish Alternative (AES) |
509 | 0.02 | New |
0 | ±0 |
|
National Alliance (AN) |
359 | 0.01 | New |
0 | ±0 |
|
Internationalist Struggle (LI (LIT–CI)) |
321 | 0.01 | ±0.00 |
0 | ±0 |
|
Carlist Party of Catalonia (PCdeC) |
301 | 0.01 | New |
0 | ±0 |
|
Internationalist Solidarity and Self-Management (SAIn) |
293 | 0.01 | New |
0 | ±0 |
| Blank ballots |
42,672 | 1.52 | +0.60 |
|
|
| Total |
2,799,228 | |
31 | ±0 |
|
| Valid votes |
2,799,228 | 99.54 | –0.18 |
|
| Invalid votes |
12,834 | 0.46 | +0.18 |
| Votes cast / turnout |
2,812,062 | 70.65 | –5.52 |
| Abstentions |
1,168,119 | 29.35 | +5.52 |
| Registered voters |
3,980,181 | |
|
| Sources[11] |
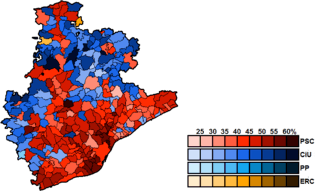
2004 general election
Summary of the 14 March 2004 Congress of Deputies election results in Barcelona
| Parties and coalitions |
Popular vote |
Seats |
| Votes |
% |
±pp |
Total |
+/− |
|
Socialists' Party of Catalonia (PSC–PSOE) |
1,268,028 | 41.66 | +6.15 |
14 | +2 |
|
Convergence and Union (CiU) |
586,854 | 19.28 | –7.02 |
6 | –3 |
|
People's Party (PP) |
485,504 | 15.95 | –7.58 |
5 | –3 |
|
Republican Left of Catalonia (ERC) |
428,986 | 14.09 | +8.97 |
4 | +3 |
|
Initiative for Catalonia Greens–United and Alternative Left (ICV–EUiA)1 |
198,116 | 6.51 | –0.04 |
2 | +1 |
|
|
The Greens–The Ecologist Alternative (EV–AE) |
26,739 | 0.88 | New |
0 | ±0 |
|
Internationalist Socialist Workers' Party (POSI) |
2,691 | 0.09 | –0.05 |
0 | ±0 |
|
Citizens for Blank Votes (CenB) |
2,686 | 0.09 | New |
0 | ±0 |
|
Democratic and Social Centre (CDS) |
2,113 | 0.07 | +0.01 |
0 | ±0 |
|
Republican Left–Left Republican Party (IR–PRE) |
1,889 | 0.06 | +0.01 |
0 | ±0 |
|
Unsubmissive Seats–Alternative of Discontented Democrats (Ei–ADD) |
1,812 | 0.06 | New |
0 | ±0 |
|
Family and Life Party (PFiV) |
1,586 | 0.05 | New |
0 | ±0 |
|
Communist Party of the Catalan People (PCPC) |
1,534 | 0.05 | New |
0 | ±0 |
|
Spanish Phalanx of the CNSO (FE–JONS)2 |
1,359 | 0.04 | +0.01 |
0 | ±0 |
|
Humanist Party (PH) |
1,141 | 0.04 | –0.01 |
0 | ±0 |
|
National Democracy (DN) |
1,029 | 0.03 | New |
0 | ±0 |
|
The Phalanx (FE) |
999 | 0.03 | ±0.00 |
0 | ±0 |
|
Spanish Democratic Party (PADE) |
591 | 0.02 | ±0.00 |
0 | ±0 |
|
Caló Nationalist Party (PNCA) |
566 | 0.02 | –0.01 |
0 | ±0 |
|
Republican Social Movement (MSR) |
522 | 0.02 | New |
0 | ±0 |
|
European Nation State (N) |
410 | 0.01 | –0.02 |
0 | ±0 |
|
Spanish Democratic Front (FDE) |
377 | 0.01 | New |
0 | ±0 |
|
Internationalist Struggle (LI (LIT–CI)) |
324 | 0.01 | –0.01 |
0 | ±0 |
| Blank ballots |
27,979 | 0.92 | –0.50 |
|
|
| Total |
3,043,835 | |
31 | ±0 |
|
| Valid votes |
3,043,835 | 99.72 | +0.14 |
|
| Invalid votes |
8,475 | 0.28 | –0.14 |
| Votes cast / turnout |
3,052,310 | 76.17 | +12.39 |
| Abstentions |
955,020 | 23.83 | –12.39 |
| Registered voters |
4,007,330 | |
|
| Sources[12] |
|
|
2000 general election
Summary of the 12 March 2000 Congress of Deputies election results in Barcelona
| Parties and coalitions |
Popular vote |
Seats |
| Votes |
% |
±pp |
Total |
+/− |
|
Socialists' Party of Catalonia (PSC–PSOE) |
909,601 | 35.51 | –4.81 |
12 | –1 |
|
Convergence and Union (CiU) |
673,558 | 26.30 | –1.13 |
9 | ±0 |
|
People's Party (PP) |
602,777 | 23.53 | +5.16 |
8 | +2 |
|
Republican Left of Catalonia (ERC) |
131,114 | 5.12 | +1.29 |
1 | ±0 |
|
Initiative for Catalonia–Greens (IC–V) |
103,778 | 4.05 | –4.69 |
1 | –1 |
|
|
United and Alternative Left (EUiA) |
64,111 | 2.50 | New |
0 | ±0 |
|
The Greens–Green Group (EV–GV) |
14,922 | 0.58 | New |
0 | ±0 |
|
The Greens–Green Alternative (EV–AV) |
7,685 | 0.30 | New |
0 | ±0 |
|
Internationalist Socialist Workers' Party (POSI) |
3,501 | 0.14 | New |
0 | ±0 |
|
Liberal Independent Group (GIL) |
2,547 | 0.10 | New |
0 | ±0 |
|
Catalan State (EC) |
1,538 | 0.06 | New |
0 | ±0 |
|
Centrist Union–Democratic and Social Centre (UC–CDS) |
1,450 | 0.06 | –0.01 |
0 | ±0 |
|
Humanist Party (PH) |
1,333 | 0.05 | +0.01 |
0 | ±0 |
|
Republican Left–Left Republican Party (IR–PRE) |
1,275 | 0.05 | New |
0 | ±0 |
|
Natural Law Party (PLN) |
1,048 | 0.04 | New |
0 | ±0 |
|
Caló Nationalist Party (PNCA) |
861 | 0.03 | New |
0 | ±0 |
|
Independent Spanish Phalanx–Phalanx 2000 (FEI–FE 2000) |
826 | 0.03 | New |
0 | ±0 |
|
The Phalanx (FE) |
826 | 0.03 | New |
0 | ±0 |
|
European Nation State (N) |
710 | 0.03 | +0.01 |
0 | ±0 |
|
Spain 2000 Platform (ES2000) |
613 | 0.02 | New |
0 | ±0 |
|
Internationalist Struggle (LI (LIT–CI)) |
518 | 0.02 | New |
0 | ±0 |
|
Spanish Democratic Party (PADE) |
430 | 0.02 | New |
0 | ±0 |
| Blank ballots |
36,486 | 1.42 | +0.74 |
|
|
| Total |
2,561,508 | |
31 | ±0 |
|
| Valid votes |
2,561,508 | 99.58 | –0.13 |
|
| Invalid votes |
10,920 | 0.42 | +0.13 |
| Votes cast / turnout |
2,572,428 | 63.78 | –12.87 |
| Abstentions |
1,460,589 | 36.22 | +12.87 |
| Registered voters |
4,033,017 | |
|
| Sources[13] |
1996 general election
Summary of the 3 March 1996 Congress of Deputies election results in Barcelona
| Parties and coalitions |
Popular vote |
Seats |
| Votes |
% |
±pp |
Total |
+/− |
|
Socialists' Party of Catalonia (PSC–PSOE) |
1,203,339 | 40.32 | +3.95 |
13 | +1 |
|
Convergence and Union (CiU) |
818,832 | 27.43 | –2.62 |
9 | –1 |
|
People's Party (PP) |
548,323 | 18.37 | +1.42 |
6 | ±0 |
|
Initiative for Catalonia–The Greens (IC–EV) |
260,881 | 8.74 | +0.27 |
2 | –1 |
|
Republican Left of Catalonia (ERC) |
114,195 | 3.83 | –0.50 |
1 | ±0 |
|
|
The European Greens–Ecologist Alternative of Catalonia (EVE–AEC) |
6,241 | 0.21 | –0.86 |
0 | ±0 |
|
Ecologist Party of Catalonia (PEC) |
3,980 | 0.13 | –0.16 |
0 | ±0 |
|
Centrist Union (UC) |
2,221 | 0.07 | –0.72 |
0 | ±0 |
|
Workers' Revolutionary Party (PRT)1 |
1,936 | 0.06 | –0.18 |
0 | ±0 |
|
Authentic Spanish Phalanx (FEA) |
1,296 | 0.04 | +0.01 |
0 | ±0 |
|
Humanist Party (PH) |
1,060 | 0.04 | ±0.00 |
0 | ±0 |
|
Citizen Independent Platform of Catalonia (PICC) |
895 | 0.03 | New |
0 | ±0 |
|
Republican Coalition (CR)2 |
655 | 0.02 | –0.01 |
0 | ±0 |
|
European Nation State (N) |
495 | 0.02 | New |
0 | ±0 |
|
Revolutionary Workers' Party (POR) |
0 | 0.00 | –0.09 |
0 | ±0 |
| Blank ballots |
20,365 | 0.68 | +0.04 |
|
|
| Total |
2,984,714 | |
31 | –1 |
|
| Valid votes |
2,984,714 | 99.71 | +0.07 |
|
| Invalid votes |
8,710 | 0.29 | –0.07 |
| Votes cast / turnout |
2,993,424 | 76.65 | +0.90 |
| Abstentions |
911,831 | 23.35 | –0.90 |
| Registered voters |
3,905,255 | |
|
| Sources[14] |
|
|
1993 general election
Summary of the 6 June 1993 Congress of Deputies election results in Barcelona
| Parties and coalitions |
Popular vote |
Seats |
| Votes |
% |
±pp |
Total |
+/− |
|
Socialists' Party of Catalonia (PSC–PSOE) |
1,030,053 | 36.37 | –0.61 |
12 | –2 |
|
Convergence and Union (CiU) |
851,105 | 30.05 | –0.30 |
10 | –1 |
|
People's Party (PP) |
480,204 | 16.95 | +6.43 |
6 | +3 |
|
Initiative for Catalonia (IC) |
240,019 | 8.47 | +0.28 |
3 | ±0 |
|
Republican Left of Catalonia (ERC) |
122,530 | 4.33 | +1.85 |
1 | +1 |
|
|
The Greens–Ecologist Confederation of Catalonia (EV–CEC) |
30,188 | 1.07 | –0.43 |
0 | ±0 |
|
Democratic and Social Centre (CDS) |
22,446 | 0.79 | –3.74 |
0 | –1 |
|
The Ecologists (LE) |
9,495 | 0.34 | –0.46 |
0 | ±0 |
|
Ecologist Party of Catalonia–VERDE (PEC–VERDE) |
8,179 | 0.29 | –0.04 |
0 | ±0 |
|
Workers' Socialist Party (PST) |
6,813 | 0.24 | –0.14 |
0 | ±0 |
|
Ruiz-Mateos Group–European Democratic Alliance (ARM–ADE) |
4,958 | 0.18 | –1.01 |
0 | ±0 |
|
Revolutionary Workers' Party (POR) |
2,557 | 0.09 | ±0.00 |
0 | ±0 |
|
Humanist Party (PH) |
1,181 | 0.04 | –0.05 |
0 | ±0 |
|
Spanish Phalanx of the CNSO (FE–JONS) |
1,132 | 0.04 | –0.05 |
0 | ±0 |
|
Natural Law Party (PLN) |
1,118 | 0.04 | New |
0 | ±0 |
|
Authentic Spanish Phalanx (FEA) |
747 | 0.03 | New |
0 | ±0 |
|
Coalition for a New Socialist Party (CNPS)1 |
712 | 0.03 | –0.02 |
0 | ±0 |
|
Union of Autonomies (UDLA) |
594 | 0.02 | New |
0 | ±0 |
|
Communist Unification of Spain (UCE) |
0 | 0.00 | New |
0 | ±0 |
| Blank ballots |
18,229 | 0.64 | +0.06 |
|
|
| Total |
2,832,260 | |
32 | ±0 |
|
| Valid votes |
2,832,260 | 99.64 | +0.18 |
|
| Invalid votes |
10,291 | 0.36 | –0.18 |
| Votes cast / turnout |
2,842,551 | 75.75 | +7.84 |
| Abstentions |
909,910 | 24.25 | –7.84 |
| Registered voters |
3,752,461 | |
|
| Sources[15] |
|
|
1989 general election
Summary of the 29 October 1989 Congress of Deputies election results in Barcelona
| Parties and coalitions |
Popular vote |
Seats |
| Votes |
% |
±pp |
Total |
+/− |
|
Socialists' Party of Catalonia (PSC–PSOE) |
903,546 | 36.98 | –6.23 |
14 | –2 |
|
Convergence and Union (CiU) |
741,682 | 30.35 | +0.50 |
11 | ±0 |
|
People's Party (PP)1 |
257,021 | 10.52 | –0.18 |
3 | –1 |
|
Initiative for Catalonia (IC)2 |
200,050 | 8.19 | +4.02 |
3 | +2 |
|
Democratic and Social Centre (CDS) |
110,681 | 4.53 | +0.17 |
1 | ±0 |
|
|
Republican Left of Catalonia (ERC) |
60,642 | 2.48 | –0.08 |
0 | ±0 |
|
Ruiz-Mateos Group (Ruiz-Mateos) |
29,187 | 1.19 | New |
0 | ±0 |
|
Party of the Communists of Catalonia (PCC) |
27,746 | 1.14 | –0.69 |
0 | ±0 |
|
The Ecologist Greens (EVE) |
19,573 | 0.80 | New |
0 | ±0 |
|
Green Alternative–Ecologist Movement of Catalonia (AV–MEC) |
18,518 | 0.76 | +0.15 |
0 | ±0 |
|
The Greens–Green List (EV–LV) |
18,089 | 0.74 | New |
0 | ±0 |
|
Workers' Party of Spain–Communist Unity (PTE–UC)3 |
10,782 | 0.44 | –0.19 |
0 | ±0 |
|
Workers' Socialist Party (PST) |
9,270 | 0.38 | +0.05 |
0 | ±0 |
|
Ecologist Party of Catalonia–VERDE (PEC–VERDE) |
8,110 | 0.33 | –0.15 |
0 | ±0 |
|
Social Democratic Coalition (CSD)4 |
4,996 | 0.20 | +0.07 |
0 | ±0 |
|
Revolutionary Workers' Party of Spain (PORE) |
2,276 | 0.09 | +0.02 |
0 | ±0 |
|
Humanist Party of Catalonia (PHC) |
2,223 | 0.09 | New |
0 | ±0 |
|
Spanish Phalanx of the CNSO (FE–JONS) |
2,087 | 0.09 | –0.03 |
0 | ±0 |
|
Centrist Unity–Democratic Spanish Party (PED) |
1,200 | 0.05 | ±0.00 |
0 | ±0 |
|
Alliance for the Republic (AxR)5 |
1,127 | 0.05 | –0.05 |
0 | ±0 |
|
Valencian Nationalist Left–Valencian Regional Union (ENV–URV) |
596 | 0.02 | New |
0 | ±0 |
|
Communist Party of Spain (Marxist–Leninist) (PCE (m–l))6 |
0 | 0.00 | –0.11 |
0 | ±0 |
| Blank ballots |
14,241 | 0.58 | +0.17 |
|
|
| Total |
2,443,643 | |
32 | –1 |
|
| Valid votes |
2,443,643 | 99.46 | +0.27 |
|
| Invalid votes |
13,323 | 0.54 | –0.27 |
| Votes cast / turnout |
2,456,966 | 67.91 | –0.87 |
| Abstentions |
1,160,982 | 32.09 | +0.87 |
| Registered voters |
3,617,948 | |
|
| Sources[16] |
|
|
1986 general election
Summary of the 22 June 1986 Congress of Deputies election results in Barcelona
| Parties and coalitions |
Popular vote |
Seats |
| Votes |
% |
±pp |
Total |
+/− |
|
Socialists' Party of Catalonia (PSC–PSOE) |
1,054,135 | 43.21 | –4.98 |
16 | –2 |
|
Convergence and Union (CiU) |
728,372 | 29.85 | +8.95 |
11 | +3 |
|
People's Coalition (AP–PDP–PL)1 |
261,166 | 10.70 | –3.69 |
4 | –1 |
|
Democratic and Social Centre (CDS) |
106,434 | 4.36 | +2.50 |
1 | +1 |
|
Union of the Catalan Left (PSUC–ENE)2 |
101,654 | 4.17 | –1.64 |
1 | ±0 |
|
|
Republican Left of Catalonia (ERC) |
62,390 | 2.56 | –1.16 |
0 | –1 |
|
Party of the Communists of Catalonia (PCC) |
44,757 | 1.83 | +0.29 |
0 | ±0 |
|
Communists' Unity Board (MUC) |
15,390 | 0.63 | New |
0 | ±0 |
|
Green Alternative List (LAV) |
14,788 | 0.61 | New |
0 | ±0 |
|
Ecologist Party of Catalonia–VERDE (PEC–VERDE) |
11,746 | 0.48 | New |
0 | ±0 |
|
Workers' Socialist Party (PST) |
7,964 | 0.33 | –0.25 |
0 | ±0 |
|
Communist Unification of Spain (UCE) |
4,411 | 0.18 | +0.12 |
0 | ±0 |
|
Social Democratic Party of Catalonia (PSDC) |
3,137 | 0.13 | New |
0 | ±0 |
|
Spanish Phalanx of the CNSO (FE–JONS) |
2,999 | 0.12 | +0.12 |
0 | ±0 |
|
Republican Popular Unity (UPR)3 |
2,658 | 0.11 | +0.04 |
0 | ±0 |
|
Internationalist Socialist Workers' Party (POSI) |
2,386 | 0.10 | New |
0 | ±0 |
|
Communist Workers' League (LOC) |
1,952 | 0.08 | +0.08 |
0 | ±0 |
|
Revolutionary Workers' Party of Spain (PORE) |
1,626 | 0.07 | New |
0 | ±0 |
|
Democratic Spanish Party (PED) |
1,169 | 0.05 | New |
0 | ±0 |
|
Proverist Party (PPr) |
756 | 0.03 | New |
0 | ±0 |
| Blank ballots |
9,905 | 0.41 | +0.01 |
|
|
| Total |
2,439,795 | |
33 | ±0 |
|
| Valid votes |
2,439,795 | 99.19 | +0.44 |
|
| Invalid votes |
19,897 | 0.81 | –0.44 |
| Votes cast / turnout |
2,459,692 | 68.78 | –12.75 |
| Abstentions |
1,116,712 | 31.22 | +12.75 |
| Registered voters |
3,576,404 | |
|
| Sources[17] |
|
|
1982 general election
Summary of the 28 October 1982 Congress of Deputies election results in Barcelona
| Parties and coalitions |
Popular vote |
Seats |
| Votes |
% |
±pp |
Total |
+/− |
|
Socialists' Party of Catalonia (PSC–PSOE) |
1,292,672 | 48.19 | +17.91 |
18 | +6 |
|
Convergence and Union (CiU) |
560,555 | 20.90 | +5.10 |
8 | +2 |
|
People's Alliance–People's Democratic Party (AP–PDP)1 |
385,967 | 14.39 | +10.72 |
5 | +4 |
|
Unified Socialist Party of Catalonia (PSUC–PCE) |
131,314 | 4.90 | –14.14 |
1 | –6 |
|
Republican Left of Catalonia (ERC) |
99,852 | 3.72 | –0.15 |
1 | ±0 |
|
|
Democratic and Social Centre (CDS) |
49,772 | 1.86 | New |
0 | ±0 |
|
Party of the Communists of Catalonia (PCC) |
41,371 | 1.54 | New |
0 | ±0 |
|
Centrists of Catalonia (CC–UCD) |
40,222 | 1.50 | –15.39 |
0 | –6 |
|
Left Nationalists (NE) |
24,382 | 0.91 | New |
0 | ±0 |
|
Workers' Socialist Party (PST) |
15,462 | 0.58 | New |
0 | ±0 |
|
New Force (FN)2 |
8,724 | 0.33 | –0.57 |
0 | ±0 |
|
Socialist Party of Andalusia–Andalusian Party (PSA–PA) |
6,687 | 0.25 | New |
0 | ±0 |
|
Communist Front of Catalonia (FCC)3 |
3,937 | 0.15 | –0.10 |
0 | ±0 |
|
Communist Workers' Party of Catalonia (PCOC) |
2,699 | 0.10 | New |
0 | ±0 |
|
Spanish Solidarity (SE) |
2,391 | 0.09 | New |
0 | ±0 |
|
Communist Party of Spain (Marxist–Leninist) (PCE (m–l)) |
2,011 | 0.07 | New |
0 | ±0 |
|
Conservatives of Catalonia (CiC) |
1,889 | 0.07 | New |
0 | ±0 |
|
Communist Unification of Spain (UCE) |
1,689 | 0.06 | –0.22 |
0 | ±0 |
|
Communist League–Internationalist Socialist Workers' Coalition (LC (COSI)) |
0 | 0.00 | ±0.00 |
0 | ±0 |
|
Spanish Phalanx of the CNSO (FE–JONS) |
0 | 0.00 | New |
0 | ±0 |
|
Socialist Party (PS)4 |
0 | 0.00 | –1.30 |
0 | ±0 |
| Blank ballots |
10,818 | 0.40 | –0.02 |
|
|
| Total |
2,682,414 | |
33 | ±0 |
|
| Valid votes |
2,682,414 | 98.75 | +0.58 |
|
| Invalid votes |
33,875 | 1.25 | –0.58 |
| Votes cast / turnout |
2,716,289 | 81.53 | +14.11 |
| Abstentions |
615,322 | 18.47 | –14.11 |
| Registered voters |
3,331,611 | |
|
| Sources[18] |
|
|
1979 general election
Summary of the 1 March 1979 Congress of Deputies election results in Barcelona
| Parties and coalitions |
Popular vote |
Seats |
| Votes |
% |
±pp |
Total |
+/− |
|
Socialists' Party of Catalonia (PSC–PSOE)1 |
694,847 | 30.28 | –2.02 |
12 | +1 |
|
Unified Socialist Party of Catalonia (PSUC–PCE) |
436,908 | 19.04 | –0.82 |
7 | ±0 |
|
Centrists of Catalonia (CC–UCD)2 |
387,543 | 16.89 | +1.83 |
6 | +1 |
|
Convergence and Union (CiU)3 |
362,427 | 15.80 | –5.04 |
6 | –2 |
|
Republican Left of Catalonia–National Front of Catalonia (ERC–FNC)4 |
88,770 | 3.87 | –0.90 |
1 | ±0 |
|
Democratic Coalition (CD)5 |
84,195 | 3.67 | +0.49 |
1 | ±0 |
|
|
Left Bloc for National Liberation (BEAN) |
41,430 | 1.81 | New |
0 | ±0 |
|
Party of Labour of Catalonia (PTC–PTE) |
36,001 | 1.57 | New |
0 | ±0 |
|
Spanish Socialist Workers' Party (historical) (PSOEh)6 |
29,868 | 1.30 | +0.93 |
0 | ±0 |
|
National Union (UN)7 |
20,743 | 0.90 | +0.52 |
0 | ±0 |
|
Republican Left (IR) |
15,019 | 0.65 | New |
0 | ±0 |
|
Workers' Revolutionary Organization (ORT)8 |
11,122 | 0.48 | +0.06 |
0 | ±0 |
|
Communist Movement–Organization of Communist Left (MC–OIC)9 |
10,714 | 0.47 | –0.04 |
0 | ±0 |
|
Workers' Communist Party (PCT) |
10,022 | 0.44 | New |
0 | ±0 |
|
Communist Organization of Spain (Red Flag) (OCE–BR) |
8,120 | 0.35 | New |
0 | ±0 |
|
Communist Unification of Spain (UCE) |
6,515 | 0.28 | New |
0 | ±0 |
|
Syndicalist Party (PSIN) |
5,932 | 0.26 | New |
0 | ±0 |
|
Revolutionary Communist League (LCR)10 |
5,775 | 0.25 | –0.32 |
0 | ±0 |
|
Catalan State (EC) |
5,767 | 0.25 | New |
0 | ±0 |
|
Social Christian Democracy of Catalonia (DSCC) |
4,976 | 0.22 | –0.17 |
0 | ±0 |
|
Spanish Phalanx of the CNSO (Authentic) (FE–JONS(A)) |
3,908 | 0.17 | –0.10 |
0 | ±0 |
|
Liberal Party of Catalonia (PLC) |
3,267 | 0.14 | New |
0 | ±0 |
|
Carlist Party (PC) |
2,554 | 0.11 | New |
0 | ±0 |
|
Basque Country Left (EE) |
2,550 | 0.11 | New |
0 | ±0 |
|
Pro-Austerity Policy Political Party (PIPPA) |
2,409 | 0.10 | New |
0 | ±0 |
|
Union for the Freedom of Speech (ULE) |
1,838 | 0.08 | New |
0 | ±0 |
|
Proverist Party (PPr) |
1,622 | 0.07 | –0.10 |
0 | ±0 |
|
Communist League (LC) |
0 | 0.00 | New |
0 | ±0 |
|
Spanish Phalanx–Falangist Unity (FE–UF) |
0 | 0.00 | New |
0 | ±0 |
| Blank ballots |
9,714 | 0.42 | +0.24 |
|
|
| Total |
2,294,556 | |
33 | ±0 |
|
| Valid votes |
2,294,556 | 98.17 | –0.59 |
|
| Invalid votes |
42,753 | 1.83 | +0.59 |
| Votes cast / turnout |
2,337,309 | 67.42 | –12.21 |
| Abstentions |
1,129,224 | 32.58 | +12.21 |
| Registered voters |
3,466,533 | |
|
| Sources[19] |
|
|
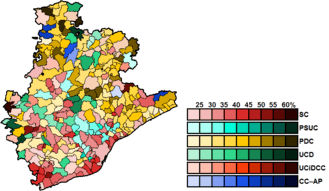
1977 general election
Summary of the 15 June 1977 Congress of Deputies election results in Barcelona
| Parties and coalitions |
Popular vote |
Seats |
| Votes |
% |
±pp |
Total |
+/− |
|
Socialists of Catalonia (SC) |
721,880 | 30.55 | n/a |
11 | n/a |
|
Unified Socialist Party of Catalonia (PSUC–PCE) |
469,361 | 19.86 | n/a |
7 | n/a |
|
Democratic Pact for Catalonia (PDC) |
364,798 | 15.44 | n/a |
6 | n/a |
|
Union of the Democratic Centre (UCD) |
355,857 | 15.06 | n/a |
5 | n/a |
|
Union of the Centre and Christian Democracy of Catalonia (UCiDCC) |
127,679 | 5.40 | n/a |
2 | n/a |
|
Left of Catalonia–Democratic Electoral Front (EC–FED) |
112,794 | 4.77 | n/a |
1 | n/a |
|
Catalan Coexistence–People's Alliance (CC–AP) |
75,097 | 3.18 | n/a |
1 | n/a |
|
|
People's Socialist Party–Socialist Unity (PSP–US) |
41,356 | 1.75 | n/a |
0 | n/a |
|
Front for Workers' Unity (FUT) |
13,559 | 0.57 | n/a |
0 | n/a |
|
Popular Unity for Socialism Candidacy (CUPS) |
12,040 | 0.51 | n/a |
0 | n/a |
|
Workers' Electoral Group (AET) |
10,017 | 0.42 | n/a |
0 | n/a |
|
League of Catalonia–Catalan Liberal Party (LC–PLC) |
9,203 | 0.39 | n/a |
0 | n/a |
|
Social Christian Democracy of Catalonia (DSCC) |
9,157 | 0.39 | n/a |
0 | n/a |
|
National Alliance July 18 (AN18) |
8,895 | 0.38 | n/a |
0 | n/a |
|
Democratic Socialist Alliance (ASDCI) |
8,738 | 0.37 | n/a |
0 | n/a |
|
Catalan Social Reform (RSC) |
7,900 | 0.33 | n/a |
0 | n/a |
|
Spanish Phalanx of the CNSO (Authentic) (FE–JONS(A)) |
6,395 | 0.27 | n/a |
0 | n/a |
|
Proverist Party (PPr) |
4,112 | 0.17 | n/a |
0 | n/a |
| Blank ballots |
4,279 | 0.18 | n/a |
|
|
| Total |
2,363,117 | |
33 | n/a |
|
| Valid votes |
2,363,117 | 98.76 | n/a |
|
| Invalid votes |
29,657 | 1.24 | n/a |
| Votes cast / turnout |
2,392,774 | 79.63 | n/a |
| Abstentions |
612,214 | 20.37 | n/a |
| Registered voters |
3,004,988 | |
|
| Sources[20] |