Piecewise linear function
In mathematics, a piecewise linear function is a real-valued function defined on the real numbers or a segment thereof, whose graph is composed of straight-line sections.[1] It is a piecewise-defined function, each of whose pieces is an affine function.
Usually – but not always – the function is assumed to be continuous; in that case, its graph is a polygonal curve.
Examples
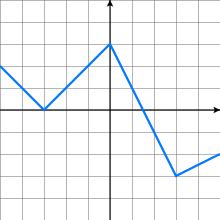
The function defined by:

is piecewise linear with four pieces. (The graph of this function is shown to the right.) Since the graph of a linear function is a line, the graph of a piecewise linear function consists of line segments and rays.
Other examples of piecewise linear functions include the absolute value function, the square wave, the sawtooth function, and the floor function.
Fitting to a curve
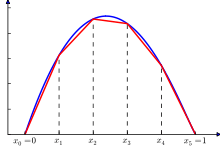
An approximation to a known curve can be found by sampling the curve and interpolating linearly between the points. An algorithm for computing the most significant points subject to a given error tolerance has been published.[2]
Fitting to data
If partitions are already known, linear regression can be performed independently on these partitions. However, continuity is not preserved in that case. A stable algorithm with this case has been derived.[3]
If partitions are not known, the residual sum of squares can be used to choose optimal separation points.[4]
A variant of decision tree learning called model trees learns piecewise linear functions.[5]
Notation

The notion of a piecewise linear function makes sense in several different contexts. Piecewise linear functions may be defined on n-dimensional Euclidean space, or more generally any vector space or affine space, as well as on piecewise linear manifolds, simplicial complexes, and so forth. In each case, the function may be real-valued, or it may take values from a vector space, an affine space, a piecewise-linear manifold, or a simplicial complex. (In these contexts, the term “linear” does not refer solely to linear transformations, but to more general affine linear functions.)
In dimensions higher than one, it is common to require the domain of each piece to be a polygon or polytope. This guarantees that the graph of the function will be composed of polygonal or polytopal pieces.
Important sub-classes of piecewise linear functions include the continuous piecewise linear functions and the convex piecewise linear functions. In general, for every n dimensional continuous piecewise linear function , there is a


such that:

If is convex as well as continuous, then there is a


such that:

Splines generalize piecewise linear functions to higher-order polynomials, which are in turn contained in the category of piecewise-differentiable functions, PDIFF .
Applications

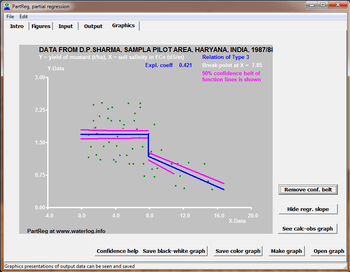
In agriculture piecewise regression analysis of measured data is used to detect the range over which growth factors affect the yield and the range over which the crop is not sensitive to changes in these factors.
The image on the left shows that at shallow watertables the yield declines, whereas at deeper (> 7 dm) watertables the yield is uaffected. The graph is made using the method of least squares to find the two segments with the best fit.
The graph on the right reveals that crop yields tolerate a soil salinity up to ECe = 8 dS/m (ECe is the electric conductivity of an extract of a saturated soil sample), while beyond that value the crop production reduces. The graph is made with the method of partial regression to find the longest range of "no effect", i.e. the line is horizontal. The two segments need not join at the same point. Only for the second segment method of least squares is used.
See also
Further reading
- Apps, P., Long, N., & Rees, R. (2014). Optimal piecewise linear income taxation. Journal of Public Economic Theory, 16(4), 523-545.
References
- ↑ Stanley, William D. (2004). Technical Analysis And Applications With Matlab. Cengage Learning. p. 143. ISBN 1401864813.
- ↑ Hamann, B.; Chen, J. L. (1994). "Data point selection for piecewise linear curve approximation". Computer Aided Geometric Design. 11 (3): 289. doi:10.1016/0167-8396(94)90004-3.
- ↑ Golovchenko, Nikolai. "Least-squares Fit of a Continuous Piecewise Linear Function". Retrieved 6 Dec 2012.
- ↑ Vieth, E. (1989). "Fitting piecewise linear regression functions to biological responses". Journal of Applied Physiology. 67 (1): 390–396. PMID 2759968.
- ↑ Landwehr, N.; Hall, M.; Frank, E. (2005). "Logistic Model Trees" (PDF). Machine Learning. 59: 161. doi:10.1007/s10994-005-0466-3.
- ↑ A calculator for piecewise regression
- ↑ A calculator for partial regression