Water pollution in the United States
Water pollution in the United States is a growing problem that became critical in the 19th century with the development of mechanized agriculture, mining, and industry, although recent regulation has drastically reduced water pollution throughout the nation.[1] Extensive industrialization and rapid urban growth exacerbated water pollution as a lack of regulation allowed for toxic discharges into surface water.
(NRCS_Photo_Gallery).jpg)
In the early 20th century, communities began to install drinking water treatment systems but the control of principal pollution sources — domestic sewage, industry, and agriculture— was not effectively addressed in the US until the later 20th century.
These pollution sources can affect both groundwater or surface water depending on their mode of contamination, which could include point, nonpoint, or transboundary pollution. Multiple incidents, including water pollution in Flint, Michigan, and the Deepwater Horizon oil spill, have left lasting impacts on water quality, ecosystems, and public health in the United States.[2][3]
Multiple solutions to water pollution in the United States can be implemented to curtail water pollution. This includes municipal wastewater treatment, agricultural and industrial wastewater treatment, erosion and sediment control, and the control of urban runoff. The continued successful implementation of water treatment and pollution control measures are used to keep water quality within levels of federal and state regulation.
Overview
Since the passage of the 1972 Clean Water Act (CWA), the levels of water pollution in the United States generally have experienced a dramatic decrease, resulting in much cleaner waterways.[4]
However, more than half of U.S. stream and river miles continue to violate federal water quality standards. Surveys of lakes, ponds and reservoirs indicated that about 70 percent were impaired (measured on a surface area basis), and a little more than 70 percent of the nation’s coastlines, and 90 percent of the surveyed ocean and near coastal areas were also impaired.[5]
Agriculture, industry, urban runoff, and other sources continue to discharge waste into surface waters nationwide. This poses huge environmental and health risks given that these water sources are used as drinking water and for agricultural use.
While the CWA has made positive contributions to the state of surface water in the United States, the law does not fully address all aspects of pollution. Many think that Congress should revise or expand the law to address these problems and gaps in regulation.[6] While the CWA has been effective in controlling point source pollution (pollution whose source is known), it has not been effective with nonpoint sources (where there is no clear polluter).[7]
Water pollution can occur in either surface water or groundwater, and is classified according to its sources as point, non-point, or transboundary. Major causes of water pollution in the United States are municipal sewage spills, urban runoff, industrial pollution, and agricultural pollution. Despite the negative health and ecosystem impacts of water pollution, solutions exist that are able to treat and decrease pollution levels in water bodies.
Types
Surface water pollution
Surface water consists of all forms of visible water sources, such as oceans, lakes, and rivers. Currently, a significant percentage of surface freshwater sources are polluted in the United States.[8] This poses a huge threat to American water sources because over 60% of water used in the United States is from these freshwater sources.[8] A majority of freshwater contamination cases are a result of nutrient pollution, which is the result of farm waste and fertilizer entering the water source and resulting in toxic zones with depleted oxygen levels.[8]
Groundwater pollution
Groundwater is rainfall that collects in porous spaces deep underground, which are called aquifers.[8] Humans can access the water that collects in an aquifer by building wells to pump the water to the surface for use.[9] About 40% of drinking water in America comes from groundwater sources.[8] When contaminants enter aquifers, the pollution spreads, eliminating the potential to use the aquifer for drinking water. Groundwater contamination is often the result of chemicals that seep through the soil and into the water supply, such as pesticides and fertilizers. Other causes of contamination in groundwater includes gasoline, oil, road salts, septic tank waste, or leakage from landfills.[10]
Categories of pollution sources
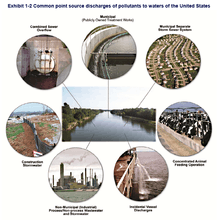
Point source
Point source pollution occurs when water pollution contamination comes from a single source. Point sources could include leaking septic tanks, oil spills, dumping waste, or wastewater treatment facilities.[8] In order to prevent point source pollution from occurring, the Clean Water Act regulates what can be dumped into a specific discharge point by requiring National Pollutant Discharge Elimination System (NPDES) permits.[11] This prevents the discharge of potentially dangerous waste water into US water sources.
Nonpoint source
Nonpoint source pollution occurs when the contamination derives from multiple different sources. This type of pollution is very challenging to manage given that the original source cannot be identified.[8] Nonpoint source pollution is the most common type of pollution because as rainfall runs off of land on its path to different water sources, it becomes contaminated by pollutants from the surrounding area. These sources include agriculture related pollutants, urban runoff, or drainage.[12]
Trans-boundary sources
Trans-boundary water pollution occurs when pollution in one country’s waters spreads and damages another country’s environment or water supply. Trans-boundary pollution can travel through rivers or ocean currents.[13]
Causes of pollution
Municipal sewage
Municipal sewage is a major contribution to water pollution in the United States. The lack of proper treatment of municipal waste results in the discharge of polluted water into bodies of water across the USA.[14] Wastewater continues to pollute water in the United States because there are over 600,000 miles of sewer pipes across the country, many of which are outdated or leaking.[15] Poor upkeep of sewer infrastructure results in contamination from leaks, and contributed to the American Society of Civil Engineer's rating of a D for America's wastewater infrastructure.[15]
Domestic sewage became a widespread problem with the onset of the industrial revolution in the 19th century, population growth and increasing urbanization. Through the early 20th century, most communities had no sewage treatment plants or waste disposal cites. Some cities built sewer pipes which carried the sewage to a nearby river or coastal area, but lacked any treatment of the wastes, instead depositing sewage directly into the water. The first wastewater treatment plants were built in the late 19th and early 20th centuries in the United States and typically did not fully treat the wastes.[16]
While all wastewater is now treated, leaks and spills of municipal sewage pose a significant problem because wastewater carries diseases like salmonella, hepatitis, and many other infectious diseases that roughly sickens about 3.5 million Americans every year.[15]
Urban runoff
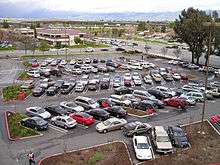
Water research during the late 1970s and 1980s indicated that stormwater runoff was a significant cause of water quality impairment in many parts of the US.[17] Increased land development throughout the country—in both cities and suburbs—has led to an increase in impervious surfaces (parking lots, roads, buildings, compacted soil), which generates increased surface runoff during wet weather.
The development of new roads and smooth surfaces have contributed to polluted waters easily flowing into nearby rivers, lakes, and the oceans across the USA.[18] These paved surfaces and roads restrict water from soaking into the ground, and instead allows water to freely flow across pavements while picking up chemicals, fertilizers, pesticides, and many other pollutants that causes water pollution in the bodies of water in the USA.[19]
Industrial pollution
Early indications of pollution from industrial waste in the United States existed since the 1870s, increasing as the industrial revolution expanded throughout the United States and its environmental impacts were observed more frequently.[20][21] Industrial wastes contribute toxic pollutants and chemicals and can have detrimental ecosystem and public health impacts if discharged directly into surface water.[21]
Growth of industrialization and industrial waste
Historical accounts of early industrial activity in the US provide a general description of the kinds of waste generated. Mining operations (coal, metals, minerals), iron forges and blast furnaces were some of the early industries in the U.S. that generated waste. In the late 18th and early 19th centuries, wastes from mining operations entered rivers and streams, and iron bloomeries and furnaces used water for cooling.[22]:27, 32–33, 53 These industries were relatively small businesses generating small amounts of product,[23] and the wastes they discharged to rivers and streams were proportionately dilute. However as factories grew in the 19th century, so did the quantity of pollution produced. In the early 19th century, the introduction of steam engines in both the mining and manufacturing sectors (such as textiles) greatly expanded productivity, and increased use of the engines generated larger volumes of heated water (thermal pollution).[22]:52–53 The productivity gains, along with the introduction of railroads in the 1830s and 1840s—which increased the overall demand for coal and minerals—led to additional generation of wastes.[24][25]:68–69
Modern day industrial waste
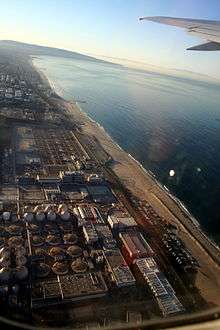
Today, industrial pollution is caused by discharges and emissions from manufacturing plants, which continues to pollute our bodies of water.[26] Common manufacturing methods release wastewater discharge, contributing to the water pollution found in rivers, lakes, and oceans across the States.[27] The U.S. Environmental Protection Agency (EPA) found that power plants were the largest contributors of industrial water pollution. The EPA found instances where power plants dumped pollutants, such as mercury, arsenic, and lead into surface waters.[28] The continuation of chemical dumping by industrial facilities plays a key role in water pollution today in the USA. According to the EPA, water pollution from industrial facilities is responsible for polluting water quality in more than 10,000 miles of rivers and more than 200,000 acres of lakes, ponds, estuaries nationwide.[29]
Agricultural pollution
Discharges and chemicals from agriculture greatly contributes to water pollution in the US, as rainwater flows through fields and into bodies of water.[30] The application of chemical fertilizers, collection of animal manure, and use of chemicals used by farmers results in nitrogen and phosphorus. When washed away from farming fields, nitrogen and phosphorus found in fertilizers can cause eutrophication of water bodies.[31] Eutrophication results in algal blooms which deplete oxygen in bodies of water, resulting in dead zones where life can no longer be sustained. Excessive use or improper use of fertilizers, pesticides, and various types of chemicals during farming contribute to water pollution, and are currently the third largest source for water pollution in lakes, second largest source of water pollution in wetlands, and a major contributor to pollution in estuaries and ground water.[32]
Solutions
Municipal wastewater treatment
Municipal wastewater is composed of human waste and other residential waste streams.[35] In the United States, approximately 34 billion gallons of wastewater are collected every day and sent to wastewater treatment plants.[36] Wastewater is collected through combined sewers, which are used for sanitary waste and stormwater runoff, or in separate sanitary sewers.[15] Wastewater treatment plants include physical removal processes, such as screens and settling tanks, and biological processes to remove organic matter and pathogens from water.[37] Some plants have enhanced treatment processes to target nitrogen removal from influent water.[36] Treatment plants have strict permitting on the quality of effluent water to ensure discharged water will not cause harm to the environment or public health.[38]
Agricultural wastewater treatment
Agricultural run-off is one of the leading causes of water pollution in the United States.[39] Funding from Clean Water Grants are available to farmers to install projects to help control agricultural pollution before it enters water sources.[40] Methods to minimize and contain water pollution from agriculture in the United States include watershed efforts, nutrient management, cover crops, buffers, management of livestock waste, and drainage management.[41] Buffers are small strips of land covered in plants that are able to remove pollutants such as nitrogen, phosphorus, and sediment prior to discharge in a water body.[42] Both buffers and crop covers are used to remove these pollutants from agricultural runoff.[42]
Erosion and sediment control
Erosion and sediment controls are techniques used to mitigate sediment pollution in waterways.[43] The most common and efficient control method is crop management, which increases soil cover and stabilizes slopes.[43] Without proper soil stabilization techniques, rainfall can cause large quantities of sediment to be washed away into waterways, creating issues with sunlight penetration and visibility. Additional pollution control measures include silt fences, erosion control matting, and shoreline restoration.[44]
Control of urban run-off
Urban areas affect water quality by increasing the volume of run-off and pollutant loads.[45] One solution to decrease run-off is constructing new surfaces with pervious pavers, that allow rainwater to pass through the surface to groundwater aquifers and decrease the quantity of urban run-off.[45] Additionally, proper use and storage of household chemicals are critical to decrease incidences of spills that pollute local waterways.[45]
Large-scale pollution incidents
Flint, Michigan
The water crisis in Flint, Michigan began in 2014 after the state switched the city’s water supply from Lake Huron to the Flint River to reduce costs.[2] The state of Michigan backed the cost-saving transition after a 2011 audit estimated that Flint was over $25 million in debt from mishandling of the city’s finances.[46] However, the Flint River water supply lacked the necessary corrosion control treatment to prevent lead release from pipes and plumbing, a traditional material used in pipes. The failure to follow the necessary protocol exposed over 140,000 residents to lead and other contaminants.[47]
Human health
Soon after the change to the Flint River, citizens were complaining that their water had become noticeably dirty and foul-smelling. The pipe corrosion had led to a significant increase in bacteria levels, and exposed residents to harmful concentrations of lead and heavy metals.[48] The Flint water supply was linked to a 2014 outbreak of Legionnaires’ disease, a severe form of pneumonia caused by the bacteria Legionella pneumophila.[49] The outbreak following the Flint water crisis was one of the most widespread instances of Legionnaires’ disease in U.S. history, with 90 confirmed cases and 12 deaths.[50] In addition to the dangerous waterborne bacteria, the water also tested for extremely high levels of lead. A 2015 study by Hurley Medical Center revealed the proportion of infants and children with above-average levels of lead in their blood had essentially doubled since making the switch to the Flint River.[51] Young children and infants are especially sensitive to lead exposure, with physical and behavioral consequences occurring at much lower levels of lead in children than in adults.[52] According to the World Health Organization, lead exposure has detrimental effects on children causing poor brain development, lower IQ, behavioral changes like shortening of attention span and increased antisocial behavior, and reduced educational attainment. In addition, the effects of lead are thought to be permanent.[53]
Environment
The environmental pollution in Flint began long before the 2014 switch in water supply. Flint is a city that capitalized on the Industrial Revolution, starting with the lumber mills of the 1830s, to automobile factories in the early 1900s.[54] Notably, General Motors has a large-scale operation in Flint. GM’s presence in Flint reached its height in the early 1980s, employing more than 80,000 workers on their factories along the river. GM’s success in Flint coincided with environmental waste and pollution. The river deteriorated from decades of industrial dumping from GM and its suppliers, eventually becoming so polluted the city had to begin buying water from Detroit.[55]
Economy
Five years later, the Flint water crisis is still very relevant. Despite making the switch back to Lake Huron for the city’s water supply, costly damage has been done on Flint’s water infrastructure. Until all lead pipes are replaced, the issue still exists, and the city’s goal is to have all corroded service lines replaced by 2020.[56] Called the “Fast Start” project, Flint hopes to replace 18,000 lead service lines by next year; a settlement the city agreed to in a 2017 lawsuit.[57] The state of Michigan supported the initiative with an $87 million commitment, in addition to a $100 million contribution from Congress and the EPA.[58]
Deepwater Horizon

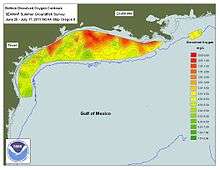
The Deepwater Horizon Oil Spill began on April 20, 2010 when a semi-submersible BP oil rig exploded in the Gulf of Mexico about 41 miles off of the coast of Louisiana.[59] The explosion lead to the largest marine oil spill in history, discharging anywhere from 1,000 to 60,000 barrels of oil per day.[3] It took responders 87 days to stop the spill, at which point the rig had leaked an estimated 3.19 million barrels of oil into the Gulf. Over 1,000 miles of shoreline on the Gulf of Mexico, from Texas to Florida, were impacted by the Deepwater Horizon spill.[60]
Human health
Of the crew members present during the Deepwater Horizon Oil Spill, 11 died and 17 were seriously injured.[61] In addition, the frequency of hurricanes in the Gulf makes the effects of long-term exposure on humans more applicable, as these storms are capable of carrying crude oil over miles of ocean towards the shore. According to a research article from LSU, “damages to those living in the presence of crude oil the past 10 years are likely permanent, as chronic exposure leads to increased cancer risks, cardiovascular issues, and respiratory problems.” [62] Oil exposure and its respiratory effects were also analyzed in a study on the Coast Guard personnel deployed to help clean up the spill. The article has 54.6% of responders stating they were exposed to crude oil, and 22.0% stating they were exposed to oil dispersants. Of the nearly 5,000 personnel who completed the survey, 19.4% experienced coughing, 5.5% experienced shortness of breath, and 3.6% experienced wheezing. The study also found that exposure to both oil and oil dispersants presented associations that were much stronger than oil alone for the different respiratory symptoms.[63]
Environment
The northeast Gulf of Mexico shoreline contains about 60 percent of the coastal and freshwater marshes in the United States.[64] A marsh environment tends to have standing water, making it among the most sensitive habitats to oil spills. Without the natural cleaning mechanism that flowing water provides, oil is able to coat marsh vegetation for longer periods of time, ruining nurseries that then impact a host of interconnected species.[65] The Gulf of Mexico is also home to 22 species of marine mammals. Of these, up to 20 percent of all Kemp’s Ridley sea turtles present during the spill ended up dying, and the Louisiana Bottlenose dolphin ended up facing a 50 percent decline in population.[66] However, because the BP oil spill occurred miles from any land, it wasn’t as damaging to ecosystems along the shore as other oil spills. However, habitats along the shore were still exposed through balls of tar that would clump together and wash up on beaches, impacting local wildlife. Also, the consequences that drifting plumes of oil had on the deep-sea ecosystem is relatively unknown.[67]
Economy
In December 2010, the U.S. filed a complaint in District Court against BP and several other defendants associated with the spill. The complaint resulted in a record-setting settlement, enforcing a $5.5 billion Clean Water Act penalty on BP Exploration & Production and up to $8.8 billion in natural resource damages.[68] However, by 2015, BP had successfully recuperated most of the $40 billion lost in market value after the spill. This recovery was attributed to the company’s inclination to continue exploring new oil resources despite the accident. Between 2011 and 2013, BP’s Gulf of Mexico oil rigs doubled, and they began investing $1 billion towards opportunities in Alaska in 2015.[69] On the other hand, a 2015 article from NPR exhibited how fishing cities along the Gulf Coast are still feeling harmful effects of the oil spill. In an interview with an oysterman from Alabama, he states, “business is still struggling...because of the lack of oyster production...I place the blame for that on the oil spill.” The fisherman goes on to describe how the oyster reefs off of Louisiana have not been producing like they should since the spill.[70]
List of other notable incidents
Woburn, Massachusetts
Water pollution in the city of Woburn, Massachusetts gained public recognition in the 1984 lawsuit filed by the families of children in Woburn who had died from leukemia in unusually high numbers.[71] The families attributed the leukemia to the town’s polluted drinking water which had been contaminated over 150 years of industry, most notably the toxic compounds used by leather factories in the area.[71]
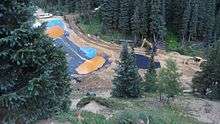
2015 Gold King Mine
On August 5, 2015 workers on the Gold King Mine in Silverton, Colorado released 3 million gallons of toxic wastewater when attempting to add a tap to the tailing pond for the mine.[72] The wastewater carried unsafe levels of heavy metals, with some parts of the river testing for hundreds of times over their limits.[73]
Martin County
The Martin County coal slurry spill occurred on October 11, 2000, when a coal slurry broke into an abandoned mine and sent an estimated 306 million gallons of slurry into the Tug Fork River. The spill polluted 200–300 miles of the Big Sandy River and a water supply for over 27,000 residents.
Washington, D.C.
In 2001, Professor Marc Edwards discovered lead levels in Washington, D.C.'s drinking water is at least 83 times higher than acceptable limits while performing research on pipe corrosion for the D.C. Water and Sewer Authority. The lead exposure has left thousands of children with lifelong health risks.
Kingston Fossil Plant
On December 22, 2008, a dike ruptured on the Kingston Fossil Plant in Roane County, Tennessee and released 1.1 billion gallons of coal fly ash slurry into the Emory River. It was the largest fly ash release and worst coal ash-related disaster in U.S. history.
Regulations
Historical
During the late 19th century, there was little federal government attention paid to what were considered to be local environmental and health problems. The only federal legislation to address water pollution during this era was the Rivers and Harbors Act of 1899.[74] In the 1899 law, Congress prohibited the dumping of "refuse"—debris that interfered with navigation—but other forms of pollution (e.g. sewage, food waste, chemical waste, oil spills) were not addressed.[75] In 1924, to address oil spills in harbors, Congress passed the Oil Pollution Act. The law provided for penalties in the event of oil spills, but they were applicable only to vessels in coastal waters.[76] In the 1930s and 40s, state water boards were created to monitor some aspects of water quality.
Current
The Clean Water Act of 1972 (CWA) was the first act of its kind to establish regulation governing water quality and discharge in the United States.[77] The CWA governs procedures for pollution control and water treatment.[77] Additionally, the Act also sets criteria for water pollutants in surface water.[77] This regulation names the Environmental Protection Agency as the authority over pollution in surface waters in the United States, allowing them to set further regulation to protect waterways.[78] Before this, it was legal to discharge wastewater to surface waters without testing for or removing water pollutants.[78] The CWA was amended in 1981 and 1987 to address municipal water treatment construction and to later establish the Clean Water State Revolving Fund, which provides grants to states to aid in water treatment processes.[78]
Under the CWA, the National Pollution Discharge Elimination System (NPDES) regulates permits for discharges into bodies of water.[77] This system requires each polluter to apply for a specific permit for their wastewater discharges, which led to the need for industrial wastewater treatment processes, as discharge water could no longer be released without treatment.[77] The permit also includes monitoring and reporting requirements, which allows the EPA to assess total pollutant volumes entering a waterway.[11] However, over fifty percent of the rivers in the United States still violate pollution standards set by the CWA.[79] CWA and NPDES form the backbone of regulation for controlling surface water pollution in the United States.[80] Additional regulation exists on a state-by-state basis, allowing for more stringent regulation for protected bodies of water.[80] Additional regulation may be enacted to limit pollution that comes from non-point sources, such as agriculture.These non-point sources are the reason for the delayed results from the CWA.[81]
The CWA created controversy shortly after its release date in 1972 because speculators questioned whether it was delivering the promised results of cleaner rivers and lakes.[79] Some also questioned whether the benefits of the acts surpassed the price. The United States government has spent over one trillion dollars trying to combat water pollution.[79] This hefty cost was due to the large promises made by the CWA. The goal was to ensure that all of the country's waters were free of pollutants by 1983, only eleven years after the act was passed.[79] Prior to the CWA, most of the waterways in the states were so polluted that they began to ignite flames.[81] However, the state of lakes and rivers all around the country have improved. Between the time frame of 1972 and 2001, there was a 12 percent increase in the number of waterways that are safe for fishing.[79] Although, the data available for review is scarce, since only 19 percent of the United States’ waterways have been tested for contamination.[81]
See also
- Summary information
- Clean Water Act programs
- Clean Water State Revolving Fund (financial assistance program)
- Effluent guidelines (wastewater regulations)
- New Source Performance Standard (wastewater regulations)
- Total maximum daily load (wastewater regulations)
- WaterSense (EPA conservation program)
- Specific topics
- Effects of hydraulic fracturing on water quality in the United States
- Pollution of the Chesapeake Bay
- Great Lakes#Pollution
- Anderson v. Cryovac
- Groundwater contamination from animal agriculture
- General
References
- Water Pollution Control: 25 years of Progress and Challenges for the New Millennium (Report). Washington, D.C.: United States Environmental Protection Agency (EPA). June 1998. EPA 833-F-98-003.
- November 08; Denchak, 2018 Melissa. "Flint Water Crisis: Everything You Need to Know". NRDC. Retrieved 2019-11-04.
- "Deepwater Horizon oil spill | Summary & Facts". Encyclopedia Britannica. Retrieved 2019-11-06.
- Water Pollution Control: 25 years of Progress and Challenges for the New Millennium (Report). Washington, D.C.: United States Environmental Protection Agency (EPA). June 1998. EPA 833-F-98-003.
- "National Summary of State Information". Water Quality Assessment and TMDL Information. EPA. Retrieved 2018-05-21.
- Andreen, William L.; Jones, Shana C. (July 2008). The Clean Water Act: A Blueprint For Reform (PDF) (Report). Edgewater, MD: Center for Progressive Reform. CPR White Paper #802.
- Radcliffe, Heather (September 2015). "Modernization of the Clean Water Act is Long Overdue" (PDF). Lowell, MA: New England Interstate Water Pollution Control Commission.
- May 14; Denchak, 2018 Melissa. "Water Pollution: Everything You Need to Know". NRDC. Retrieved 2019-10-28.
- "Groundwater Pollution". Water Pollution. 2018-09-28. Retrieved 2019-10-31.
- "groundwater contamination". www.groundwater.org. Retrieved 2019-10-28.
- US EPA, OW (2015-09-23). "NPDES Permit Basics". US EPA. Retrieved 2019-11-06.
- US EPA, OW (2015-09-15). "Basic Information about Nonpoint Source (NPS) Pollution". US EPA. Retrieved 2019-11-07.
- "Transboundary Pollution". Safe Drinking Water Foundation. Retrieved 2019-11-07.
- US EPA, OW (2015-10-22). "Municipal Wastewater". US EPA. Retrieved 2019-11-04.
- "How Sewage Pollution Ends Up In Rivers". American Rivers. Retrieved 2019-11-04.
- Metcalf & Eddy, Inc. (1972). Wastewater Engineering. New York: McGraw–Hill. pp. 4–6.
- For example, see the Nationwide Urban Runoff Program (1979-83).
- "Urban Runoff - Beachapedia". www.beachapedia.org. Retrieved 2019-11-04.
- "The Problem: Urban Runoff". Surfrider Foundation. Retrieved 2019-11-04.
- Kirkwood, J.P. (1970) [First published 1876]. A Special Report on the Pollution of River Waters. Annual Report, Massachusetts State Board of Health (Report) (Reprint ed.). New York: Arno Press.
- Leeds, Albert R. (1887-05-01). "The Monstrous Pollution of the Water Supply of Jersey City and Newark". J. Am. Chem. Soc. 9 (5): 81–97. doi:10.1021/ja02128a010.
- Gordon, Robert B. (2001). American Iron, 1607-1900. JHU Press. ISBN 0801868165.
- Mulholland, James A. (1981). History of Metals in Colonial America. University of Alabama Press. ISBN 0817300538.
- Knowles, Anne Kelly (2013). Mastering Iron: The Struggle to Modernize an American Industry, 1800-1868. University of Chicago Press. p. 76. ISBN 978-0226448596.
- Merchant, Carolyn (2007). American Environmental History: An Introduction. Columbia University Press. ISBN 978-0231140355.
- "Industrial Pollution". Greenpeace USA. Retrieved 2019-11-04.
- "Manufacturing & Pollution". smallbusiness.chron.com. Retrieved 2019-11-04.
- "Cleaning Up Power Plant Water Pollution". Earthjustice. 2014-05-14. Retrieved 2019-11-04.
- "Wasting Our Waterways: Toxic Industrial Pollution and the Unfulfilled Promise of the Clean Water Act". environmentamerica.org. Retrieved 2019-11-04.
- "Agriculture: cause and victim of water pollution, but change is possible| Land & Water| Food and Agriculture Organization of the United Nations| Land & Water| Food and Agriculture Organization of the United Nations". www.fao.org. Retrieved 2019-11-04.
- US EPA, OW (2013-03-12). "The Sources and Solutions: Agriculture". US EPA. Retrieved 2019-11-04.
- US EPA, OW (2015-07-07). "Nonpoint Source: Agriculture". US EPA. Retrieved 2019-11-04.
- "Water Pollution Causes | Environmental Pollution Centers". www.environmentalpollutioncenters.org. Retrieved 2019-11-04.
- "Oil Pollution in Water". Water Pollution. 2018-09-28. Retrieved 2019-11-04.
- "Wastewater Treatment Water Use". www.usgs.gov. Retrieved 2019-11-04.
- US EPA, OW (2013-03-12). "The Sources and Solutions: Wastewater". US EPA. Retrieved 2019-11-04.
- "Factsheets | Center for Sustainable Systems". css.umich.edu. Retrieved 2019-11-04.
- US EPA, OW (2016-10-18). "Nutrient Permitting". US EPA. Retrieved 2019-11-04.
- May 14; Denchak, 2018 Melissa. "Water Pollution: Everything You Need to Know". NRDC. Retrieved 2019-11-04.
- Environmental Protection Agency (2005). "Runoff Fact Sheet" (PDF). EPA. Retrieved Nov 4, 2019.
- US EPA, OW. "The Sources and Solutions: Agriculture". 19january2017snapshot.epa.gov. Retrieved 2019-11-04.
- "Solutions for Industrial Corporate Agriculture Pollution in Minnesota's Waters". Clean Water Action. 2018-06-15. Retrieved 2019-11-04.
- "Nonpoint Source Pollution (NPS) Control Program Encyclopedia | California State Water Resources Control Board". www.waterboards.ca.gov. Retrieved 2019-11-04.
- "Erosion Control Practices | Ocean County Soil Conservation District". Retrieved 2019-11-06.
- United States Environmental Protection Agency (Feb 2003). "Protecting Water Quality from Urban Runoff" (PDF). US EPA. Retrieved Nov 4, 2019.
- "Flint Water Crisis Fast Facts". CNN. Retrieved 2019-11-06.
- Ruckart, Perri Zeitz; Ettinger, Adrienne S.; Hanna-Attisha, Mona; Jones, Nicole; Davis, Stephanie I.; Breysse, Patrick N. (January–February 2019). "The Flint Water Crisis: A Coordinated Public Health Emergency Response and Recovery Initiative". Journal of Public Health Management and Practice. 25 Suppl 1, Lead Poisoning Prevention: S84–S90. doi:10.1097/PHH.0000000000000871. ISSN 1550-5022. PMC 6309965. PMID 30507775.
- Winowiecki, Emma. "Does Flint have clean water? Yes, but it's complicated". www.michiganradio.org. Retrieved 2019-11-06.
- Winowiecki, Emma. "How Flint's Legionnaires' disease outbreak led to 5 charges of involuntary manslaughter". www.michiganradio.org. Retrieved 2019-11-06.
- "We Found Dozens of Uncounted Deaths During the Flint Water Crisis. Here's How". pbs.org. Retrieved 2019-11-06.
- flintwaterstudy (2015-09-24). "Pediatric Lead Exposure Presentation from Hurley Medical Center doctors concerning Flint MI". Flint Water Study Updates. Retrieved 2019-11-06.
- US EPA, OW (2016-02-02). "Basic Information about Lead in Drinking Water". US EPA. Retrieved 2019-11-06.
- "Lead poisoning and health". www.who.int. Retrieved 2019-11-06.
- Carmody, Tim (2016-02-26). "How the Flint River got so toxic". The Verge. Retrieved 2019-11-06.
- "Flint's Toxic Industrial Legacy | Columbia University Mailman School of Public Health". www.mailman.columbia.edu. Retrieved 2019-11-06.
- "The Flint Water Crisis - Impact, solutions, and repercussions". Voices of Youth. Retrieved 2019-11-06.
- Cwiek, Sarah. ""Unprecedented" court settlement will "help heal the damage" of Flint water crisis". www.michiganradio.org. Retrieved 2019-11-06.
- Scott, Tyler. "Flint making steady progress toward 2020 pipe replacement goal". www.michiganradio.org. Retrieved 2019-11-06.
- Read "Assessing the Effects of the Gulf of Mexico Oil Spill on Human Health: A Summary of the June 2010 Workshop" at NAP.edu.
- "Gulf Oil Spill". Smithsonian Ocean. Retrieved 2019-11-06.
- McPhee, Rod (2016-09-28). "'I had a death wish for a long time after the rig blew". mirror. Retrieved 2019-11-06.
- Alex. "The Ecologic and Human Impact of the Deepwater Horizon Oil Spill | Sustainable Futures: Honors Academic Writing". Retrieved 2019-11-06.
- Alexander, Melannie; Engel, Lawrence S.; Olaiya, Nathan; Wang, Li; Barrett, John; Weems, Laura; Schwartz, Erica G.; Rusiecki, Jennifer A. (April 2018). "The Deepwater Horizon Oil Spill Coast Guard Cohort Study: A Cross-Sectional Study of Acute Respiratory Health Symptoms". Environmental Research. 162: 196–202. doi:10.1016/j.envres.2017.11.044. ISSN 0013-9351. PMC 5811337. PMID 29331799.
- "Florida Wetlands: Gulf Coast Salt Marshes". soils.ifas.ufl.edu. Retrieved 2019-11-06.
- "Sensitivity of Freshwater Habitats | US Environmental Protection Agency". archive.epa.gov. Retrieved 2019-11-06.
- US Department of Commerce, National Oceanic and Atmospheric Administration. "Deepwater Horizon: Effect on Marine Mammals and Sea Turtles". oceanservice.noaa.gov. Retrieved 2019-11-06.
- "What's the environmental impact of the Deepwater Horizon oil spill?". HowStuffWorks. 2010-06-30. Retrieved 2019-11-06.
- US EPA, OECA (2013-09-12). "Deepwater Horizon – BP Gulf of Mexico Oil Spill". US EPA. Retrieved 2019-11-06.
- Thielen, Amy (2015-06-22). "How BP Won Back Shareholders After the 2010 Gulf Oil Spill". TheStreet. Retrieved 2019-11-06.
- "5 Years After BP Oil Spill, Effects Linger And Recovery Is Slow". NPR.org. Retrieved 2019-11-06.
- "Complaint Filed on Toxic Pollution in Woburn". www.massmoments.org. Retrieved 2019-11-06.
- "2015 Gold King Mine waste water spill (before & after) | Eco Terra Media Group, Inc". www.ecoterramedia.com. Retrieved 2019-11-06.
- "2015 Gold King Mine waste water spill (before & after) | Eco Terra Media Group, Inc". www.ecoterramedia.com. Retrieved 2019-11-06.
- "Chart V. Hydrographs for Seven Principal Rivers of the United States. March, 1899". Monthly Weather Review. 27 (3): c5. March 1899. doi:10.1175/1520-0493(1899)273[c5:cvhfsp]2.0.co;2. ISSN 0027-0644.
- "Environmental Law: Ecology Held Valid Criterion for Denying Dredge and Fill Permit under Section 10, Rivers and Harbors Act of 1899". Duke Law Journal. 1970 (6): 1239–1247. December 1970. doi:10.2307/1371888. ISSN 0012-7086. JSTOR 1371888.
- "Pueblo Lands Act (1924)", Encyclopedia of United States Indian Policy and Law SET, Encyclopedia of United States Indian Policy and Law, CQ Press, 2009, doi:10.4135/9781604265767.n512, ISBN 9781933116983
- US EPA, OA (2013-02-22). "Summary of the Clean Water Act". US EPA. Retrieved 2019-11-04.
- US EPA, OA (2013-02-22). "History of the Clean Water Act". US EPA. Retrieved 2019-11-06.
- Keiser, David (September 7, 2018). "Consequences of the Clean Water Act and the Demand for Water Quality". The Quarterly Journal of Economics. 134: 349–396.
- "Federal Water Pollution Control Act (1972) or the Clean Water Act (CWA) | BOEM". www.boem.gov. Retrieved 2019-11-06.
- Houck, Oliver (2002). The Clean Water Act TMDL Program: Law, Policy, and Implementation. Washington DC: Environmental Law Institute. ISBN 1-58576-038-2.