Water pollution
Water pollution is the contamination of water bodies, usually as a result of human activities. Water bodies include for example lakes, rivers, oceans, aquifers and groundwater. Water pollution results when contaminants are introduced into the natural environment. For example, releasing inadequately treated wastewater into natural water bodies can lead to degradation of aquatic ecosystems. In turn, this can lead to public health problems for people living downstream. They may use the same polluted river water for drinking or bathing or irrigation. Water pollution is the leading worldwide cause of death and disease, e.g. due to water-borne diseases.[1][2]
Water pollution can be classified as surface water or groundwater pollution. Marine pollution and nutrient pollution are subsets of water pollution. Sources of water pollution are either point sources or non-point sources. Point sources have one identifiable cause of the pollution, such as a storm drain or a wastewater treatment plant. Non-point sources are more diffuse, such as agricultural runoff.[3] Pollution is the result of the cumulative effect over time. All plants and organisms living in or being exposed to polluted water bodies can be impacted. The effects can damage individual species and impact the natural biological communities they are part of.
The causes of water pollution include a wide range of chemicals and pathogens as well as physical parameters. Contaminants may include organic and inorganic substances. Elevated temperatures can also lead to polluted water. A common cause of thermal pollution is the use of water as a coolant by power plants and industrial manufacturers. Elevated water temperatures decrease oxygen levels, which can kill fish and alter food chain composition, reduce species biodiversity, and foster invasion by new thermophilic species.[4][5]:375
Water pollution is measured by analysing water samples. Physical, chemical and biological tests can be conducted. Control of water pollution requires appropriate infrastructure and management plans. The infrastructure may include wastewater treatment plants. Sewage treatment plants and industrial wastewater treatment plants are usually required to protect water bodies from untreated wastewater. Agricultural wastewater treatment for farms, and erosion control at construction sites can also help prevent water pollution. Nature-based solutions are another approach to prevent water pollution.[6] Effective control of urban runoff includes reducing speed and quantity of flow. In the United States, best management practices for water pollution include approaches to reduce the quantity of water and improve water quality.[7]
Introduction
Water is typically referred to as polluted when it is impaired by anthropogenic contaminants. Due to these contaminants it either does not support a human use, such as drinking water, or undergoes a marked shift in its ability to support its biotic communities, such as fish. Natural phenomena such as volcanoes, algae blooms, storms, and earthquakes also cause major changes in water quality and the ecological status of water.
Water pollution is a major global problem. It requires ongoing evaluation and revision of water resource policy at all levels (international down to individual aquifers and wells). It has been suggested that water pollution is the leading worldwide cause of death and diseases.[2][1] Water pollution accounted for the deaths of 1.8 million people in 2015.[8]
The organization Global Oceanic Environmental Survey (GOES) consider water pollution as one of the main environmental problems that can present a danger for the existence of life on earth in the next decades. One of the main concerns, is that water pollution, heart phytoplankton who produce 70% of oxygen and remove a large part of carbon dioxide on earth. The organization proposes a number of measures for fixing the situation, but they should be taken in the next 10 years for being effective.[9][10][11]
India and China are two countries with high levels of water pollution. An estimated 580 people in India die of water pollution related illness (including waterborne diseases) every day.[12] About 90 percent of the water in the cities of China is polluted.[13] As of 2007, half a billion Chinese had no access to safe drinking water.[14]
In addition to the acute problems of water pollution in developing countries, developed countries also continue to struggle with pollution problems. For example, in a report on water quality in the United States in 2009, 44 percent of assessed stream miles, 64 percent of assessed lake acres, and 30 percent of assessed bays and estuarine square miles were classified as polluted.[15]
Types
Surface water pollution
| Food Types | Eutrophying Emissions (g PO43-eq per 100g protein) |
|---|---|
| Beef | 365.3 |
| Farmed Fish | 235.1 |
| Farmed Crustaceans | 227.2 |
| Cheese | 98.4 |
| Lamb and Mutton | 97.1 |
| Pork | 76.4 |
| Poultry | 48.7 |
| Eggs | 21.8 |
| Groundnuts | 14.1 |
| Peas | 7.5 |
| Tofu | 6.2 |
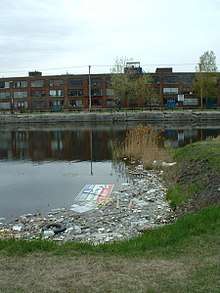
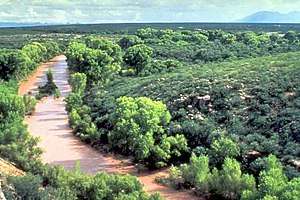
Surface water pollution includes pollution of rivers, lakes and oceans. A subset of surface water pollution is marine pollution.
Marine pollution

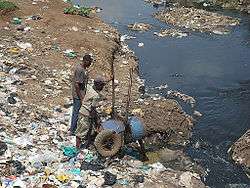
One common path of entry by contaminants to the sea are rivers. An example is directly discharging sewage and industrial waste into the ocean. Pollution such as this occurs particularly in developing nations. In fact, the 10 largest emitters of oceanic plastic pollution worldwide are, from the most to the least, China, Indonesia, Philippines, Vietnam, Sri Lanka, Thailand, Egypt, Malaysia, Nigeria, and Bangladesh,[17] largely through the rivers Yangtze, Indus, Yellow, Hai, Nile, Ganges, Pearl, Amur, Niger, and the Mekong, and accounting for "90 percent of all the plastic that reaches the world's oceans."[18][19]
Large gyres (vortexes) in the oceans trap floating plastic debris. Plastic debris can absorb toxic chemicals from ocean pollution, potentially poisoning any creature that eats it.[20] Many of these long-lasting pieces end up in the stomachs of marine birds and animals. This results in obstruction of digestive pathways, which leads to reduced appetite or even starvation.
There are a variety of secondary effects stemming not from the original pollutant, but a derivative condition. An example is silt-bearing surface runoff, which can inhibit the penetration of sunlight through the water column, hampering photosynthesis in aquatic plants.
Groundwater pollution
Interactions between groundwater and surface water are complex. Consequently, groundwater pollution, also referred to as groundwater contamination, is not as easily classified as surface water pollution.[21] By its very nature, groundwater aquifers are susceptible to contamination from sources that may not directly affect surface water bodies. The distinction of point vs. non-point source may be irrelevant in some situations.
Analysis of groundwater contamination may focus on soil characteristics and site geology, hydrogeology, hydrology, and the nature of the contaminants. Causes of groundwater pollution include: naturally-occurring (geogenic), on-site sanitation systems, sewage, fertilizers and pesticide, commercial and industrial leaks, hydraulic fracturing, landfill leachate.
Categories of pollution sources
Surface water and groundwater have often been studied and managed as separate resources even though they are interrelated.[21] Surface water seeps through the soil and becomes groundwater. Conversely, groundwater can also feed surface water sources. Sources of surface water pollution are generally grouped into two categories based on their origin.
Point sources
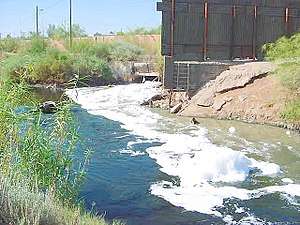
Point source water pollution refers to contaminants that enter a waterway from a single, identifiable source, such as a pipe or ditch. Examples of sources in this category include discharges from a sewage treatment plant, a factory, or a city storm drain.
The U.S. Clean Water Act (CWA) defines point source for regulatory enforcement purposes.[22] The CWA definition of point source was amended in 1987 to include municipal storm sewer systems, as well as industrial storm water, such as from construction sites.[23]
Non-point sources
Nonpoint source pollution refers to diffuse contamination that does not originate from a single discrete source. This type of pollution is often the cumulative effect of small amounts of contaminants gathered from a large area. A common example is the leaching out of nitrogen compounds from fertilized agricultural lands.[3] Nutrient runoff in storm water from "sheet flow" over an agricultural field or a forest are also cited as examples of non-point source pollution.
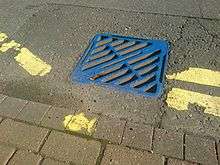
Contaminated storm water washed off of parking lots, roads and highways, called urban runoff, is sometimes included under the category of non-point sources. This runoff becomes a point source because it is typically channeled into storm drain systems and discharged through pipes to local surface waters.
Contaminants and their sources
The specific contaminants leading to pollution in water include a wide spectrum of chemicals, pathogens, and physical changes such as elevated temperature and discoloration. While many of the chemicals and substances that are regulated may be naturally occurring (calcium, sodium, iron, manganese, etc.) the concentration usually determines what is a natural component of water and what is a contaminant. High concentrations of naturally occurring substances can have negative impacts on aquatic flora and fauna.
Oxygen-depleting substances may be natural materials such as plant matter (e.g. leaves and grass) as well as man-made chemicals. Other natural and anthropogenic substances may cause turbidity (cloudiness) which blocks light and disrupts plant growth, and clogs the gills of some fish species.[24]
Alteration of water's physical chemistry includes acidity (change in pH), electrical conductivity, temperature, and eutrophication. Eutrophication is an increase in the concentration of chemical nutrients in an ecosystem to an extent that increases the primary productivity of the ecosystem. Depending on the degree of eutrophication, subsequent negative environmental effects such as anoxia (oxygen depletion) and severe reductions in water quality may occur, affecting fish and other animal populations.
Pathogens

Disease-causing microorganisms are referred to as pathogens. Pathogens can produce waterborne diseases in either human or animal hosts.[25] Coliform bacteria, which are not an actual cause of disease, are commonly used as a bacterial indicator of water pollution. Other microorganisms sometimes found in contaminated surface waters that have caused human health problems include:
- Burkholderia pseudomallei
- Cryptosporidium parvum
- Giardia lamblia
- Salmonella
- Norovirus and other viruses
- Parasitic worms including the Schistosoma type [26][27]
High levels of pathogens may result from on-site sanitation systems (septic tanks, pit latrines) or inadequately treated sewage discharges.[28] Older cities with ageing infrastructure may have leaky sewage collection systems (pipes, pumps, valves), which can cause sanitary sewer overflows. Some cities also have combined sewers, which may discharge untreated sewage during rain storms.[29] Silt (sediment) from sewage discharges also pollutes water bodies.
Pathogen discharges may also be caused by poorly managed livestock operations.
Organic, inorganic and macroscopic contaminants
Contaminants may include organic and inorganic substances. Many of the chemical substances are toxic.[5]:229

Organic water pollutants include:
- Detergents
- Disinfection by-products found in chemically disinfected drinking water, such as chloroform
- Food processing waste, which can include oxygen-demanding substances, fats and grease
- Insecticides and herbicides, a huge range of organohalides and other chemical compounds
- Petroleum hydrocarbons, including fuels (gasoline, diesel fuel, jet fuels, and fuel oil) and lubricants (motor oil), and fuel combustion byproducts, from storm water runoff[30]
- Volatile organic compounds, such as industrial solvents, from improper storage.
- Chlorinated solvents, which are dense non-aqueous phase liquids, may fall to the bottom of reservoirs, since they don't mix well with water and are denser.
- Perchlorate
- Various chemical compounds found in personal hygiene and cosmetic products
- Drug pollution involving pharmaceutical drugs and their metabolites, this can include antidepressant drugs or hormonal medicines such as contraceptive pills. These molecules can be small and difficult for treatment plants to remove without expensive upgrades.[31]
Inorganic water pollutants include:
- Acidity caused by industrial discharges (especially sulfur dioxide from power plants)
- Ammonia from food processing waste
- Chemical waste as industrial by-products
- Fertilizers containing nutrients--nitrates and phosphates—which are found in storm water runoff from agriculture, as well as commercial and residential use[30] (see nutrient pollution)
- Heavy metals from motor vehicles (via urban storm water runoff)[30][32] and acid mine drainage
- Secretion of creosote preservative into the aquatic ecosystem
- Silt (sediment) in runoff from construction sites, logging, slash and burn practices or land clearing sites.
Macroscopic pollution – large visible items polluting the water – may be termed "floatables" in an urban storm water context, or marine debris when found on the open seas, and can include such items as:
- Trash or garbage (e.g. paper, plastic, or food waste) discarded by people on the ground, along with accidental or intentional dumping of rubbish, that are washed by rainfall into storm drains and eventually discharged into surface waters.
- Nurdles, small ubiquitous waterborne plastic pellets. See plastic pollution and microplastic pollution.
- Shipwrecks, large derelict ships.
Change in temperature
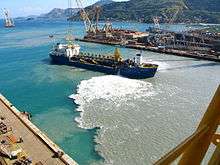
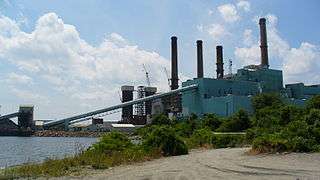
Thermal pollution is the rise or fall in the temperature of a natural body of water caused by human influence. Thermal pollution, unlike chemical pollution, results in a change in the physical properties of water. A common cause of thermal pollution is the use of water as a coolant by power plants and industrial manufacturers. Elevated water temperatures decrease oxygen levels, which can kill fish and alter food chain composition, reduce species biodiversity, and foster invasion by new thermophilic species.[4][33][5]:375 Urban runoff may also elevate temperature in surface waters.[34]
Thermal pollution can also be caused by the release of very cold water from the base of reservoirs into warmer rivers.
Measurement
Water pollution may be analyzed through several broad categories of methods: physical, chemical and biological. Most involve collection of samples, followed by specialized analytical tests. Some methods may be conducted in situ, without sampling, such as temperature. Government agencies and research organizations have published standardized, validated analytical test methods to facilitate the comparability of results from disparate testing events.[35]
Sampling
Sampling of water for physical or chemical testing can be done by several methods, depending on the accuracy needed and the characteristics of the contaminant. Many contamination events are sharply restricted in time, most commonly in association with rain events. For this reason "grab" samples are often inadequate for fully quantifying contaminant levels. Scientists gathering this type of data often employ auto-sampler devices that pump increments of water at either time or discharge intervals.
Sampling for biological testing involves collection of plants and animals from the surface water body. Depending on the type of assessment, the organisms may be identified for biosurveys (population counts) and returned to the water body, or they may be dissected for bioassays to determine toxicity.
Physical testing
Common physical tests of water include temperature, solids concentrations (e.g., total suspended solids (TSS)) and turbidity.
Chemical testing
Water samples may be examined using the principles of analytical chemistry. Many published test methods are available for both organic and inorganic compounds. Frequently used methods include pH, biochemical oxygen demand (BOD),[36]:102 chemical oxygen demand (COD),[36]:104 nutrients (nitrate and phosphorus compounds), metals (including copper, zinc, cadmium, lead and mercury), oil and grease, total petroleum hydrocarbons (TPH), and pesticides.
Biological testing
Biological testing involves the use of plant, animal or microbial indicators to monitor the health of an aquatic ecosystem. They are any biological species or group of species whose function, population, or status can reveal what degree of ecosystem or environmental integrity is present.[37] One example of a group of bio-indicators are the copepods and other small water crustaceans that are present in many water bodies. Such organisms can be monitored for changes (biochemical, physiological, or behavioral) that may indicate a problem within their ecosystem.
Control of pollution
Municipal wastewater treatment
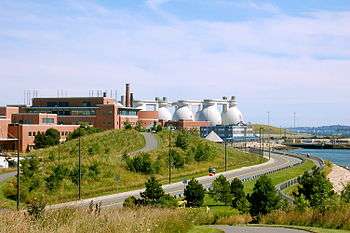
In urban areas of developed countries, municipal wastewater (or sewage) is typically treated by centralized sewage treatment plants. Well-designed and operated systems (i.e., with secondary treatment steps or more advanced treatment) can remove 90 percent or more of the pollutant load in sewage.[38] Some plants have additional systems to remove nutrients and pathogens, but these more advanced treatment steps get progressively more expensive.
Nature-based solutions are also being used instead of (or in combination with) centralized treatment plants.[6]
Cities with sanitary sewer overflows or combined sewer overflows employ one or more engineering approaches to reduce discharges of untreated sewage, including:
- utilizing a green infrastructure approach to improve storm water management capacity throughout the system, and reduce the hydraulic overloading of the treatment plant[39]
- repair and replacement of leaking and malfunctioning equipment[29]
- increasing overall hydraulic capacity of the sewage collection system (often a very expensive option).
On-site sanitation and safely managed sanitation
Households or businesses not served by a municipal treatment plant may have an individual septic tank, which pre-treats the wastewater on site and infiltrates it into the soil. This can lead to groundwater pollution if not properly done.
Globally, about 4.5 billion people currently (in 2017) do not have safely managed sanitation, according to an estimate by the Joint Monitoring Programme for Water Supply and Sanitation.[40] Lack of access to sanitation often leads to water pollution, e.g. via the practice of open defecation: during rain events or floods, the human feces are moved from the ground where they were deposited into surface waters. Simple pit latrines may also get flooded during rain events. The use of safely managed sanitation services would prevent this type of water pollution.[40]
Industrial wastewater treatment
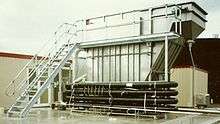
Some industrial facilities generate wastewater that is similar to domestic sewage and can be treated by sewage treatment plants. Industries that generate wastewater with high concentrations of organic matter (e.g. oil and grease), toxic pollutants (e.g. heavy metals, volatile organic compounds) or nutrients such as ammonia, need specialized treatment systems.[41]:Ch. 16 Some industries install a pre-treatment system to remove some pollutants (e.g., toxic compounds), and then discharge the partially treated wastewater to the municipal sewer system.[42][43]:Ch. 1 Industries generating large volumes of wastewater typically operate their own treatment systems. Some industries have been successful at redesigning their manufacturing processes to reduce or eliminate pollutants, through a process called pollution prevention.
To remove heat from wastewater generated by power plants or manufacturing plants the following technologies are used:
- cooling ponds, man-made bodies of water designed for cooling by evaporation, convection, and radiation
- cooling towers, which transfer waste heat to the atmosphere through evaporation or heat transfer
- cogeneration, a process where waste heat is recycled for domestic or industrial heating purposes.[44]
Agricultural wastewater treatment
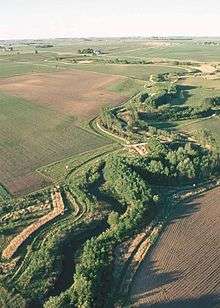
Non point source controls
Sediment (loose soil) washed off fields is the largest source of agricultural pollution in the United States.[24] Farmers may utilize erosion controls to reduce runoff flows and retain soil on their fields. Common techniques include contour plowing, crop mulching, crop rotation, planting perennial crops and installing riparian buffers.[45][46]:pp. 4-95–4-96
Nutrients (nitrogen and phosphorus) are typically applied to farmland as commercial fertilizer, animal manure, or spraying of municipal or industrial wastewater (effluent) or sludge. Nutrients may also enter runoff from crop residues, irrigation water, wildlife, and atmospheric deposition.[46]:p. 2–9 Farmers can develop and implement nutrient management plans to reduce excess application of nutrients[45][46]:pp. 4-37–4-38 and reduce the potential for nutrient pollution.
To minimize pesticide impacts, farmers may use Integrated Pest Management (IPM) techniques (which can include biological pest control) to maintain control over pests, reduce reliance on chemical pesticides, and protect water quality.[47]
Point source wastewater treatment
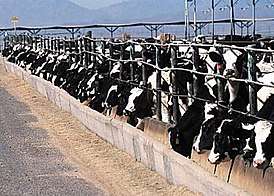
Farms with large livestock and poultry operations, such as factory farms, are called concentrated animal feeding operations or feedlots in the US and are being subject to increasing government regulation.[48][49] Animal slurries are usually treated by containment in anaerobic lagoons before disposal by spray or trickle application to grassland. Constructed wetlands are sometimes used to facilitate treatment of animal wastes. Some animal slurries are treated by mixing with straw and composted at high temperature to produce a bacteriologically sterile and friable manure for soil improvement.
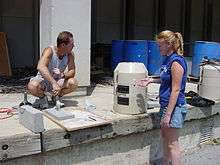
Erosion and sediment control from construction sites
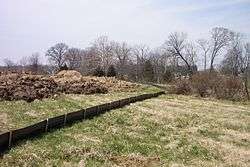
Sediment from construction sites is managed by installation of:
- erosion controls, such as mulching and hydroseeding, and
- sediment controls, such as sediment basins and silt fences.[50]
Discharge of toxic chemicals such as motor fuels and concrete washout is prevented by use of:
- spill prevention and control plans, and
- specially designed containers (e.g. for concrete washout) and structures such as overflow controls and diversion berms.[51]
Control of urban runoff (storm water)
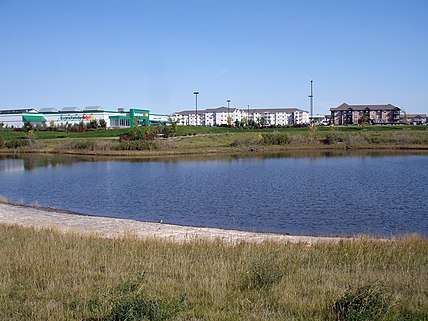
Effective control of urban runoff involves reducing the velocity and flow of storm water, as well as reducing pollutant discharges. Local governments use a variety of storm water management techniques to reduce the effects of urban runoff. These techniques, called best management practices for water pollution (BMPs) in the U.S., may focus on water quantity control, while others focus on improving water quality, and some perform both functions.[7]
Pollution prevention practices include low-impact development techniques, installation of green roofs and improved chemical handling (e.g. management of motor fuels & oil, fertilizers and pesticides).[52] Runoff mitigation systems include infiltration basins, bioretention systems, constructed wetlands, retention basins and similar devices.[53][54]
Thermal pollution from runoff can be controlled by storm water management facilities that absorb the runoff or direct it into groundwater, such as bioretention systems and infiltration basins. Retention basins tend to be less effective at reducing temperature, as the water may be heated by the sun before being discharged to a receiving stream.[7]:p. 5–58
By country
See also
- Water treatment
- Aquatic toxicology
- Environmental impact of pesticides § Water
- Intake fraction
- Pollution
- Trophic state index (water quality indicator for lakes)
References
- West, Larry (March 26, 2006). "World Water Day: A Billion People Worldwide Lack Safe Drinking Water". About.com.
- Pink, Daniel H. (April 19, 2006). "Investing in Tomorrow's Liquid Gold". Yahoo. Archived from the original on April 23, 2006.
- Moss, Brian (2008). "Water Pollution by Agriculture". Phil. Trans. R. Soc. Lond. B. 363: 659–666. doi:10.1098/rstb.2007.2176. PMC 2610176. PMID 17666391.
- Goel, P.K. (2006). Water Pollution - Causes, Effects and Control. New Delhi: New Age International. p. 179. ISBN 978-81-224-1839-2.
- Laws, Edward A. (2018). Aquatic Pollution: An Introductory Text (4th ed.). Hoboken, NJ: John Wiley & Sons. ISBN 9781119304500.
- UN-Water (2018) World Water Development Report 2018: Nature-based Solutions for Water, Geneva, Switzerland
- "Ch. 5: Description and Performance of Storm Water Best Management Practices". Preliminary Data Summary of Urban Storm Water Best Management Practices (Report). Washington, DC: United States Environmental Protection Agency (EPA). August 1999. EPA-821-R-99-012.
- Kelland, Kate (October 19, 2017). "Study links pollution to millions of deaths worldwide". Reuters.
- "Goes Foundation Home". Global Oceanic Environmemtal Survey. Retrieved September 1, 2019.
- "Resources". GOES Foundation. Retrieved September 10, 2019.
- Dryden, Howard. "We have 10 years to save the seas". Global Oceanic Environmental Survey. Retrieved September 1, 2019.
- "An overview of diarrhea, symptoms, diagnosis and the costs of morbidity" (PDF). CHNRI. 2010. Archived from the original (PDF) on May 12, 2013.
- "China says water pollution so severe that cities could lack safe supplies". Chinadaily.com.cn. June 7, 2005.
- Kahn, Joseph; Yardley, Jim (August 26, 2007). "As China Roars, Pollution Reaches Deadly Extremes". New York Times.
- Fact Sheet: 2004 National Water Quality Inventory Report to Congress (Report). EPA. January 2009. EPA 841-F-08-003.
- Nemecek, T.; Poore, J. (June 1, 2018). "Reducing food's environmental impacts through producers and consumers". Science. 360 (6392): 987–992. Bibcode:2018Sci...360..987P. doi:10.1126/science.aaq0216. ISSN 0036-8075. PMID 29853680.
- Jambeck, Jenna R.; Geyer, Roland; Wilcox, Chris (February 12, 2015). "Plastic waste inputs from land into the ocean" (PDF). Science. 347 (6223): 769. Bibcode:2015Sci...347..768J. doi:10.1126/science.1260352. PMID 25678662. Retrieved August 28, 2018.
- Christian Schmidt; Tobias Krauth; Stephan Wagner (October 11, 2017). "Export of Plastic Debris by Rivers into the Sea". Environmental Science & Technology. 51 (21): 12246–12253. Bibcode:2017EnST...5112246S. doi:10.1021/acs.est.7b02368. PMID 29019247.
The 10 top-ranked rivers transport 88–95% of the global load into the sea
- Harald Franzen (November 30, 2017). "Almost all plastic in the ocean comes from just 10 rivers". Deutsche Welle. Retrieved December 18, 2018.
It turns out that about 90 percent of all the plastic that reaches the world's oceans gets flushed through just 10 rivers: The Yangtze, the Indus, Yellow River, Hai River, the Nile, the Ganges, Pearl River, Amur River, the Niger, and the Mekong (in that order).
- Zaikab, Gwyneth Dickey (March 28, 2011). "Marine microbes digest plastic". Nature. doi:10.1038/news.2011.191. ISSN 0028-0836.
- Ground Water and Surface Water: A Single Resource (Report). Denver, CO: United States Geological Survey (USGS). 1998. Circular 1139.
- United States. Clean Water Act (CWA), section 502(14), 33 U.S.C. § 1362 (14).
- U.S. CWA section 402(p), 33 U.S.C. § 1342(p)
- EPA. "Protecting Water Quality from Agricultural Runoff." Fact Sheet No. EPA-841-F-05-001. March 2005.
- Harrison, Roy M., ed. (2001). Pollution: Causes, Effects and Control (4th ed.). Cambridge, UK: Royal Society of Chemistry. p. 60. ISBN 0-85404-621-6.
- USGS. Reston, VA. "A Primer on Water Quality." FS-027-01. March 2001.
- Schueler, Thomas R. "Microbes and Urban Watersheds: Concentrations, Sources, & Pathways." Reprinted in The Practice of Watershed Protection. Archived January 8, 2013, at the Wayback Machine 2000. Center for Watershed Protection. Ellicott City, MD.
- EPA. “Illness Related to Sewage in Water.” Accessed February 20, 2009. Archived April 27, 2006, at the Wayback Machine
- EPA. "Report to Congress: Impacts and Control of CSOs and SSOs." August 2004. Document No. EPA-833-R-04-001.
- G. Allen Burton, Jr., Robert Pitt (2001). Stormwater Effects Handbook: A Toolbox for Watershed Managers, Scientists, and Engineers. New York: CRC/Lewis Publishers. ISBN 0-87371-924-7.CS1 maint: uses authors parameter (link) Chapter 2.
- "Antidepressants are finding their way into fish brains". The Economist. Retrieved March 18, 2018.
- Schueler, Thomas R. "Cars Are Leading Source of Metal Loads in California." Reprinted in The Practice of Watershed Protection. Archived March 12, 2012, at the Wayback Machine 2000. Center for Watershed Protection. Ellicott City, MD.
- Kennish, Michael J. (1992). Ecology of Estuaries: Anthropogenic Effects. Marine Science Series. Boca Raton, FL: CRC Press. pp. 415–17. ISBN 978-0-8493-8041-9.
- "Protecting Water Quality from Urban Runoff". Washington, D.C.: U.S. Environmental Protection Agency (EPA). February 2003. Fact Sheet. EPA 841-F-03-003.
- For example, see Baird, Rodger B.; Clesceri, Leonore S.; Eaton, Andrew D.; et al., eds. (2012). Standard Methods for the Examination of Water and Wastewater (22nd ed.). Washington, DC: American Public Health Association. ISBN 978-0875530130.
- Newton, David (2008). Chemistry of the Environment. Checkmark Books. ISBN 0-8160-7747-9.
- Karr, James R. (1981). "Assessment of biotic integrity using fish communities". Fisheries. 6: 21–27. doi:10.1577/1548-8446(1981)006<0021:AOBIUF>2.0.CO;2. ISSN 1548-8446.
- Primer for Municipal Wastewater Treatment Systems (Report). EPA. 2004. p. 11. EPA 832-R-04-001.
- "Case Study: Philadelphia, Pennsylvania". Green Infrastructure Case Studies (Report). EPA. August 2010. pp. 49–51. EPA-841-F-10-004.
- WHO and UNICEF (2017) Progress on Drinking Water, Sanitation and Hygiene: 2017 Update and SDG Baselines. Geneva: World Health Organization (WHO) and the United Nations Children’s Fund (UNICEF), 2017
- Metcalf & Eddy, Inc. (1972). Wastewater Engineering. New York: McGraw-Hill.
- Drinan, Joanne E.; Spellman, Frank (2015). Water and Wastewater Treatment: A Guide for the Nonengineering Professional (2nd ed.). CRC Press. p. 140. ISBN 1498761372.
- Introduction to the National Pretreatment Program (Report). EPA. June 2011. 833-B-11-001.
- Profile of the Fossil Fuel Electric Power Generation Industry (Report). EPA. September 1997. p. 24. EPA/310-R-97-007.
- U.S. Natural Resources Conservation Service (NRCS). Washington, DC. "National Conservation Practice Standards." National Handbook of Conservation Practices. Accessed 2015-10-02.
- National Management Measures to Control Nonpoint Source Pollution from Agriculture (Report). EPA. July 2003. EPA-841-B-03-004.
- "Integrated Pest Management Principles". Pest Control and Pesticide Safety for Consumers. EPA. June 27, 2017.
- "Animal Feeding Operations". National Pollutant Discharge Elimination System. EPA. September 20, 2018.
- Iowa Department of Natural Resources. Des Moines, IA. "Animal Feeding Operations in Iowa." Accessed March 5, 2009.
- Tennessee Department of Environment and Conservation. Nashville, TN (2012). "Tennessee Erosion and Sediment Control Handbook."
- Concrete Washout (Report). Stormwater Best Management Practice. EPA. February 2012. BMP fact sheet. EPA 833-F-11-006.
- "Low Impact Development and Other Green Design Strategies". National Pollutant Discharge Elimination System. EPA. 2014. Archived from the original on February 19, 2015.
- California Stormwater Quality Association. Menlo Park, CA. "Municipal BMP Handbook." 2003.
- New Jersey Department of Environmental Protection. Trenton, NJ. "New Jersey Stormwater Best Management Practices Manual." April 2004.
External links
| Wikimedia Commons has media related to Water pollution. |
| Library resources about Water pollution |
- Water Quality: A Half Century of Progress, a report by the EPA Alumni Association
- "Troubled Waters" - video from "Strange Days on Planet Earth" by National Geographic & PBS (US)
- EUGRIS – portal for Soil and Water Management in Europe
- Causal Analysis/Diagnosis Decision Information System (CADDIS) - EPA guide for identifying pollution problems; stressor identification
| Overviews | Water droplet | |
|---|---|---|
| States | ||
| Forms | ||
| On Earth | ||
| ||
| Air |
|  | ||||
|---|---|---|---|---|---|---|
| Energy | ||||||
| Land | ||||||
| Life |
| |||||
| Water |
| |||||
| Related |
| |||||
| ||||||
| Authority control |
|
|---|