Wards of Glasgow
The City of Glasgow is divided into a number of wards. These electoral districts, as they are also known, are used to elect councillors to Glasgow City Council. The council, composed of the elected members from each ward, provides local government services to the City of Glasgow.
Wards of Glasgow | |
|---|---|
 This is the coat of arms for the City of Glasgow Corporation. Two bodies have followed the Corporation and used their own version of the city coat of arms: The City Of Glasgow District Council and the current local authority, the City Of Glasgow Council / Glasgow City Council. | |
| Country | Scotland |
| City | Glasgow |
| Council | Glasgow City Council |
| Area | |
| • Total | 176 km2 (68 sq mi) |
| Population 2015[2] | |
| • Total | 606,340 |
| • Density | 3,400/km2 (8,900/sq mi) |
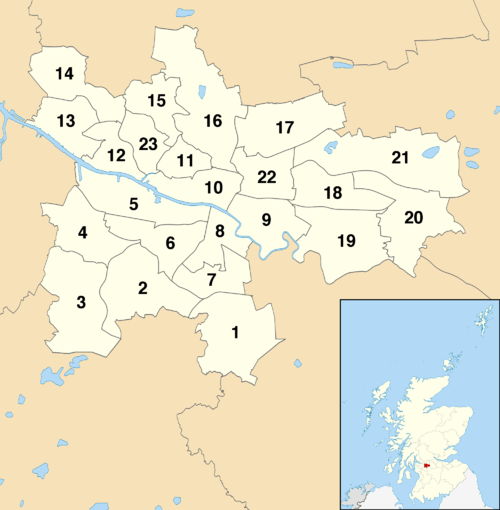
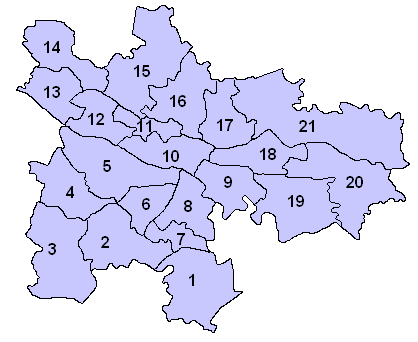
There are 23 wards situated within the perimeters of Glasgow City Council. Each one elects 3 or 4 councillors every five years in the Scottish local council elections. The most recent elections were held in 2017.
Glasgow City Council is one of the 32 council areas for Scotland (each council containing a number of wards). The boundaries for all Scottish council areas and their sub divisional wards are regulated and regularly reviewed by the Local Government Boundary Commission for Scotland.
Map
The following is a map of the current party representation for each ward, shown within the area served by Glasgow City Council.
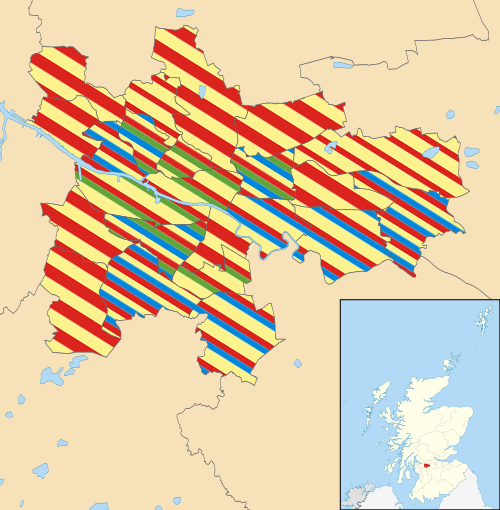
| Party colour | Party name |
| Conservative | |
| Scottish Green | |
| Labour | |
| Scottish National Party | |
List of Wards (2017)
The following is a list of each Glasgow ward and its population data.
| Ward Number | Ward Name | Location with respect to the River Clyde |
Area [3] (km2) |
Population [4] (2015 estimate) |
Density (inhabitants/km2) |
Seats |
|---|---|---|---|---|---|---|
| 1. | Linn | South | 11.10 | 29,575 | 2,664 | 4 |
| 2. | Newlands/Auldburn | South | 9.93 | 23,144 | 2,330 | 3 |
| 3. | Greater Pollok | South | 11.70 | 30,729 | 2,626 | 4 |
| 4. | Cardonald | South | 7.27 | 29,639 | 4,076 | 4 |
| 5. | Govan | South | 8.26 | 26,769 | 3,240 | 4 |
| 6. | Pollokshields | South | 6.29 | 27,983 | 4,448 | 3 |
| 7. | Langside | South | 4.67 | 29,060 | 6,222 | 4 |
| 8. | Southside Central | South | 4.29 | 25,266 | 5,889 | 4 |
| 9. | Calton | North | 6.38 | 27,460 | 4,304 | 4 |
| 10. | Anderston/City/Yorkhill | North | 5.75 | 30,184 | 5,249 | 4 |
| 11. | Hillhead | North | 2.92 | 25,411 | 8,702 | 3 |
| 12. | Victoria Park | North | 4.41 | 20,950 | 4,750 | 3 |
| 13. | Garscadden/Scotstounhill | North | 5.94 | 30,565 | 5,145 | 4 |
| 14. | Drumchapel/Anniesland | North | 7.30 | 29,432 | 4,031 | 4 |
| 15. | Maryhill | North | 4.99 | 22,244 | 4,457 | 3 |
| 16. | Canal | North | 14.40 | 25,000 | 1,736 | 4 |
| 17. | Springburn/Robroyston | North | 9.50 | 27,237 | 2,867 | 4 |
| 18. | East Centre | North | 6.36 | 27,991 | 4,401 | 4 |
| 19. | Shettleston | North | 10.40 | 25,806 | 2,481 | 4 |
| 20. | Baillieston | North | 10.10 | 21,663 | 2,144 | 3 |
| 21. | North East | North | 14.90 | 20,457 | 1,372 | 3 |
| 22. | Dennistoun | North | 5.21 | 20,861 | 4,004 | 3 |
| 23. | Partick East/Kelvindale | North | 3.91 | 28,914 | 7,394 | 4 |
| Σ | Total (Glasgow City) | N/A | 175.98 | 606,340 | 3,445 | 85 |
Statistical data by ward
Ethnicity
Arranged into 2017 wards, from 2015 calculations based on the 2011 census.
Totals
| Ward Name | White | MIX | Asian | Black | OTH | Total | ||||||
|---|---|---|---|---|---|---|---|---|---|---|---|---|
| SC/BR | IRE | OTW | IND | PAK | CHN | OTA | AFR | CAR | ||||
| 1. Linn[5] | 27,040 | 841 | 586 | 70 | 144 | 605 | 106 | 74 | 278 | 52 | 54 | 29,850 |
| 2. Newlands/Auldburn[6] | 18,874 | 408 | 1,084 | 132 | 300 | 1,532 | 207 | 253 | 619 | 84 | 122 | 23,615 |
| 3. Greater Pollok[7] | 25,680 | 368 | 351 | 93 | 436 | 1,939 | 411 | 155 | 229 | 84 | 77 | 29,820 |
| 4. Cardonald[8] | 27,566 | 451 | 497 | 96 | 386 | 582 | 116 | 169 | 376 | 30 | 130 | 30,402 |
| 5. Govan[9] | 19,150 | 370 | 1,434 | 110 | 813 | 1,238 | 315 | 349 | 858 | 90 | 173 | 24,900 |
| 6. Pollokshields[10] | 17,929 | 523 | 908 | 209 | 905 | 6,040 | 231 | 343 | 496 | 90 | 239 | 27,913 |
| 7. Langside[11] | 24,005 | 1,106 | 861 | 161 | 250 | 1,237 | 203 | 209 | 301 | 87 | 112 | 28,532 |
| 8. Southside Central[12] | 15,806 | 845 | 1,409 | 171 | 568 | 3,391 | 284 | 645 | 721 | 111 | 261 | 24,212 |
| 9. Calton[13] | 19,878 | 370 | 1,682 | 83 | 354 | 212 | 509 | 229 | 784 | 96 | 169 | 24,366 |
| 10. Anderston/City/Yorkhill[14] | 17,312 | 782 | 2,405 | 274 | 1,166 | 761 | 2,336 | 623 | 634 | 132 | 559 | 26,984 |
| 11. Hillhead[15] | 16,706 | 717 | 1,948 | 284 | 564 | 1,472 | 1,185 | 437 | 438 | 76 | 395 | 24,222 |
| 12. Victoria Park[16] | 17,267 | 416 | 754 | 147 | 334 | 346 | 367 | 194 | 167 | 40 | 107 | 20,139 |
| 13. Garscadden/Scotstounhill[17] | 26,217 | 304 | 1,175 | 125 | 239 | 527 | 326 | 416 | 1,121 | 166 | 239 | 30,855 |
| 14. Drumchapel/Anniesland[18] | 26,743 | 362 | 630 | 95 | 218 | 311 | 242 | 205 | 434 | 84 | 97 | 29,421 |
| 15. Maryhill[19] | 18,021 | 371 | 791 | 121 | 227 | 226 | 434 | 144 | 539 | 101 | 61 | 21,036 |
| 16. Canal[20] | 22,190 | 284 | 670 | 86 | 135 | 252 | 470 | 156 | 591 | 44 | 134 | 25,012 |
| 17. Springburn/Robroyston[21] | 23,596 | 373 | 423 | 77 | 283 | 359 | 763 | 360 | 1,098 | 92 | 191 | 27,615 |
| 18. East Centre[22] | 25,586 | 321 | 827 | 38 | 115 | 125 | 153 | 119 | 226 | 56 | 56 | 27,622 |
| 19. Shettleston[23] | 23,783 | 262 | 881 | 42 | 99 | 161 | 157 | 72 | 229 | 18 | 66 | 25,770 |
| 20. Baillieston[24] | 20,064 | 345 | 214 | 32 | 80 | 180 | 204 | 66 | 90 | 23 | 23 | 21,321 |
| 21. North East[25] | 18,177 | 165 | 442 | 34 | 124 | 114 | 203 | 46 | 266 | 48 | 25 | 19,644 |
| 22. Dennistoun[26] | 16,374 | 486 | 1,181 | 95 | 317 | 303 | 660 | 442 | 1,741 | 103 | 305 | 22,007 |
| 23. Partick East/Kelvindale[27] | 22,431 | 758 | 1,785 | 304 | 583 | 492 | 807 | 318 | 204 | 99 | 206 | 27,987 |
| Total (Glasgow City) | 490,395 | 11,228 | 22,938 | 2,879 | 8,640 | 22,405 | 10,689 | 6,024 | 12,440 | 1,806 | 3,801 | 593,245 |
Percentages
| Ward Name | White | MIX | Asian | Black | OTH | ||||||
|---|---|---|---|---|---|---|---|---|---|---|---|
| SC/BR | IRE | OTW | IND | PAK | CHN | OTA | AFR | CAR | |||
| 1. Linn[5] | 90.6 | 2.8 | 1.9 | 0.2 | 0.5 | 2.0 | 0.3 | 0.2 | 0.9 | 0.2 | 0.2 |
| 2. Newlands/Auldburn[6] | 80.0 | 1.7 | 5.0 | 0.6 | 1.3 | 6.5 | 0.9 | 0.1 | 2.6 | 0.3 | 0.5 |
| 3. Greater Pollok[7] | 86.1 | 1.2 | 1.2 | 0.3 | 1.5 | 6.5 | 1.4 | 0.5 | 0.8 | 0.3 | 0.2 |
| 4. Cardonald[8] | 90.7 | 1.5 | 1.6 | 0.3 | 1.3 | 1.9 | 0.4 | 0.5 | 1.2 | 0.1 | 0.4 |
| 5. Govan[9] | 80.0 | 1.5 | 5.8 | 0.4 | 3.3 | 5.0 | 1.3 | 1.4 | 3.4 | 0.4 | 0.7 |
| 6. Pollokshields[10] | 64.2 | 1.9 | 3.2 | 0.7 | 3.2 | 21.6 | 0.8 | 1.2 | 1.8 | 0.3 | 0.9 |
| 7. Langside[11] | 84.1 | 3.9 | 3.0 | 0.6 | 0.9 | 4.3 | 0.7 | 0.7 | 1.0 | 0.3 | 0.4 |
| 8. Southside Central[12] | 65.3 | 3.5 | 5.8 | 0.7 | 2.3 | 14.0 | 1.2 | 2.7 | 3.0 | 0.4 | 1.1 |
| 9. Calton[13] | 81.6 | 1.5 | 6.9 | 0.3 | 1.4 | 0.9 | 2.1 | 0.9 | 3.2 | 0.4 | 0.7 |
| 10. Anderston/City/Yorkhill[14] | 64.1 | 2.9 | 8.9 | 1.0 | 4.3 | 2.8 | 8.7 | 2.3 | 2.3 | 0.5 | 2.1 |
| 11. Hillhead[15] | 69.0 | 3.0 | 8.0 | 1.2 | 2.3 | 6.1 | 4.9 | 1.8 | 1.8 | 0.3 | 1.6 |
| 12. Victoria Park[16] | 85.7 | 2.1 | 3.7 | 0.7 | 1.6 | 1.71 | 1.8 | 1.0 | 0.8 | 0.2 | 0.5 |
| 13. Garscadden/Scotstounhill[17] | 85.0 | 1.0 | 3.8 | 0.4 | 0.7 | 1.7 | 1.0 | 1.3 | 3.6 | 0.5 | 0.7 |
| 14. Drumchapel/Anniesland[18] | 90.1 | 1.2 | 2.1 | 0.3 | 0.7 | 1.1 | 0.8 | 0.7 | 1.5 | 0.3 | 0.3 |
| 15. Maryhill[19] | 85.7 | 1.8 | 3.8 | 0.6 | 1.1 | 1.1 | 2.1 | 0.7 | 2.6 | 0.5 | 0.3 |
| 16. Canal[20] | 88.7 | 1.1 | 2.7 | 0.3 | 0.5 | 1.0 | 1.9 | 0.6 | 2.4 | 0.2 | 0.5 |
| 17. Springburn/Robroyston[21] | 85.4 | 1.3 | 1.5 | 0.3 | 1.0 | 1.3 | 2.8 | 1.3 | 4.0 | 0.3 | 0.7 |
| 18. East Centre[22] | 92.7 | 1.2 | 3.0 | 0.1 | 0.4 | 0.4 | 0.5 | 0.4 | 0.8 | 0.2 | 0.2 |
| 19. Shettleston[23] | 92.3 | 1.0 | 3.4 | 0.2 | 0.4 | 0.6 | 0.6 | 0.3 | 0.9 | 0.1 | 0.3 |
| 20. Baillieston[24] | 94.1 | 1.6 | 1.0 | 0.1 | 0.4 | 0.8 | 1.0 | 0.3 | 0.4 | 0.1 | 0.1 |
| 21. North East[25] | 92.5 | 0.8 | 2.2 | 0.2 | 0.6 | 0.6 | 1.0 | 0.2 | 1.3 | 0.2 | 0.1 |
| 22. Dennistoun[26] | 74.4 | 2.2 | 5.4 | 0.4 | 1.4 | 1.4 | 3.0 | 2.0 | 7.9 | 0.5 | 1.4 |
| 23. Partick East/Kelvindale[27] | 80.1 | 2.7 | 6.8 | 1.1 | 2.1 | 1.8 | 2.9 | 1.1 | 0.7 | 0.3 | 0.7 |
| Total (Glasgow City) | 82.7% | 1.9% | 3.9% | 0.5% | 1.5% | 3.8% | 1.8% | 1.0% | 2.1% | 0.3% | 0.6% |
Households
Arranged into 2017 wards, based on the 2011 census.
Totals
| Ward Name | HHOLDS | SIZE | Household type | ||||||
|---|---|---|---|---|---|---|---|---|---|
| SP<65 | SP>65 | MOSTU | MO>65 | MOOTH | CHSPA | CHOTH | |||
| 1. Linn[5] | 13,432 | 2.21 | 3,128 | 1,768 | 33 | 704 | 3,903 | 1,643 | 2,253 |
| 2. Newlands/Auldburn[6] | 10,922 | 2.16 | 2,748 | 1,688 | 41 | 611 | 2,825 | 1,144 | 1,865 |
| 3. Greater Pollok[7] | 12,115 | 2.42 | 2,310 | 1,394 | 71 | 513 | 3,624 | 1,401 | 2,802 |
| 4. Cardonald[8] | 13,680 | 2.21 | 2,839 | 2,310 | 27 | 837 | 3,798 | 1,541 | 2,328 |
| 5. Govan[9] | 12,890 | 1.87 | 4,935 | 1,388 | 311 | 341 | 3,407 | 1,143 | 1,365 |
| 6. Pollokshields[10] | 12,728 | 2.17 | 3,728 | 1,636 | 113 | 599 | 3,795 | 643 | 2,214 |
| 7. Langside[11] | 15,125 | 1.88 | 5,442 | 1,821 | 38 | 586 | 4,552 | 905 | 1,781 |
| 8. Southside Central[12] | 12,815 | 1.86 | 5,129 | 1,571 | 190 | 370 | 3,182 | 920 | 1,453 |
| 9. Calton[13] | 12,919 | 1.80 | 4,839 | 1,613 | 535 | 343 | 3,167 | 1,362 | 1,060 |
| 10. Anderston/City/Yorkhill[14] | 13,042 | 1.70 | 5,862 | 1,025 | 1,492 | 182 | 3,391 | 381 | 709 |
| 11. Hillhead[15] | 11,474 | 1.97 | 3,844 | 1,057 | 1,548 | 204 | 3,351 | 512 | 958 |
| 12. Victoria Park[16] | 10,643 | 1.89 | 3,747 | 1,403 | 210 | 419 | 2,880 | 526 | 1,458 |
| 13. Garscadden/Scotstounhill[17] | 14,955 | 2.04 | 4,479 | 2,037 | 89 | 746 | 3,785 | 1,517 | 2,302 |
| 14. Drumchapel/Anniesland[18] | 14,003 | 2.08 | 3,838 | 1,985 | 108 | 530 | 3,656 | 1,819 | 2,067 |
| 15. Maryhill[19] | 10,809 | 1.91 | 3,789 | 1,287 | 222 | 399 | 2,785 | 1,031 | 1,296 |
| 16. Canal[20] | 12,219 | 2.00 | 3,618 | 1,777 | 83 | 566 | 2,957 | 1,695 | 1,523 |
| 17. Springburn/Robroyston[21] | 12,810 | 2.13 | 3,433 | 1,694 | 36 | 628 | 3,331 | 1,641 | 2,047 |
| 18. East Centre[22] | 12,795 | 2.07 | 2,999 | 2,220 | 43 | 801 | 3,405 | 1,573 | 1,754 |
| 19. Shettleston[23] | 12,666 | 2.01 | 3,492 | 1,929 | 54 | 786 | 3,408 | 1,305 | 1,692 |
| 20. Baillieston[24] | 8,849 | 2.40 | 1,452 | 1,094 | 20 | 583 | 2,835 | 864 | 2,001 |
| 21. North East[25] | 8,795 | 2.21 | 2,148 | 932 | 52 | 338 | 2,500 | 1,443 | 1,382 |
| 22. Dennistoun[26] | 11,805 | 1.85 | 4,372 | 1,309 | 457 | 305 | 3,121 | 1,061 | 1,180 |
| 23. Partick East/Kelvindale[27] | 14,202 | 1.90 | 4,557 | 1,570 | 938 | 552 | 4,533 | 443 | 1,609 |
| Total (Glasgow City) | 285,693 | 2.03 | 86,728 | 36,508 | 6,711 | 11,943 | 78,191 | 26,513 | 39,099 |
Percentages
| Ward Name | HHOLDS | SIZE | Household type | ||||||
|---|---|---|---|---|---|---|---|---|---|
| SP<65 | SP>65 | MOSTU | MO>65 | MOOTH | CHSPA | CHOTH | |||
| 1. Linn[5] | 13,432 | 2.21 | 23.3 | 13.2 | 0.2 | 5.2 | 29.1 | 12.2 | 16.8 |
| 2. Newlands/Auldburn[6] | 10,922 | 2.16 | 25.2 | 15.4 | 3.7 | 5.6 | 25.9 | 10.5 | 17.1 |
| 3. Greater Pollok[7] | 12,115 | 2.42 | 19.1 | 11.5 | 0.6 | 4.2 | 30.0 | 11.6 | 23.1 |
| 4. Cardonald[8] | 13,680 | 2.21 | 20.7 | 16.9 | 0.2 | 6.1 | 27.8 | 11.3 | 17.0 |
| 5. Govan[9] | 12,890 | 1.87 | 38.3 | 10.8 | 2.4 | 2.6 | 26.4 | 8.9 | 10.6 |
| 6. Pollokshields[10] | 12,728 | 2.17 | 29.3 | 12.8 | 0.9 | 4.7 | 30.0 | 5.0 | 17.4 |
| 7. Langside[11] | 15,125 | 1.88 | 36.0 | 12.0 | 0.2 | 3.9 | 30.1 | 6.0 | 11.8 |
| 8. Southside Central[12] | 12,815 | 1.86 | 40.0 | 12.2 | 1.5 | 2.9 | 24.8 | 7.2 | 11.3 |
| 9. Calton[13] | 12,919 | 1.80 | 37.4 | 12.5 | 4.1 | 2.6 | 24.5 | 10.5 | 8.2 |
| 10. Anderston/City/Yorkhill[14] | 13,042 | 1.70 | 44.9 | 7.9 | 11.4 | 1.4 | 26.0 | 2.9 | 5.4 |
| 11. Hillhead[15] | 11,474 | 1.97 | 33.5 | 9.2 | 13.5 | 1.7 | 29.2 | 4.5 | 8.3 |
| 12. Victoria Park[16] | 10,643 | 1.89 | 35.2 | 13.2 | 2.0 | 3.9 | 27.1 | 4.9 | 13.7 |
| 13. Garscadden/Scotstounhill[17] | 14,955 | 2.04 | 29.9 | 13.6 | 0.6 | 5.0 | 25.3 | 10.1 | 15.4 |
| 14. Drumchapel/Anniesland[18] | 14,003 | 2.08 | 27.4 | 14.2 | 0.8 | 3.8 | 26.1 | 13.0 | 14.8 |
| 15. Maryhill[19] | 10,809 | 1.91 | 35.0 | 11.9 | 2.0 | 3.7 | 25.8 | 9.5 | 12.0 |
| 16. Canal[20] | 12,219 | 2.00 | 29.6 | 14.5 | 0.7 | 4.6 | 24.2 | 13.9 | 12.5 |
| 17. Springburn/Robroyston[21] | 12,810 | 2.13 | 26.8 | 13.2 | 0.3 | 4.9 | 26.0 | 12.8 | 16.0 |
| 18. East Centre[22] | 12,795 | 2.07 | 23.4 | 17.3 | 0.3 | 6.3 | 23.8 | 12.3 | 13.7 |
| 19. Shettleston[23] | 12,666 | 2.01 | 27.6 | 15.2 | 0.4 | 6.2 | 26.9 | 10.3 | 13.3 |
| 20. Baillieston[24] | 8,849 | 2.40 | 16.4 | 12.7 | 0.2 | 6.6 | 32.0 | 9.8 | 22.6 |
| 21. North East[25] | 8,795 | 2.21 | 24.4 | 10.6 | 0.6 | 3.8 | 28.4 | 16.4 | 15.7 |
| 22. Dennistoun[26] | 11,805 | 1.85 | 37.0 | 11.1 | 3.9 | 2.6 | 26.4 | 9.0 | 1.0 |
| 23. Partick East/Kelvindale[27] | 14,202 | 1.90 | 32.1 | 11.1 | 6.6 | 3.9 | 31.9 | 3.1 | 11.3 |
| Total (Glasgow City) | 285,693 | 2.03 | 30.4 | 12.8 | 2.3 | 4.2 | 27.4 | 9.3 | 13.7 |
Housing
Arranged into 2017 wards, based on figures taken in 2014 and 2015.
Totals
| Ward Name | Dwellings by Tenure | Ward Total (2015) | Dwellings by Type | Ward Total (2014) | ||||||
|---|---|---|---|---|---|---|---|---|---|---|
| OWN | PRENT | GHA | SRENT | DET | SEMI | TERR | FLAT/O | |||
| 1. Linn[5] | 6,530 | 1,720 | 1,707 | 3,691 | 13,648 | 814 | 2,031 | 2,047 | 8,736 | 13,628 |
| 2. Newlands/Auldburn[6] | 5,267 | 1,407 | 2,994 | 1,304 | 10,972 | 563 | 1,222 | 1,559 | 7,968 | 11,312 |
| 3. Greater Pollok[7] | 6,921 | 1,477 | 2,369 | 1,928 | 12,695 | 1,974 | 3,907 | 2,315 | 4,435 | 12,631 |
| 4. Cardonald[8] | 7,552 | 1,808 | 2,912 | 1,263 | 13,535 | 307 | 2,199 | 2,503 | 8,925 | 13,934 |
| 5. Govan[9] | 4,736 | 3,336 | 1,860 | 4,200 | 14,132 | 84 | 683 | 1,624 | 11,745 | 14,136 |
| 6. Pollokshields[10] | 7,523 | 3,588 | 1,089 | 1,008 | 13,208 | 879 | 943 | 837 | 10,584 | 13,243 |
| 7. Langside[11] | 8,736 | 4,581 | 859 | 1,739 | 15,915 | 49 | 727 | 1,724 | 13,371 | 15,871 |
| 8. Southside Central[12] | 4,384 | 3,854 | 138 | 5,400 | 13,776 | 50 | 134 | 556 | 13,068 | 13,808 |
| 9. Calton[13] | 3,443 | 3,129 | 1,456 | 6,168 | 14,196 | 64 | 321 | 1,690 | 12,327 | 14,402 |
| 10. Anderston/City/Yorkhill[14] | 4,948 | 5,200 | 1,032 | 2,653 | 13,833 | 11 | 3 | 36 | 16,639 | 16,689 |
| 11. Hillhead[15] | 4,744 | 4,162 | 1 | 3,325 | 12,232 | 38 | 44 | 389 | 12,098 | 12,569 |
| 12. Victoria Park[16] | 5,790 | 2,966 | 443 | 1,813 | 11,012 | 151 | 648 | 1,774 | 8,434 | 11,007 |
| 13. Garscadden/Scotstounhill[17] | 6,766 | 2,012 | 4,551 | 1,450 | 14,779 | 266 | 1,947 | 2,691 | 10,106 | 15,010 |
| 14. Drumchapel/Anniesland[18] | 5,835 | 1,828 | 4,020 | 2,788 | 14,471 | 297 | 2,267 | 2,527 | 9,401 | 14,492 |
| 15. Maryhill[19] | 4,647 | 1,972 | 656 | 4,203 | 11,478 | 472 | 819 | 1,143 | 9,070 | 11,504 |
| 16. Canal[20] | 3,843 | 1,292 | 2,149 | 5,032 | 12,316 | 181 | 1,789 | 2,229 | 8,518 | 12,717 |
| 17. Springburn/Robroyston[21] | 5,498 | 1,534 | 1,582 | 4,152 | 12,766 | 1,034 | 2,080 | 1,422 | 8,715 | 13,251 |
| 18. East Centre[22] | 5,622 | 1,685 | 3,999 | 2,261 | 13,567 | 157 | 2,985 | 1,830 | 8,643 | 13,615 |
| 19. Shettleston[23] | 6,234 | 1,914 | 943 | 4,121 | 13,212 | 897 | 2,561 | 1,636 | 8,135 | 13,229 |
| 20. Baillieston[24] | 6,083 | 1,082 | 799 | 1,390 | 9,354 | 1,507 | 3,178 | 2,240 | 2,321 | 9,246 |
| 21. North East[25] | 3,419 | 1,140 | 2,300 | 2,627 | 9,486 | 590 | 1,823 | 2,201 | 5,038 | 9,652 |
| 22. Dennistoun[26] | 3,621 | 2,984 | 2,337 | 2,654 | 11,596 | 42 | 350 | 284 | 10,935 | 11,611 |
| 23. Partick East/Kelvindale[27] | 8,786 | 4,521 | 52 | 1,532 | 14,891 | 309 | 921 | 708 | 13,613 | 15,551 |
| Total (Glasgow City) | 130,928 | 59,192 | 40,248 | 66,702 | 297,070 | 10,736 | 33,582 | 35,965 | 222,825 | 303,108 |
Percentages
| Ward Name | Dwellings by Tenure | Dwellings by Type | ||||||
|---|---|---|---|---|---|---|---|---|
| OWN | PRENT | GHA | SRENT | DET | SEMI | TERR | FLAT/O | |
| 1. Linn[5] | 47.8 | 12.6 | 12.5 | 27.0 | 6.0 | 14.9 | 15.0 | 64.1 |
| 2. Newlands/Auldburn[6] | 48.0 | 12.8 | 27.3 | 11.9 | 5.0 | 10.8 | 13.8 | 70.4 |
| 3. Greater Pollok[7] | 54.5 | 11.6 | 18.7 | 15.2 | 15.6 | 31.0 | 18.3 | 35.1 |
| 4. Cardonald[8] | 55.8 | 13.3 | 21.5 | 9.3 | 2.2 | 15.8 | 18.0 | 64.0 |
| 5. Govan[9] | 33.5 | 23.6 | 13.2 | 29.7 | 0.6 | 4.8 | 11.5 | 83.1 |
| 6. Pollokshields[10] | 57.0 | 27.2 | 8.2 | 7.6 | 6.6 | 7.1 | 6.3 | 79.9 |
| 7. Langside[11] | 54.9 | 28.8 | 5.4 | 10.9 | 0.3 | 4.6 | 10.9 | 84.2 |
| 8. Southside Central[12] | 31.8 | 28.0 | 1.0 | 39.2 | 0.3 | 1.0 | 4.0 | 94.6 |
| 9. Calton[13] | 24.2 | 22.0 | 10.3 | 43.4 | 0.4 | 2.2 | 11.7 | 85.6 |
| 10. Anderston/City/Yorkhill[14] | 37.9 | 39.9 | 7.9 | 20.3 | 0.1 | 0.0 | 0.2 | 99.7 |
| 11. Hillhead[15] | 38.8 | 34.0 | 0.0 | 27.2 | 0.3 | 0.4 | 3.1 | 96.2 |
| 12. Victoria Park[16] | 52.6 | 26.9 | 4.0 | 16.5 | 1.4 | 5.9 | 16.1 | 76.6 |
| 13. Garscadden/Scotstounhill[17] | 45.8 | 13.6 | 30.8 | 9.8 | 1.8 | 13.0 | 17.9 | 67.3 |
| 14. Drumchapel/Anniesland[18] | 40.3 | 12.6 | 27.8 | 19.3 | 2.0 | 15.6 | 17.4 | 64.9 |
| 15. Maryhill[19] | 40.5 | 17.2 | 5.7 | 36.6 | 4.1 | 7.1 | 9.9 | 74.0 |
| 16. Canal[20] | 31.2 | 10.5 | 17.4 | 40.9 | 1.4 | 14.1 | 17.5 | 67.0 |
| 17. Springburn/Robroyston[21] | 43.1 | 12.0 | 12.4 | 32.5 | 7.8 | 15.7 | 10.7 | 65.8 |
| 18. East Centre[22] | 41.4 | 12.4 | 29.5 | 16.7 | 1.1 | 21.9 | 13.4 | 63.5 |
| 19. Shettleston[23] | 47.2 | 14.5 | 7.1 | 31.2 | 6.8 | 19.3 | 12.4 | 61.5 |
| 20. Baillieston[24] | 65.0 | 11.6 | 8.5 | 14.9 | 16.3 | 34.4 | 24.2 | 25.1 |
| 21. North East[25] | 36.1 | 12.0 | 24.2 | 27.7 | 6.1 | 18.9 | 22.8 | 52.2 |
| 22. Dennistoun[26] | 31.2 | 25.7 | 20.1 | 22.9 | 0.4 | 3.0 | 2.4 | 94.2 |
| 23. Partick East/Kelvindale[27] | 59.0 | 30.4 | 0.3 | 10.3 | 2.0 | 5.9 | 4.5 | 87.5 |
| Total (Glasgow City) | 44.1 | 19.9 | 13.5 | 22.5 | 3.5 | 11.1 | 11.9 | 73.5 |
Gender and age
Arranged into 2017 wards, from 2015 figures.
Totals
| Ward Name | Total | Gender | Age range | ||||||||
|---|---|---|---|---|---|---|---|---|---|---|---|
| M | F | 0–4 | 5–11 | 12–15 | 16–29 | 30–44 | 45–64 | 65–74 | 75+ | ||
| 1. Linn[5] | 29,575 | 13,796 | 15,779 | 1,849 | 2,318 | 1,325 | 5,490 | 5,817 | 8,219 | 2,578 | 1,979 |
| 2. Newlands/Auldburn[6] | 23,144 | 11,148 | 11,996 | 1,461 | 1,853 | 983 | 4,372 | 4,499 | 6,180 | 2,010 | 1,786 |
| 3. Greater Pollok[7] | 30,729 | 14,487 | 16,242 | 2,047 | 2,718 | 1,521 | 5,833 | 5,889 | 8,718 | 2,097 | 1,906 |
| 4. Cardonald[8] | 29,639 | 13,577 | 16,062 | 1,719 | 2,417 | 1,387 | 5,351 | 5,592 | 8,037 | 2,573 | 2,563 |
| 5. Govan[9] | 26,769 | 13,923 | 12,846 | 1,705 | 1,710 | 827 | 6,893 | 6,500 | 6,072 | 1,640 | 1,422 |
| 6. Pollokshields[10] | 27,983 | 13,850 | 14,133 | 1,739 | 1,931 | 1,032 | 5,302 | 7,149 | 6,846 | 2,029 | 1,955 |
| 7. Langside[11] | 29,060 | 14,049 | 15,011 | 1,651 | 1,656 | 752 | 5,584 | 8,402 | 7,075 | 2,078 | 1,862 |
| 8. Southside Central[12] | 25,266 | 13,472 | 11,794 | 1,935 | 1,674 | 793 | 5,460 | 6,835 | 5,607 | 1,616 | 1,346 |
| 9. Calton[13] | 27,460 | 13,714 | 13,746 | 1,710 | 1,613 | 844 | 8,401 | 6,121 | 5,709 | 1,658 | 1,404 |
| 10. Anderston/City/Yorkhill[14] | 30,184 | 15,866 | 14,318 | 922 | 738 | 317 | 16,194 | 6,462 | 3,791 | 942 | 818 |
| 11. Hillhead[15] | 25,411 | 12,653 | 12,758 | 1,144 | 1,074 | 487 | 11,081 | 5,387 | 4,171 | 1,114 | 953 |
| 12. Victoria Park[16] | 20,950 | 10,169 | 10,781 | 1,071 | 1,257 | 658 | 4,752 | 5,093 | 5,251 | 1,562 | 1,306 |
| 13. Garscadden/Scotstounhill[17] | 30,565 | 14,779 | 15,786 | 1,825 | 2,319 | 1,279 | 5,613 | 6,644 | 8,127 | 2,341 | 2,417 |
| 14. Drumchapel/Anniesland[18] | 29,432 | 13,582 | 15,850 | 1,819 | 2,434 | 1,287 | 5,780 | 6,290 | 7,544 | 2,228 | 2,050 |
| 15. Maryhill[19] | 22,244 | 10,855 | 11,389 | 1,327 | 1,375 | 774 | 5,240 | 4,966 | 5,567 | 1,646 | 1,349 |
| 16. Canal[20] | 25,000 | 11,681 | 13,319 | 1,559 | 1,860 | 1,018 | 5,309 | 5,009 | 6,209 | 2,176 | 1,860 |
| 17. Springburn/Robroyston[21] | 27,237 | 12,802 | 14,435 | 1,641 | 2,179 | 1,138 | 5,302 | 5,493 | 7,438 | 2,026 | 2,020 |
| 18. East Centre[22] | 27,991 | 13,281 | 14,710 | 1,676 | 2,112 | 1,166 | 5,159 | 5,381 | 7,401 | 2,457 | 2,639 |
| 19. Shettleston[23] | 25,806 | 12,487 | 13,319 | 1,466 | 1,620 | 901 | 4,962 | 4,803 | 7,466 | 2,438 | 2,150 |
| 20. Baillieston[24] | 21,663 | 10,364 | 11,299 | 1,176 | 1,527 | 1,030 | 3,989 | 3,831 | 6,668 | 1,988 | 1,454 |
| 21. North East[25] | 20,457 | 9,579 | 10,878 | 1,567 | 1,816 | 858 | 4,045 | 4,321 | 5,288 | 1,481 | 1,081 |
| 22. Dennistoun[26] | 20,861 | 10,427 | 10,434 | 1,246 | 1,177 | 585 | 5,927 | 5,360 | 4,106 | 1,273 | 1,187 |
| 23. Partick East/Kelvindale[27] | 28,914 | 13,734 | 15,180 | 1,091 | 1,206 | 640 | 8,763 | 6,497 | 6,672 | 2,182 | 1,863 |
| Total (Glasgow City) | 606,340 | 294,275 | 312,065 | 35,346 | 40,584 | 21,602 | 144,802 | 132,341 | 148,162 | 44,133 | 39,370 |
Percentages
| Ward Name | Total | Gender | Age range | ||||||||
|---|---|---|---|---|---|---|---|---|---|---|---|
| M | F | 0–4 | 5–11 | 12–15 | 16–29 | 30–44 | 45–64 | 65–74 | 75+ | ||
| 1. Linn[5] | 29,575 | 46.6 | 53.4 | 6.3 | 7.8 | 4.5 | 18.6 | 19.7 | 27.5 | 8.7 | 6.7 |
| 2. Newlands/Auldburn[6] | 23,144 | 48.2 | 51.8 | 6.3 | 8.0 | 4.2 | 18.9 | 19.2 | 26.7 | 8.7 | 7.7 |
| 3. Greater Pollok[7] | 30,729 | 47.1 | 52.9 | 6.7 | 8.8 | 4.9 | 19.0 | 19.2 | 28.4 | 6.8 | 6.2 |
| 4. Cardonald[8] | 29,639 | 45.8 | 54.2 | 5.8 | 8.1 | 4.7 | 18.1 | 18.9 | 27.1 | 8.7 | 8.6 |
| 5. Govan[9] | 26,769 | 52.0 | 48.0 | 6.4 | 6.9 | 3.1 | 25.7 | 24.3 | 22.7 | 6.1 | 5.3 |
| 6. Pollokshields[10] | 27,983 | 49.5 | 50.5 | 6.2 | 6.9 | 3.7 | 18.9 | 25.5 | 24.5 | 7.2 | 7.0 |
| 7. Langside[11] | 29,060 | 48.3 | 51.7 | 5.7 | 5.7 | 2.6 | 19.2 | 28.9 | 24.3 | 7.1 | 6.4 |
| 8. Southside Central[12] | 25,266 | 53.3 | 46.7 | 7.7 | 6.6 | 3.1 | 21.6 | 27.0 | 22.2 | 6.4 | 5.3 |
| 9. Calton[13] | 27,460 | 49.9 | 50.1 | 6.2 | 5.9 | 3.1 | 30.6 | 22.3 | 20.8 | 6.0 | 5.1 |
| 10. Anderston/City/Yorkhill[14] | 30,184 | 52.6 | 47.4 | 3.0 | 2.4 | 1.0 | 53.6 | 21.4 | 12.6 | 3.1 | 2.7 |
| 11. Hillhead[15] | 25,411 | 49.8 | 50.2 | 4.5 | 4.2 | 1.9 | 43.6 | 21.2 | 16.4 | 4.4 | 3.7 |
| 12. Victoria Park[16] | 20,950 | 48.5 | 51.5 | 5.1 | 6.0 | 3.1 | 22.7 | 24.3 | 25.1 | 7.4 | 6.2 |
| 13. Garscadden/Scotstounhill[17] | 30,565 | 48.4 | 51.6 | 6.0 | 7.6 | 4.2 | 18.4 | 21.7 | 26.6 | 7.7 | 7.9 |
| 14. Drumchapel/Anniesland[18] | 29,432 | 46.1 | 53.9 | 6.2 | 8.3 | 4.4 | 19.6 | 21.4 | 25.6 | 7.6 | 7.0 |
| 15. Maryhill[19] | 22,244 | 48.8 | 51.2 | 6.0 | 6.2 | 3.5 | 23.6 | 22.3 | 25.0 | 7.4 | 6.1 |
| 16. Canal[20] | 25,000 | 46.7 | 53.3 | 6.2 | 7.0 | 4.0 | 21.2 | 20.0 | 24.9 | 8.7 | 7.4 |
| 17. Springburn/Robroyston[21] | 27,237 | 47.0 | 53.0 | 6.0 | 8.0 | 4.2 | 19.5 | 20.2 | 27.3 | 7.4 | 7.4 |
| 18. East Centre[22] | 27,991 | 47.4 | 52.6 | 6.0 | 7.5 | 4.2 | 18.4 | 19.2 | 26.4 | 8.8 | 9.4 |
| 19. Shettleston[23] | 25,806 | 48.4 | 51.6 | 5.7 | 6.3 | 3.5 | 19.2 | 18.6 | 28.9 | 9.4 | 8.3 |
| 20. Baillieston[24] | 21,663 | 47.8 | 52.2 | 5.4 | 7.0 | 4.8 | 18.4 | 17.7 | 30.8 | 9.2 | 6.7 |
| 21. North East[25] | 20,457 | 46.8 | 53.2 | 7.7 | 8.9 | 4.2 | 19.8 | 21.1 | 25.9 | 7.2 | 5.3 |
| 22. Dennistoun[26] | 20,861 | 50.0 | 50.0 | 6.0 | 5.6 | 2.8 | 28.4 | 25.7 | 19.7 | 6.1 | 5.7 |
| 23. Partick East/Kelvindale[27] | 28,914 | 47.5 | 52.5 | 3.8 | 4.2 | 2.2 | 30.3 | 22.5 | 23.1 | 7.5 | 6.4 |
| Total (Glasgow City) | 48.5% | 51.5% | 5.8% | 6.7% | 3.6% | 23.9% | 21.8% | 24.4% | 7.3% | 6.5% | |
Economy
Arranged into 2017 wards, with population figures from 2011 census and benefit claimant figures from Department of Work and Pensions, May 2016.
Totals
| Ward Name | Pop. | Economic status | |||||||
|---|---|---|---|---|---|---|---|---|---|
| Active | Inactive | Claimants | |||||||
| Total | EMPL | SELF | UNEMP | JSA | ESA/ INCAP | INCSUP/ OTH | |||
| 1. Linn[5] | 19,898 | 14,297 | 11,474 | 1,107 | 1,716 | 5,601 | 400 | 2,580 | 1,230 |
| 2. Newlands/Auldburn[6] | 15,358 | 10,739 | 8,278 | 1,089 | 1,372 | 4,619 | 480 | 1,870 | 915 |
| 3. Greater Pollok[7] | 19,786 | 14,580 | 11,866 | 1,197 | 1,517 | 5,206 | 405 | 2,325 | 1,285 |
| 4. Cardonald[8] | 19,197 | 14,104 | 11,586 | 855 | 1,663 | 5,093 | 370 | 2,280 | 1,265 |
| 5. Govan[9] | 18,319 | 12,992 | 10,178 | 835 | 1,979 | 5,327 | 630 | 2,785 | 950 |
| 6. Pollokshields[10] | 19,232 | 14,154 | 10,839 | 2,058 | 1,257 | 5,078 | 290 | 1,410 | 735 |
| 7. Langside[11] | 20,894 | 16,832 | 13,993 | 1,511 | 1,328 | 4,062 | 285 | 1,605 | 715 |
| 8. Southside Central[12] | 17,393 | 11,842 | 9,111 | 1,065 | 1,666 | 5,551 | 490 | 2,575 | 915 |
| 9. Calton[13] | 17,982 | 11,241 | 8,747 | 686 | 1,808 | 6,741 | 560 | 3,190 | 1,080 |
| 10. Anderston/City/Yorkhill[14] | 23,673 | 14,179 | 11,013 | 1,273 | 1,893 | 9,494 | 380 | 1,445 | 380 |
| 11. Hillhead[15] | 20,034 | 12,485 | 9,647 | 1,300 | 1,538 | 7,549 | 350 | 1,480 | 455 |
| 12. Victoria Park[16] | 14,563 | 11,244 | 9,149 | 1,242 | 853 | 3,319 | 215 | 1,220 | 405 |
| 13. Garscadden/Scotstounhill[17] | 20,241 | 14,322 | 11,331 | 1,068 | 1,923 | 5,919 | 535 | 2,910 | 1,240 |
| 14. Drumchapel/Anniesland[18] | 19,462 | 13,659 | 10,830 | 873 | 1,956 | 5,803 | 480 | 2,815 | 1,360 |
| 15. Maryhill[19] | 15,061 | 10,777 | 8,652 | 840 | 1,285 | 4,284 | 465 | 1,825 | 660 |
| 16. Canal[20] | 16,317 | 10,582 | 8,197 | 650 | 1,735 | 5,735 | 580 | 3,395 | 1,365 |
| 17. Springburn/Robroyston[21] | 18,217 | 12,653 | 10,129 | 834 | 1,690 | 5,564 | 545 | 2,590 | 1,095 |
| 18. East Centre[22] | 17,588 | 11,403 | 9,046 | 729 | 1,628 | 6,185 | 510 | 3,080 | 1,380 |
| 19. Shettleston[23] | 17,150 | 12,271 | 9,856 | 1,009 | 1,406 | 4,879 | 440 | 2,625 | 1,020 |
| 20. Baillieston[24] | 14,266 | 10,847 | 8,954 | 930 | 963 | 3,419 | 180 | 1,385 | 780 |
| 21. North East[25] | 13,140 | 8,907 | 6,916 | 574 | 1,417 | 4,233 | 375 | 2,270 | 975 |
| 22. Dennistoun[26] | 16,116 | 11,384 | 8,996 | 743 | 1,645 | 4,732 | 440 | 1,955 | 745 |
| 23. Partick East/Kelvindale[27] | 21,566 | 15,897 | 12,708 | 2,068 | 1,121 | 5,669 | 125 | 770 | 355 |
| Total (Glasgow City) | 415,453 | 291,391 | 231,496 | 24,536 | 35,359 | 124,062 | 9,530 | 50,385 | 21,305 |
Percentages
| Ward Name | Pop. | Economic status | |||||||
|---|---|---|---|---|---|---|---|---|---|
| Active | Inactive | Claimants | |||||||
| Total | EMPL | SELF | UNEMP | JSA | ESA/INCAP | INCSUP/OTH | |||
| 1. Linn[5] | 19,898 | 71.8 | 57.7 | 5.6 | 8.6 | 28.2 | 2.0 | 13.2 | 6.3 |
| 2. Newlands/Auldburn[6] | 15,358 | 70.0 | 53.9 | 7.1 | 8.9 | 30.0 | 3.2 | 12.4 | 6.1 |
| 3. Greater Pollok[7] | 19,786 | 73.7 | 60.1 | 6.0 | 7.7 | 26.3 | 2.0 | 11.4 | 6.3 |
| 4. Cardonald[8] | 19,197 | 73.5 | 60.3 | 4.4 | 8.7 | 26.5 | 1.9 | 12.0 | 6.7 |
| 5. Govan[9] | 18,319 | 70.9 | 55.6 | 4.6 | 10.8 | 29.1 | 3.2 | 14.3 | 4.9 |
| 6. Pollokshields[10] | 19,232 | 73.6 | 56.4 | 10.7 | 6.5 | 26.4 | 1.5 | 7.3 | 3.8 |
| 7. Langside[11] | 20,894 | 80.6 | 67.0 | 7.2 | 6.4 | 19.4 | 1.4 | 7.6 | 3.4 |
| 8. Southside Central[12] | 17,393 | 68.1 | 52.4 | 6.1 | 9.6 | 31.9 | 2.7 | 14.4 | 5.1 |
| 9. Calton[13] | 17,982 | 62.5 | 48.6 | 3.8 | 10.1 | 37.5 | 2.8 | 15.8 | 5.3 |
| 10. Anderston/City/Yorkhill[14] | 23,673 | 60.0 | 46.5 | 5.4 | 8.0 | 40.0 | 1.4 | 5.5 | 1.4 |
| 11. Hillhead[15] | 20,034 | 62.3 | 48.1 | 6.5 | 7.7 | 37.7 | 1.7 | 7.2 | 2.2 |
| 12. Victoria Park[16] | 14,563 | 77.2 | 62.8 | 8.5 | 5.9 | 22.8 | 1.4 | 8.1 | 2.7 |
| 13. Garscadden/Scotstounhill[17] | 20,241 | 70.8 | 56.0 | 5.3 | 9.5 | 29.2 | 2.6 | 14.3 | 6.1 |
| 14. Drumchapel/Anniesland[18] | 19,462 | 70.2 | 55.6 | 4.5 | 10.0 | 29.8 | 2.4 | 14.4 | 6.9 |
| 15. Maryhill[19] | 15,061 | 71.6 | 57.4 | 5.6 | 8.5 | 28.4 | 2.9 | 11.6 | 4.2 |
| 16. Canal[20] | 16,317 | 64.9 | 50.2 | 4.0 | 10.6 | 35.1 | 3.5 | 20.5 | 8.3 |
| 17. Springburn/Robroyston[21] | 18,217 | 69.5 | 55.6 | 4.6 | 9.3 | 30.5 | 3.0 | 14.2 | 6.0 |
| 18. East Centre[22] | 17,588 | 64.8 | 51.4 | 4.1 | 9.3 | 35.2 | 2.8 | 17.2 | 7.7 |
| 19. Shettleston[23] | 17,150 | 71.5 | 57.5 | 5.9 | 8.2 | 28.5 | 2.6 | 15.2 | 5.9 |
| 20. Baillieston[24] | 14,266 | 76.0 | 62.8 | 6.5 | 6.7 | 24.0 | 1.2 | 9.6 | 5.4 |
| 21. North East[25] | 13,140 | 67.8 | 52.6 | 4.4 | 10.8 | 32.2 | 2.7 | 16.6 | 7.1 |
| 22. Dennistoun[26] | 16,116 | 70.6 | 55.8 | 4.6 | 10.2 | 29.4 | 2.9 | 12.7 | 4.8 |
| 23. Partick East/Kelvindale[27] | 21,566 | 73.7 | 58.9 | 9.6 | 5.2 | 26.3 | 0.6 | 3.5 | 1.6 |
| Total (Glasgow City) | 415,453 | 70.1% | 55.7% | 5.9% | 8.5% | 29.9% | 2.3% | 12.1% | 5.1% |
Previous ward systems
2007 to 2017 multi-member wards
Prior to the introduction of the 2017 boundaries, a similar multi-member system divided among 21 wards[28] was introduced for the 2007 council election,[29] also used in 2012:[30]
| Ward | Number of councillors | Representation (2012) |
|---|---|---|
| 1. Linn | 4 | 2 Lab; 1 SNP; 1 Lib Dem |
| 2. Newlands/Auldburn | 3 | 2 Lab; 1 SNP |
| 3. Greater Pollok | 4 | 2 Lab; 2 SNP |
| 4. Craigton | 4 | 2 Lab; 2 SNP |
| 5. Govan | 4 | 3 Lab; 1 SNP |
| 6. Pollokshields | 3 | 1 Lab; 1 Con; 1 SNP |
| 7. Langside | 3 | 2 SNP; 1 Lab |
| 8. Southside Central | 4 | 2 Lab; 2 SNP |
| 9. Calton | 3 | 2 Lab; 1 SNP |
| 10. Anderston/City | 4 | 2 SNP; 1 Lab; 1 Green |
| 11. Hillhead | 4 | 2 Lab; 1 SNP; 1 Green |
| 12. Partick West | 4 | 2 SNP; 1 Green; 1 Ind |
| 13. Garscadden/Scotstounhill | 4 | 2 Lab; 2 SNP |
| 14. Drumchapel/Anniesland | 4 | 3 Lab; 1 SNP |
| 15. Maryhill/Kelvin | 4 | 2 Lab; 2 SNP |
| 16. Canal | 4 | 2 Lab; 1 Ind; 1 Green |
| 17. Springburn | 3 | 2 Lab; 1 SNP |
| 18. East Centre | 4 | 2 Lab; 2 SNP |
| 19. Shettleston | 4 | 3 Lab; 1 SNP |
| 20. Baillieston | 4 | 2 Lab; 2 SNP |
| 21. North East | 4 | 3 Lab; 1 SNP |
1995 to 2007 single-member wards
From 1999 until the 2007 election, there were 79 councillors elected from 79 small single-member wards[31] by the plurality (first past the post) system of election. The result from this system in 2003 was 69 of the 79 councillors representing the Labour Party, although that party gained only around half the votes cast in the election to the council, and the Scottish National Party represented by just four councillors, despite gaining some 20% of the votes. There were also three Liberal Democrat councillors, one from the Conservative party, and one from the Scottish Socialist Party.[32]
The earlier election returns were even more skewed in terms of seats versus overall vote share due to the voting system in use: in 1999 council election result, Labour received 74 seats (94%) from 49% of the vote and the SNP received two seats from 29% vote share.[33] In the first GCC election in 1995, which included 83 wards,[34] Labour won 77 (93%) of the seats from approximately 62% of the overall vote, while the SNP's 23% overall vote share gave them only one seat.[35]
Wards list (1999 and 2003 elections)
| Ward | Ward | Ward | Ward |
|---|---|---|---|
|
|
|
|

References
- (Total of all wards) KML file imported to mapping software
- - Council Area (Glasgow City) (Total of all wards)
- "Glasgow City Council wards - MapIt". mapit.mysociety.org. Retrieved 18 May 2017.
- Population statistics for each ward - https://www.glasgow.gov.uk/index.aspx?articleid=18820
- City Ward Factsheets 2017: Ward 1 - Linn, Glasgow City Council
- City Ward Factsheets 2017: Ward 2 - Newlands/Auldburn, Glasgow City Council
- City Ward Factsheets 2017: Ward 3 - Greater Pollok, Glasgow City Council
- City Ward Factsheets 2017: Ward 4 - Cardonald, Glasgow City Council
- City Ward Factsheets 2017: Ward 5 - Govan, Glasgow City Council
- City Ward Factsheets 2017: Ward 6 - Pollokshields, Glasgow City Council
- City Ward Factsheets 2017: Ward 7 - Langside, Glasgow City Council
- City Ward Factsheets 2017: Ward 8 - Southside Central, Glasgow City Council
- City Ward Factsheets 2017: Ward 9 - Calton, Glasgow City Council
- City Ward Factsheets 2017: Ward 10 - Anderston/City/Yorkhill, Glasgow City Council
- City Ward Factsheets 2017: Ward 11 - Hillhead, Glasgow City Council
- City Ward Factsheets 2017: Ward 12 - Victoria Park, Glasgow City Council
- City Ward Factsheets 2017: Ward 13 - Garscadden/Scotstounhill, Glasgow City Council
- City Ward Factsheets 2017: Ward 14 - Drumchapel/Anniesland, Glasgow City Council
- City Ward Factsheets 2017: Ward 15 - Maryhill, Glasgow City Council
- City Ward Factsheets 2017: Ward 16 - Canal, Glasgow City Council
- City Ward Factsheets 2017: Ward 17 - Springburn/Robroyston, Glasgow City Council
- City Ward Factsheets 2017: Ward 18 - East Centre, Glasgow City Council
- City Ward Factsheets 2017: Ward 19 - Shettleston, Glasgow City Council
- City Ward Factsheets 2017: Ward 20 - Baillieston, Glasgow City Council
- City Ward Factsheets 2017: Ward 21 - North East, Glasgow City Council
- City Ward Factsheets 2017: Ward 22 - Dennistoun, Glasgow City Council
- City Ward Factsheets 2017: Ward 23 - Partick East/Kelvindale, Glasgow City Council
- Local Government Boundary Commission for Scotland - Single Transferable Vote - Proportional Representation: Final recommendations for Glasgow City Council area, 4th Reviews of Electoral Arrangements Maps, Wards 1999 - 2007 : Local Government Boundary Commission for Scotland
- Local Election Results 3rd May 2007, Andrew Teale (2008)
- Local Election Results 2012: Glasgow, Local Elections Archive Project (LEAP), Andrew Teale
- Electoral Arrangements for Local Government Areas in Scotland: Glasgow City Council Area, 3rd Reviews of Electoral Arrangements Maps, Wards 1999 - 2007 : Local Government Boundary Commission for Scotland
- Chapter 57 Clyde Councils, Local Election Results, 5th May 2003, Andrew Teale
- Scottish Council Elections 1999 - Results and Statistics, H.M. Bochel, D.T. Denver
- Formation electoral arrangements in 1995: Glasgow City council area, Local Government Boundary Commission for Scotland
- Scottish Council Elections 1995 - Results and Statistics, H.M. Bochel, D.T. Denver