UEFA coefficient
In European football, the UEFA coefficients are statistics used for ranking and seeding teams in club and international competitions. Introduced in 1979,[1] the coefficients are calculated by UEFA, who administer football within Europe.
For men's competitions (discussed in this article), three different sets of coefficients are calculated:
- National team coefficient: used to rank national teams, for seeding in the UEFA Euro qualifying and finals tournaments
- Country coefficient: used to rank the collective performance of the clubs of each member association, for assigning the number of places, and at what stage clubs enter the UEFA Champions League, UEFA Europa League and the UEFA Europa Conference League
- Club coefficient: used to rank individual clubs, for seeding in the UEFA Champions League, UEFA Europa League and UEFA Europa Conference League
While not discussed in this article, coefficients are calculated in a similar fashion for women's competitions such as the UEFA Women's Champions League,[2][3] as well as for youth tournaments such as the UEFA Euro U-21 tournament.[4]
Men's National team coefficient
The UEFA national team coefficient is derived from the results of each European national football team, and is only calculated by UEFA every second year in November; defined as being the point of time when all UEFA nations have completed the qualification stage of the upcoming World Cup or European Championship tournament.
The purpose of calculating the coefficients is to compile an official UEFA rank, to be used as seeding criteria for the European nations, when drawing up qualification groups and the final tournament groups of the European Championship. Previously, up until 2006, the UEFA national team coefficient was also used for the seeded draw of World Cup qualification groups in Europe, while the draw for final tournament groups of the World Cup was always seeded on the basis of the official FIFA World Rankings. UEFA stopped using UEFA national team coefficients for the seeding of World Cup qualification groups at the request of FIFA to only use the official FIFA ranking for all seeded draws related to the World Cup tournament.
Old ranking and calculation method
It was first introduced in 2003 and used for seeding the 2004 European Final tournament and 2006 World Cup qualification. Until the end of the Euro 2008 tournament, the UEFA national team coefficient was calculated by dividing the number of all points scored (three points for a win, one for a draw) by the number of all matches played, in the last two qualification rounds of the World Cup or European Championship. Results from the final tournaments, Play-off matches and friendly games were all ignored. In those cases where a nation did not take part at one of the two latest qualifying rounds, due to being directly qualified as a host, only one qualifying round would be taken into account.
If two or more nations ended up with exactly the same coefficient, the following ranking criteria was applied:
- Highest coefficient from the matches played in the most recent qualifying competition.
- Biggest average goal difference per game, found by dividing the sum of all goal differences by the number of ranked matches.
- Highest average number of goals scored per game.
- Highest average number of away goals scored per game.
- Drawing of lots.
The last three times UEFA used this calculation method was for the final UEFA coefficients in 2003, 2005 and 2007.
Current ranking and calculation method
On 20 May 2008, UEFA announced changes to the coefficient ranking system.[5][6][7] The ranking will continue to be calculated every second year in November, but under the new system, teams now gain ranking points for each game played in the most recently completed full cycle (defined as all qualifying games and final tournament games) of both the World Cup and European Championship, with addition of ranking points for each game played at the latest completed half cycle (defined as all games played in the latest qualifying round). Ranking points for all games played inside those two and a half cycles, will be awarded according to the rules listed below.
- 10,000 points are awarded for each match played, regardless of the match result.
- Each team earns an additional 30,000 for winning and 10,000 for drawing.
- In case of a game decided by penalty shoot-out, the points are allocated as a draw, with the winner of the shoot-out gaining an additional 10,000 points.
- Each match at the final tournament, or play-offs to determine qualification, are also granted bonus points, ranging from 6,000 points for all play-offs or World Cup group stage games, to 38,000 points for playing a final.
- 501 points are earned for each goal scored, and -500 are given for each goal conceded.
- Coefficients are calculated for each two and a half cycle, by dividing the sum of earned points with the number of games played.
- When calculating the overall average coefficient for the cycles, the latest full cycle and half cycle will each have double the weight, compared to the oldest full cycle.
- Special arrangements are in place for those nations that did not participate in one of the previous qualifying tournaments due to hosting the competition.
2017 ranking
The coefficients from 2017 used for the seeding and pot placements in the draw for 2018–19 UEFA Nations League, were calculated for each country by averaging:
- 40% of the average ranking points per game earned in the 2018 FIFA World Cup qualifying stage.
- 40% of the average ranking points per game earned in the UEFA Euro 2016 qualifying stage and final tournament.
- 20% of the average ranking points per game earned in the 2014 FIFA World Cup qualifying stage and final tournament.
The seeding and pot placements of the teams in the draw for the 2018–19 UEFA Nations League were based on the UEFA coefficients, determined on 11 October 2017, which are as follows:[8]
|
|
|
History
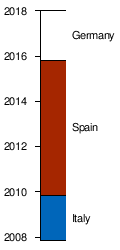
After the recalculation of the coefficient rankings for the 2007 cycle, Italy were ranked top following their FIFA World Cup victory in 2006. Runners-up France lay behind them in second place, followed by the Czech Republic. Spain overtook Italy to gain first place following their UEFA Euro 2008 win, with beaten finalists Germany moving into second; the Netherlands were third.
Spain consolidated their top spot by winning the 2010 FIFA World Cup, with the Netherlands jumping above Germany by finishing second in the tournament. In the 2013 rankings, Spain maintained top spot by winning their third major competition in a row - UEFA Euro 2012. Germany regained second, with the Dutch falling back to third place after failing to make it out of their group.
Germany climbed to the top of the 2015 rankings as a result of their 2014 FIFA World Cup success; Spain dropped behind them. England reached their highest position in the rankings - placed third. Germany held on to top spot in 2017, with new European champions Portugal in second; Belgium were third.
| Year | First | Second | Third | |||
|---|---|---|---|---|---|---|
| Team | Coeff. | Team | Coeff. | Team | Coeff. | |
| 2007[6] | 36,986 | 36,219 | 36,025 | |||
| 2009[9] | 39,964 | 38,294 | 37,821 | |||
| 2011[10] | 43,116 | 40,860 | 40,446 | |||
| 2013[11] | 42,158 | 41,366 | 38,541 | |||
| 2015[12] | 40,236 | 37,963 | 35,963 | |||
| 2017[8] | 40,747 | 38,655 | 38,123 | |||
Women's National team coefficient
Old Women ranking and calculation method
See same category in men's.
Current Women ranking and calculation method
Final Women's ranking in 2017
- UEFA Women's Euro 2013 final tournament and qualifying competition (20%)
- 2015 FIFA Women's World Cup final tournament and qualifying competition (40%)
- UEFA Women's Euro 2017 qualifying competition (40%)
|
|
|
Men's Country coefficient
The country coefficient is used to rank the football associations of Europe, and thus determine the number of clubs from an association that will participate in the UEFA Champions League and the UEFA Europa League.
The UEFA ranking determines the number of teams competing in the season after the next, not in the first season after the publication of the ranking. Thus, the rankings at the end of the 2019–20 season determine the team allocation by association in the 2021–22 (not 2020–21) UEFA season. This is unrelated to the selection of teams which will fill each allocation through the individual association leagues and national cups (which is decided in the preceding year).
This coefficient is determined by the results of the clubs of the associations in the UEFA Champions League and the UEFA Europa League games over the past five seasons. Two points are awarded for each win by a club, and one for a draw (points are halved in the qualifying and playoff rounds). Results determined by extra time do count in determining the allocation of points, but results determined by penalty-shootouts do not affect the allocation of points, other than for bonus points given for qualification into the latter rounds of the Champions League or the Europa League. The number of points awarded each season is divided by the number of teams that participated for that association in that season. This number is then rounded down to three decimal places (e.g. 2⅔ would be rounded to 2.666).[14][15]
To determine a country's coefficient for a particular season, the coefficients for the last five seasons are added. Bonus points are added to the number of points scored in a season. Bonus points are allocated for:
- Clubs that reach the quarter-finals, semi-finals, or final of either the UEFA Champions League or the UEFA Europa League (1 bonus point).
- Clubs that qualify for the group stage of the Champions League (4 bonus points).
- Clubs that qualify for the round of 16 of the Champions League (5 bonus points).
Current ranking
The ranking below takes into account of each association's performance in European competitions from 2015–16 to 2019–20, with the 2019–20 season currently taking place.
The final ranking at the end of the 2019–20 season will be used to determine the number of places for each association in the 2021–22 UEFA Champions League, the 2021–22 UEFA Europa League and the 2021–22 UEFA Europa Conference League.
As of 12 March 2020 the coefficients are as follows:[16][17]
| Ranking | Member association (L: League, C: Cup, LC: League cup1) |
Coefficient | Teams | Places in 2021–22 season | ||||||||||
|---|---|---|---|---|---|---|---|---|---|---|---|---|---|---|
| 2020 | 2019 | Mvmt | 2015–16 | 2016–17 | 2017–18 | 2018–19 | 2019–20 | Total | CL | EL | ECL | Total | ||
| 1 | 1 | 23.928 | 20.142 | 19.714 | 19.571 | 16.017 | 99.426 | 5/7 | 4 | 2 | 1 | 7 | ||
| 2 | 2 | 14.250 | 14.928 | 20.071 | 22.642 | 16.285 | 88.176 | 4/7 | ||||||
| 3 | 4 | 16.428 | 14.571 | 9.857 | 15.214 | 15.571 | 71.641 | 5/7 | ||||||
| 4 | 3 | 11.500 | 14.250 | 17.333 | 12.642 | 12.642 | 68.367 | 5/7 | ||||||
| 5 | 5 | 11.083 | 14.416 | 11.500 | 10.583 | 9.333 | 56.915 | 2/6 | 3 | 6 | ||||
| 6 | 7 | 10.500 | 8.083 | 9.666 | 10.900 | 10.300 | 49.449 | 0/5 | 1 | 2 | ||||
| 7 | 6 | 11.500 | 9.200 | 12.600 | 7.583 | 4.666 | 45.549 | 0/6 | 2 | 5 | ||||
| 8 | 8 | 7.400 | 12.500 | 2.600 | 7.800 | 7.600 | 37.900 | 0/5 | ||||||
| 9 | 11 | 5.750 | 9.100 | 2.900 | 8.600 | 9.400 | 35.750 | 0/5 | ||||||
| 10 | 9 | 9.800 | 5.500 | 8.000 | 5.600 | 5.600 | 34.500 | 1/5 | ||||||
| 11 | 10 | 6.600 | 9.700 | 6.800 | 5.500 | 5.000 | 33.600 | 1/5 | ||||||
| 12 | 12 | 3.800 | 7.375 | 9.750 | 6.200 | 5.800 | 32.925 | 1/5 | ||||||
| 13 | 16 | 5.500 | 8.500 | 5.250 | 4.875 | 4.125 | 28.250 | 1/4 | ||||||
| 14 | 20 | 3.000 | 4.375 | 4.000 | 6.750 | 9.750 | 27.875 | 1/4 | ||||||
| 15 | 13 | 7.300 | 5.500 | 5.500 | 6.500 | 2.500 | 27.300 | 0/5 | ||||||
| 16 | 18 | 3.000 | 5.500 | 7.000 | 6.125 | 5.125 | 26.750 | 0/4 | 1 | 0 | 3 | 4 | ||
| 17 | 14 | 5.400 | 5.800 | 5.100 | 5.100 | 4.900 | 26.300 | 1/5 | ||||||
| 18 | 17 | 5.300 | 4.300 | 6.500 | 3.900 | 5.600 | 25.600 | 1/5 | ||||||
| 19 | 19 | 4.250 | 2.875 | 6.375 | 6.000 | 6.000 | 25.500 | 0/4 | ||||||
| 20 | 15 | 4.500 | 5.125 | 5.125 | 5.750 | 4.375 | 24.875 | 0/4 | ||||||
| 21 | 22 | 4.750 | 2.750 | 5.375 | 4.125 | 5.750 | 22.750 | 0/4 | ||||||
| 22 | 23 | 7.250 | 1.375 | 4.000 | 5.375 | 3.750 | 21.750 | 0/4 | ||||||
| 23 | 27 | 2.250 | 6.750 | 5.625 | 2.625 | 2.375 | 19.625 | 0/4 | ||||||
| 24 | 24 | 4.625 | 2.750 | 4.250 | 4.250 | 3.375 | 19.250 | 0/4 | ||||||
| 25 | 21 | 5.125 | 3.000 | 3.250 | 5.000 | 2.500 | 18.875 | 0/4 | ||||||
| 26 | 26 | 4.375 | 4.250 | 4.375 | 2.375 | 3.375 | 18.750 | 0/4 | ||||||
| 27 | 28 | 1.000 | 4.250 | 4.000 | 4.000 | 4.125 | 17.375 | 0/4 | ||||||
| 28 | 29 | 2.250 | 3.300 | 2.900 | 2.375 | 5.875 | 16.700 | 0/4 | ||||||
| 29 | 25 | 5.500 | 3.875 | 2.875 | 2.250 | 2.125 | 16.625 | 0/4 | ||||||
| 30 | 30 | 3.750 | 2.125 | 1.875 | 5.125 | 3.000 | 15.875 | 0/4 | ||||||
| 31 | 32 | 5.000 | 2.500 | 2.000 | 1.500 | 2.500 | 13.500 | 0/1 | 0 | 1 | 1 | |||
| 32 | 31 | 1.000 | 2.250 | 4.625 | 3.125 | 2.000 | 13.000 | 0/4 | 1 | 3 | 4 | |||
| 33 | 33 | 1.625 | 1.875 | 1.625 | 3.250 | 4.500 | 12.875 | 0/4 | ||||||
| 34 | 43 | 0.750 | 0.750 | 0.875 | 2.625 | 3.000 | 8.000 | 0/4 | ||||||
| 35 | 41 | 0.750 | 0.500 | 2.375 | 2.625 | 1.625 | 7.875 | 0/4 | ||||||
| 36 | 44 | 1.625 | 1.125 | 0.625 | 1.500 | 2.750 | 7.625 | 0/4 | ||||||
| 37 | 42 | 1.625 | 1.375 | 0.750 | 1.625 | 2.250 | 7.625 | 0/4 | ||||||
| 38 | 36 | 2.125 | 0.875 | 2.625 | 1.000 | 0.750 | 7.375 | 0/4 | ||||||
| 39 | 34 | 1.500 | 1.250 | 3.125 | 1.000 | 0.500 | 7.375 | 0/4 | ||||||
| 40 | 40 | 1.500 | 0.500 | 1.375 | 2.000 | 1.500 | 6.875 | 0/4 | ||||||
| 41 | 35 | 1.250 | 0.875 | 2.750 | 1.125 | 0.750 | 6.750 | 0/4 | ||||||
| 42 | 37 | 0.700 | 2.625 | 1.125 | 1.000 | 1.250 | 6.700 | 0/4 | ||||||
| 43 | 38 | 1.000 | 1.750 | 1.250 | 0.875 | 1.625 | 6.500 | 0/4 | ||||||
| 44 | 47 | 0.625 | 1.125 | 0.125 | 1.625 | 2.250 | 5.750 | 0/4 | ||||||
| 45 | 45 | 0.875 | 1.250 | 1.375 | 1.500 | 0.750 | 5.750 | 0/4 | ||||||
| 46 | 39 | 1.125 | 1.000 | 1.125 | 1.500 | 0.625 | 5.375 | 0/4 | ||||||
| 47 | 48 | 1.500 | 1.000 | 0.500 | 1.000 | 1.000 | 5.000 | 0/4 | ||||||
| 48 | 52 | 0.750 | 0.500 | 0.750 | 0.500 | 2.375 | 4.875 | 0/4 | ||||||
| 49 | 51 | 0.750 | 1.500 | 0.500 | 1.000 | 1.000 | 4.750 | 0/3 | ||||||
| 50 | 49 | 1.000 | 0.875 | 1.125 | 0.375 | 1.000 | 4.375 | 0/4 | ||||||
| 51 | 46 | 1.000 | 1.375 | 0.625 | 0.500 | 0.875 | 4.375 | 0/4 | 23 | 3 | ||||
| 52 | 53 | ——4 | ——4 | 0.000 | 2.500 | 1.500 | 4.000 | 0/2 | ||||||
| 53 | 50 | 0.375 | 0.375 | 0.750 | 1.125 | 1.125 | 3.750 | 0/4 | ||||||
| 54 | 54 | 0.166 | 0.166 | 0.166 | 0.833 | 1.500 | 2.831 | 0/3 | ||||||
| 55 | 55 | 0.000 | 0.000 | 0.166 | 0.500 | 0.000 | 0.666 | 0/3 | ||||||
1 The winners of the league cups of England and France are given a place in the UEFA Europa League by special permission from UEFA (replacing the lowest-ranked league team which would have qualified).
2 The Liechtenstein Football Association does not organise a national league competition and all its seven clubs compete in the Swiss football league system.[18][19] As a result, the only competitor from Liechtenstein in European competitions is the Liechtenstein Cup winners, who qualify for the UEFA Europa Conference League.[19]
3 Starting from the 2021–22 season, the associations ranked 51–55 will have two spots in the UEFA Europa Conference League.[20][21]
4 Kosovo was not a UEFA member until 13 May 2016.[22]
UEFA uses this coefficient system to decide which teams gain automatic entry to the group stage and which teams must go through qualifying. The teams who occupy the top four league places in the countries ranked 1 to 4 in UEFA competition gain automatic entry into the group stages for the following season’s Champions League competition, the top two teams of the country ranked 5 and 6, and the champions in the countries ranked 7 to 10. The Champions League and Europa League winners also get the chance to participate in the following season’s competition, guaranteed an automatic entry into the group stage.
- Further information on Liechtenstein's status and similar cases
According to the UEFA regulations a National League needs to consist of at least eight clubs to be considered valid, otherwise no participants of such a league will be allowed to enter European competitions.
- There are only seven clubs that are active in Liechtenstein, all of which play in neighbouring Switzerland's league competitions.
- Prior to the introduction of the Welsh Premier League in 1992 Wales also had a single participant in European competitions, the winner (or best placed Welsh team as several English teams also competed) of the Welsh Cup, in the now defunct UEFA Cup Winners' Cup.
History
The original European competition, the Inter-Cities Fairs Cup, was limited to certain clubs and/or by invitation, so no coefficient calculation was necessary.
Following the introduction of the UEFA Cup in 1971, the competition began to grow in complexity. UEFA began to publish rankings in 1979,[1] to identify the number of participants for each country in the UEFA Cup.
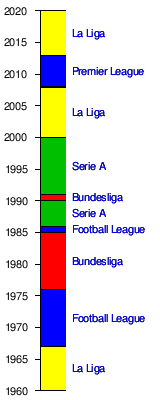
Subsequently, for statistical purposes, various rankings were introduced to portray the history of competitions. According to the prorated (extended) calculation system, only four leagues have succeeded in being ranked as the top European league.[23]
Following the Heysel Stadium disaster, all English teams were banned from UEFA competitions in 1985. The ban was only lifted after five seasons, with the knock-on effects continuing to impact on the First Division and then the Premier League for a total of nine years from 1986 to 1994.[24] Having been top in 1985, England were un-ranked in 1990[25] and would not regain the top position until 2008.[26]
Top leagues by period
The following data indicates the three top-ranked leagues in each five-year period.[27] Data prior to 1975–1979 period has been calculated, but precedes the first published by the Confederation and has merely informative value.[27]
|
The table shows the ranking of nations with respect to the total number of years in the top three of the rankings:
- As of 9 May 2019
| League | 1st | 2nd | 3rd | Total |
|---|---|---|---|---|
| 22 | 9 | 9 | 40 | |
| 15 | 16 | 10 | 41 | |
| 13 | 10 | 15 | 38 | |
| 10 | 8 | 14 | 32 | |
| 0 | 5 | 3 | 8 | |
| 0 | 5 | 1 | 6 | |
| 0 | 2 | 1 | 3 | |
| 0 | 0 | 5 | 5 | |
| 0 | 0 | 2 | 2 |
Women's Country coefficient
Women's current ranking
The ranking below takes into account of each association's performance in European competitions from 2015–16 to 2019–20, with the 2019–20 season currently taking place.
The final ranking at the end of the 2019–20 season will be used to determine the number of places for each association in the 2021–22 UEFA Women's Champions League.
As of 1 November 2019 the coefficients are as follows:[28]
| Ranking | Member association (L: League) |
Coefficient | Teams | Places in 2021–22 season | |||||||
|---|---|---|---|---|---|---|---|---|---|---|---|
| 2020 | 2019 | Mvmt | 2015–16 | 2016–17 | 2017–18 | 2018–19 | 2019–20 | Total | |||
| 1 | 1 | 19.000 | 20.000 | 17.500 | 19.500 | 11.500 | 87.500 | 2/2 | 3 | ||
| 2 | 2 | 14.000 | 14.500 | 13.000 | 15.000 | 11.000 | 67.500 | 2/2 | |||
| 3 | 3 | 5.500 | 11.500 | 17.500 | 10.500 | 10.500 | 55.500 | 1/2 | |||
| 4 | 5 | 9.500 | 11.500 | 8.000 | 14.000 | 11.000 | 54.000 | 2/2 | |||
| 5 | 4 | 12.500 | 10.000 | 10.000 | 8.500 | 4.500 | 45.500 | 0/2 | |||
| 6 | 6 | 11.000 | 5.000 | 11.000 | 8.000 | 5.500 | 40.500 | 0/2 | |||
| 7 | 7 | 7.000 | 9.500 | 4.000 | 5.500 | 7.500 | 33.500 | 0/2 | 2 | ||
| 8 | 10 | 6.000 | 8.000 | 5.000 | 8.000 | 6.000 | 33.000 | 0/1 | |||
| 9 | 8 | 9.500 | 5.000 | 7.000 | 6.000 | 3.000 | 30.500 | 0/2 | |||
| 10 | 12 | 4.000 | 7.000 | 6.000 | 5.000 | 7.000 | 29.000 | 0/1 | |||
| 11 | 11 | 9.000 | 4.000 | 5.000 | 7.500 | 2.000 | 27.500 | 0/1 | |||
| 12 | 15 | 3.000 | 4.000 | 8.000 | 3.000 | 8.000 | 26.000 | 0/1 | |||
| 13 | 9 | 4.000 | 8.000 | 4.000 | 5.000 | 3.000 | 24.000 | 0/2 | |||
| 14 | 13 | 7.000 | 5.000 | 4.500 | 3.000 | 3.000 | 22.500 | 0/2 | |||
| 15 | 14 | 3.000 | 3.000 | 3.500 | 6.000 | 6.500 | 22.000 | 1/2 | |||
| 16 | 21 | 3.000 | 3.000 | 3.000 | 2.000 | 8.000 | 19.000 | 0/1 | |||
| 17 | 17 | 2.000 | 4.000 | 3.000 | 5.000 | 2.000 | 16.000 | 0/1 | 1 | ||
| 18 | 20 | 4.000 | 2.500 | 2.000 | 3.000 | 4.000 | 15.500 | 0/1 | |||
| 19 | 18 | 4.000 | 3.500 | 2.500 | 2.000 | 3.000 | 15.000 | 0/2 | |||
| 20 | 16 | 1.000 | 2.000 | 7.000 | 3.000 | 1.500 | 14.500 | 0/1 | |||
| 21 | 19 | 3.000 | 5.000 | 3.000 | 2.000 | 1.500 | 14.500 | 0/1 | |||
| 22 | 26 | 3.000 | 1.500 | 2.000 | 2.000 | 4.000 | 12.500 | 0/1 | |||
| 23 | 24 | 2.000 | 2.000 | 2.000 | 2.000 | 4.000 | 12.000 | 0/1 | |||
| 24 | 22 | 2.000 | 4.000 | 1.000 | 3.000 | 2.000 | 12.000 | 0/1 | |||
| 25 | 23 | 3.000 | 2.000 | 3.000 | 2.000 | 1.000 | 11.000 | 0/1 | |||
| 26 | 29 | 3.000 | 1.000 | 1.500 | 3.000 | 2.000 | 10.500 | 0/1 | |||
| 27 | 28 | 2.000 | 1.500 | 1.500 | 3.000 | 2.000 | 10.000 | 0/1 | |||
| 28 | 25 | 3.000 | 1.500 | 3.000 | 2.000 | 0.000 | 9.500 | 0/1 | |||
| 29 | 27 | 2.000 | 2.000 | 1.000 | 1.500 | 2.500 | 9.000 | 0/1 | |||
| 30 | 33 | 1.000 | 1.000 | 2.000 | 1.500 | 2.000 | 7.500 | 0/1 | |||
| 31 | 31 | 2.000 | 0.500 | 2.000 | 1.000 | 2.000 | 7.500 | 0/1 | |||
| 32 | 34 | 0.000 | 0.000 | 2.000 | 2.000 | 3.000 | 7.000 | 0/1 | |||
| 33 | 30 | 1.000 | 1.500 | 2.000 | 1.500 | 1.000 | 7.000 | 0/1 | |||
| 34 | 32 | 2.000 | 2.000 | 1.000 | 0.000 | 1.000 | 6.000 | 0/1 | |||
| 35 | 36 | 1.000 | 2.000 | 0.500 | 0.500 | 1.000 | 5.000 | 0/1 | |||
| 36 | 37 | 1.000 | 0.500 | 1.000 | 1.000 | 1.000 | 4.500 | 0/1 | |||
| 37 | 35 | 2.000 | 0.000 | 1.000 | 1.000 | 0.500 | 4.500 | 0/1 | |||
| 38 | 44 | ——1 | 1.000 | 0.000 | 0.000 | 3.000 | 4.000 | 0/1 | |||
| 39 | 38 | 0.000 | 1.000 | 1.000 | 1.000 | 1.000 | 4.000 | 0/1 | |||
| 40 | 39 | 0.000 | 1.000 | 0.000 | 0.500 | 2.000 | 3.500 | 0/1 | |||
| 41 | 42 | 0.000 | 0.500 | 0.500 | 0.500 | 1.500 | 3.000 | 0/1 | |||
| 42 | 40 | 0.500 | 1.000 | 1.000 | 0.000 | 0.000 | 2.500 | 0/1 | |||
| 43 | 41 | 1.000 | 0.000 | 0.000 | 0.000 | 1.000 | 2.000 | 0/1 | |||
| 44 | 43 | 0.500 | 0.000 | 0.000 | 0.500 | 0.000 | 1.000 | 0/1 | |||
| 45 | 45 | 1.000 | 0.000 | 0.000 | 0.000 | 0.000 | 1.000 | 0/1 | |||
| 46 | 46 | 0.000 | 0.500 | 0.000 | 0.000 | 0.000 | 0.500 | 0/1 | |||
| 47 | 47 | 0.000 | 0.000 | 0.000 | 0.000 | 0.000 | 0.000 | 0/1 | |||
| 48 | 48 | No entry |
0.000 | 0.000 | 0.000 | 0.000 | 0/1 | ||||
| 49 | 49 | 0.000 | No entry |
0.000 | No entry |
0.000 | 0.000 | 0/1 | |||
| 50 | — | No entry |
0.000 | 0.000 | 0/1 | ||||||
| — | — | No entry |
——(NR) | 0/0 | |||||||
| — | — | No entry |
——(NR) | 0/0 | |||||||
| — | — | No entry |
——(NR) | 0/0 | |||||||
| — | — | No entry |
——(NR) | 0/0 | |||||||
| — | — | No entry |
——(NR) | 0/0 | |||||||
1 Kosovo was not a UEFA member until 13 May 2016.[29]
NL No women's domestic league
NR No rank (association did not enter in any of the seasons used for computing coefficients)
Women's History
Women's top leagues by period
The following data indicates the three top-ranked women's leagues in each five-year period.
|
The table shows the ranking of nations with respect to the total number of years in the top three of the rankings:
- As of 18 May 2019
| League | 1st | 2nd | 3rd | Total |
|---|---|---|---|---|
| 13 | 3 | 0 | 16 | |
| 2 | 7 | 3 | 12 | |
| 1 | 6 | 7 | 14 | |
| 0 | 0 | 4 | 4 | |
| 0 | 0 | 2 | 2 |
Men's Club coefficient
The club coefficient is either the sum of the points earned by the club in the UEFA Champions League and the UEFA Europa League over the previous five seasons or 20% of the club's association coefficient over the same period, whichever is the higher.[30] Prior to the 2018 club rankings, teams received the sum of their points earned over the last five seasons plus 20% of the club's association coefficient.[31][32]
The clubs receive two points for a win, one point for a draw, and no points for a defeat in games of the main stages of the Champions League and the Europa League. Results determined after extra-time are included in this method, however results determined after penalty shoot-outs are not (the result is considered a draw). Bonus points for entering the Europa League group stage are not additional to win/draw points; they provide a minimum points allowance for participating clubs, whereas bonus points for entering the Champions League group stage (and those for qualifying to the knockout stage) are additional to win/draw points.
Qualifying round results are only taken into account if the team is eliminated in one of the rounds (see table below). Otherwise, the qualifying round results are taken into account only for the calculation of the association's coefficient and are halved.[31] The clubs do not receive any points for elimination in the Champions League qualifying because those teams move to the Europa League and receive points from participation in that competition.[32]
| Round | Points awarded | |
|---|---|---|
| Champions League | Europa League | |
| Preliminary Round elimination | – | 0.5 |
| First qualifying round elimination | – | 1.0 |
| Second qualifying round elimination | – | 1.5 |
| Third qualifying round elimination | – | 2 |
| Play-off elimination | – | 2.5 |
| Group stage participation | 4 | 3 (minimum) |
| Win in group stage or subsequent round | 2 | 2 |
| Draw in group stage or subsequent round | 1 | 1 |
| Round of 16 participation | 5 | – |
| Quarter-finals, semi-finals, and finals participation | 1 | 1 |
This ranking is used by UEFA to determine a club's seeding in club competition draws, including the preliminary and first rounds of the Champions League, and the preliminary, first and second rounds of the Europa League.
Before 1999 a number of strong teams in the UEFA Cup were seeded such that those teams did not meet in the first two rounds. To determine these teams, the sum of the ratio of the number of points achieved to the number of games played by each team, was calculated for the past five years.
UEFA team ranking
The top 25 clubs as of 12 March 2020 are as follows.[33][34]
| Ranking | Club | Association | Coefficient | ||||||||
|---|---|---|---|---|---|---|---|---|---|---|---|
| 2020 | 2019 | Mvmt | 2015–16 | 2016–17 | 2017–18 | 2018–19 | 2019–20 | Total | Country Part | ||
| 1 | 1 | Real Madrid | 33.000 | 33.000 | 32.000 | 19.000 | 17.000 | 134.000 | 19.885 | ||
| 2 | 4 | Atlético Madrid | 28.000 | 29.000 | 28.000 | 20.000 | 21.000 | 126.000 | |||
| 3 | 2 | Barcelona | 26.000 | 23.000 | 25.000 | 30.000 | 20.000 | 124.000 | |||
| 4 | 3 | Bayern Munich | 29.000 | 22.000 | 29.000 | 20.000 | 23.000 | 123.000 | 14.328 | ||
| 5 | 5 | Juventus | 18.000 | 33.000 | 23.000 | 21.000 | 20.000 | 115.000 | 13.673 | ||
| 6 | 6 | Manchester City | 26.000 | 18.000 | 22.000 | 25.000 | 21.000 | 112.000 | 17.635 | ||
| 7 | 8 | Paris Saint-Germain | 24.000 | 20.000 | 19.000 | 19.000 | 23.000 | 105.000 | 11.383 | ||
| 8 | 11 | Liverpool | 22.000 | 0.0001 | 30.000 | 29.000 | 18.000 | 99.000 | 17.635 | ||
| 9 | 18 | Manchester United | 13.000 | 26.000 | 20.000 | 19.000 | 14.000 | 92.000 | |||
| 10 | 9 | Arsenal | 15.000 | 19.000 | 21.000 | 26.000 | 10.000 | 91.000 | |||
| 11 | 7 | Sevilla | 23.000 | 19.000 | 21.000 | 13.000 | 12.000 | 88.000 | 19.885 | ||
| 12 | 13 | Borussia Dortmund | 17.000 | 22.000 | 10.000 | 18.000 | 18.000 | 85.000 | 14.328 | ||
| 17 | Tottenham Hotspur | 12.000 | 10.000 | 21.000 | 26.000 | 16.000 | 85.000 | 17.635 | |||
| 14 | 12 | Chelsea | 18.000 | 0.0001 | 18.000 | 30.000 | 17.000 | 83.000 | |||
| 15 | 14 | Roma | 14.000 | 13.000 | 25.000 | 17.000 | 10.000 | 79.000 | 13.673 | ||
| 16 | 15 | Napoli | 13.000 | 17.000 | 10.000 | 18.000 | 19.000 | 77.000 | |||
| 27 | Lyon | 7.000 | 22.000 | 14.000 | 17.000 | 17.000 | 77.000 | 11.383 | |||
| 15 | Shakhtar Donetsk | 20.000 | 14.000 | 19.000 | 10.000 | 14.000 | 77.000 | 6.900 | |||
| 19 | 10 | Porto | 11.000 | 17.000 | 17.000 | 23.000 | 7.000 | 75.000 | 9.889 | ||
| 20 | 21 | Benfica | 22.000 | 17.000 | 4.000 | 17.000 | 10.000 | 70.000 | |||
| 21 | 20 | Ajax | 6.000 | 22.000 | 1.500 | 27.000 | 13.000 | 69.500 | 7.150 | ||
| 22 | 19 | Zenit Saint Petersburg | 19.000 | 12.000 | 14.000 | 10.000 | 9.000 | 64.000 | 9.109 | ||
| 23 | 28 | Bayer Leverkusen | 14.000 | 18.000 | 0.0001 | 11.000 | 14.000 | 57.000 | 14.328 | ||
| 24 | 21 | Villarreal | 23.000 | 9.000 | 8.000 | 16.000 | 0.0001 | 56.000 | 19.885 | ||
| 25 | 23 | Dynamo Kyiv | 18.000 | 8.000 | 12.000 | 11.000 | 6.000 | 55.000 | 6.900 | ||
1 Did not participate in European competitions that season.
Top club by period
The following data indicate the top-ranked clubs in each 5-year period.[27] Data prior to 1975–1979 period has been calculated, but precedes the first published by the Confederation and has merely informative value.[27]
|
Top-rated clubs listed by number of times they were top-ranked over a 5-year period since the first period officially analysed (1975–1979):
| Rank | Club | Total |
|---|---|---|
| 1 | 15 | |
| 2 | 7 | |
| 7 | ||
| 4 | 2 | |
| 2 | ||
| 2 | ||
| 2 | ||
| 8 | 1 | |
| 1 | ||
| 1 | ||
| 1 | ||
| 1 |
Women's Club coefficient
UEFA women's team ranking
The top 25 clubs as of 1 November 2019 are as follows:[35]
| Ranking | Club | Association | Coefficient | |||||||||
|---|---|---|---|---|---|---|---|---|---|---|---|---|
| 2020 | 2019 | Mvmt | 2015–16 | 2016–17 | 2017–18 | 2018–19 | 2019–20 | Club | Country Part | Total | ||
| 1 | 1 | Lyon | 23.000 | 20.000 | 24.000 | 24.000 | 12.000 | 103.000 | 28.875 | 131.875 | ||
| 2 | 2 | Wolfsburg | 21.000 | 14.000 | 21.000 | 12.000 | 12.000 | 81.000 | 22.275 | 103.275 | ||
| 3 | 4 | Barcelona | 13.000 | 18.000 | 13.000 | 21.000 | 12.000 | 77.000 | 17.820 | 94.820 | ||
| 4 | 3 | Paris Saint-Germain | 15.000 | 20.000 | 0.0001 | 15.000 | 11.000 | 61.000 | 28.875 | 89.875 | ||
| 5 | 6 | Bayern Munich | 5.000 | 15.000 | 5.000 | 17.000 | 10.000 | 52.000 | 22.275 | 74.275 | ||
| 6 | 10 | Manchester City | 0.0001 | 19.000 | 19.000 | 4.000 | 9.000 | 51.000 | 18.315 | 69.315 | ||
| 7 | 9 | Slavia Praha | 11.000 | 7.000 | 13.000 | 13.000 | 8.000 | 52.000 | 13.365 | 65.365 | ||
| 8 | 8 | Chelsea | 8.000 | 4.000 | 16.000 | 17.000 | 0.0001 | 45.000 | 18.315 | 63.315 | ||
| 9 | 5 | Rosengård | 15.000 | 12.000 | 8.000 | 9.000 | 0.0001 | 44.000 | 15.015 | 59.015 | ||
| 10 | 13 | Fortuna Hjørring | 9.000 | 11.000 | 4.000 | 3.000 | 8.000 | 35.000 | 11.385 | 46.385 | ||
| 11 | 11 | Brøndby | 5.000 | 8.000 | 4.000 | 8.000 | 9.000 | 34.000 | 11.385 | 45.385 | ||
| 12 | 15 | LSK Kvinner | 9.000 | 5.000 | 7.000 | 12.000 | 2.000 | 35.000 | 9.075 | 44.075 | ||
| 13 | 21 | Atlético Madrid | 6.000 | 0.0001 | 3.000 | 7.000 | 10.000 | 26.000 | 17.820 | 43.820 | ||
| 14 | 16 | Montpellier | 0.0001 | 0.0001 | 11.000 | 0.0001 | 0.0001 | 11.000 | 28.875 | 39.875 | ||
| 15 | 19 | BIIK Kazygurt | 4.000 | 7.000 | 6.000 | 5.000 | 7.000 | 29.000 | 9.570 | 38.570 | ||
| 16 | 7 | Frankfurt | 16.000 | 0.0001 | 0.0001 | 0.0001 | 0.0001 | 16.000 | 22.275 | 38.275 | ||
| 17 | 12 | Linköpings | 0.0001 | 0.0001 | 12.000 | 8.000 | 0.0001 | 20.000 | 15.015 | 35.015 | ||
| 18 | 14 | Zürich | 4.000 | 8.000 | 4.000 | 8.000 | 3.000 | 27.000 | 7.920 | 34.920 | ||
| 19 | 20 | Glasgow City | 3.000 | 3.000 | 5.000 | 6.000 | 10.000 | 27.000 | 7.260 | 34.260 | ||
| 20 | 18 | Brescia | 12.000 | 6.000 | 6.000 | 0.0001 | 0.0001 | 24.000 | 10.065 | 34.065 | ||
| 21 | 22 | Sparta Praha | 0.0001 | 3.000 | 9.000 | 3.000 | 3.000 | 18.000 | 13.365 | 31.365 | ||
| 22 | 26 | Twente | 6.000 | 8.000 | 0.0001 | 0.0001 | 6.000 | 20.000 | 10.890 | 30.890 | ||
| 23 | 113 | Arsenal | 0.0001 | 0.0001 | 0.0001 | 0.0001 | 12.000 | 12.000 | 18.315 | 30.315 | ||
| 24 | 27 | Fiorentina | 0.0001 | 0.0001 | 8.000 | 8.000 | 3.000 | 19.000 | 10.065 | 29.065 | ||
| 25 | 17 | Zvezda-2005 | 9.000 | 3.000 | 5.000 | 3.000 | 0.0001 | 20.000 | 7.425 | 27.425 | ||
1 Did not participate in European competitions that season.
Top women's club by period
The following data indicate the top-ranked women's clubs in each 5-year period.
|
Top-rated women's clubs listed by number of times they were top-ranked over a 5-year period since the first period officially analysed (2001–2005):
| Rank | Club | Total |
|---|---|---|
| 1 | 6 | |
| 2 | 3 | |
| 3 | 2 | |
| 2 | ||
| 2 |
Futsal Club coefficient
Men's
- UEFA Futsal Euro 2014 final tournament and qualifying competition
- UEFA Futsal Euro 2016 final tournament and qualifying competition
- 2016 FIFA Futsal World Cup final tournament and qualifying competition[13]
|
|
|
|
Women's
Futsal Country
|
|
|
Futsal Club
Youth tournaments' coefficient
UEFA Under-19
|
|
|
|
UEFA Under-17
|
|
|
|
UEFA Women's Under-19
|
|
|
|
UEFA Women's Under-17
|
|
|
|
Youth Club's (Nation)
|
|
|
Youth Club's (Club)
Criticisms
The UEFA coefficient system has been criticised for being likely to preserve the status quo for rankings and seedings, as well as for favouring teams from stronger leagues.[36]
See also
- UEFA Respect Fair Play ranking
- AFC Club Competitions Ranking, a similar system used by the Asian Football Confederation
- CAF 5-Year Ranking, a similar system used by the Confederation of African Football
- CONMEBOL ranking of the Copa Libertadores, a similar system used by CONMEBOL (clubs only)
References
- Patric Andersson; Peter Ayton; Carsten Schmidt (2009). Myths and Facts about Football: The Economics and Psychology of the World's Greatest Sport. Newcastle upon Tyne: Cambridge Scholars Publishing. p. 136. ISBN 14-4381-525-X.
- "UEFA Women's Champions League Association Coefficient Ranking" (PDF). UEFA.com.
- "UEFA Women's Champions League 2012/13 Entry List" (PDF). UEFA.com.
- "Spain and Israel top seeds for Under-21 draw". UEFA.com. 19 October 2012.
- "New coefficient system". UEFA. 20 May 2008. Retrieved 21 May 2008.
- "New UEFA National Team Coefficient Ranking System" (PDF). UEFA. 20 May 2008. Retrieved 21 May 2008.
- "National Team Coefficient Ranking -Technical explanation" (PDF). UEFA. October 2009.
- "National Team Coefficients Overview" (PDF). UEFA.com. Union of European Football Associations. 11 October 2017. Retrieved 11 October 2017.
- "National Team Coefficients Overview" (PDF). UEFA. Retrieved 6 March 2018.
- "National Team Coefficients Overview" (PDF). UEFA. 12 October 2011. Retrieved 6 March 2018.
- "National Ranking UEFA 2013". footballseeding.com. Retrieved 6 March 2018.
- "National Ranking UEFA 2015". footballseeding.com. Retrieved 6 March 2018.
- "UEFA Futsal National Teams coefficient rankings 2017/18" (PDF). UEFA.com.
- "UEFA Country Coefficients 2012-2013". UEFA. Retrieved 12 November 2012.
- "Regulations of UEFA Champions League" (PDF). UEFA. Retrieved 27 May 2013.
- "UEFA Country Ranking 2020". kassiesa.home.xs4all.nl. Retrieved 12 March 2020.
- uefa.com. "Member associations - UEFA rankings - Country coefficients – UEFA.com". UEFA.com. Retrieved 12 March 2020.
- "Border crossing". When Saturday Comes (WSC). July 2008. Archived from the original on 13 April 2016. Retrieved 14 April 2016.CS1 maint: unfit url (link)
- "Liechtenstein making strides (Liechtenstein's profile)". UEFA. Archived from the original on 13 April 2016. Retrieved 14 April 2016.
- "UEFA to ask FIFA/IFAB for new concussion protocol". UEFA.com. 29 May 2019.
- "Irish Premiership: NIFL set to lose one of three Europa League places in 2020/21". BBC Sport. 6 June 2019.
- "Zyrtare: Kosova pranohet në FIFA, jemi të barabartë me të gjitha vendet e botës - Telegrafi". Telegrafi (in Albanian). 14 May 2016. Retrieved 13 May 2016.
- UEFA European Cup Coefficients Database (Bert Kassies)
- "UEFA Country Ranking 1985". Retrieved 22 April 2014.
- "UEFA Country Ranking 1990". Retrieved 22 April 2014.
- "UEFA Country Ranking 2008". Retrieved 22 April 2014.
- "UEFA European Cup Coefficients Database". Bert Kassies. Retrieved 13 April 2012.
- uefa.com. "Women's association club coefficients – UEFA.com". UEFA.com. Retrieved 1 November 2019.
- "Zyrtare: Kosova pranohet në FIFA, jemi të barabartë me të gjitha vendet e botës - Telegrafi". Telegrafi (in Albanian). 14 May 2016. Retrieved 13 May 2016.
- "How the club coefficients are calculated". UEFA.com.
- "UEFA Coefficients calculation method". Bert Kassies. Retrieved 28 August 2010.
- "UEFA Club Coefficients 2012-2013". UEFA. Retrieved 20 November 2012.
- "UEFA Team Ranking 2020". kassiesa.home.xs4all.nl. Retrieved 12 March 2020.
- "Member associations - UEFA rankings - Club coefficients – UEFA.com". UEFA.com. Retrieved 12 March 2020.
- uefa.com. "Women's club coefficients – UEFA.com". UEFA.com. Retrieved 1 November 2019.
- Chris Bevan (28 August 2013). "How Uefa's seeding system helps Arsenal & hinders Celtic". BBC Sport. Retrieved 15 July 2014.