List of countries by vehicles per capita
This article is a list of countries by the number of road motor vehicles per 1,000 inhabitants. This includes cars, vans, buses, and freight and other trucks; but excludes motorcycles and other two-wheelers.
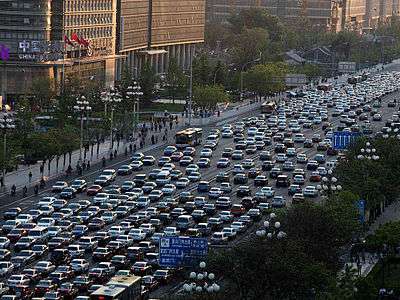
China became the world's largest new car market in 2009
The People's Republic of China has the largest fleet of motor vehicles in the world, with 340 million motor vehicles in 2019 including 250 million cars,[1] and in 2009 became the world's largest new car market as well.[2][3] In 2011, a total of 80 million cars and commercial vehicles were built, led by China, with 18.4 million motor vehicles manufactured.[4]
List
| # | Country or region | Motor vehicles per 1,000 people |
Total | Year |
|---|---|---|---|---|
| 1 | 1,263 | 2013[5] | ||
| 2 | 899 | 2013[5] | ||
| 3 | 860 | 4,240,000 | 2018[6] | |
| 4 | 838 | 273,602,100[7] | 2018 | |
| 5 | 824 | 278,924[8][9] | 2016 | |
| 6 | 773 | 2016[10] | ||
| 7 | 752 | 4,151,275 | 2019[11] | |
| 8 | 730 | 19,200,000[12] | 2018 | |
| 9 | 721 | 300,897[8] | 2015 | |
| 10 | 716 | 6,113,791[13] | 2018 | |
| 11 | 685 | 25,060,399 [14] | 2018 | |
| 13 | 677 | 2014[15] | ||
| 14 | 670 | 403,282 | 2017[16] | |
| 15 | 648 | 23,500,401 | 2017[16] | |
| 16 | 625 | 37,876,138 | 2016[16] | |
| 17 | 615 | 77,938,515[17] | 2018 | |
| 18 | 613 | 291,664 | 2017[16] | |
| 19 | 593 | 22,503,579 | 2017[16] | |
| 20 | 561 | 46,474,594 | 2017[16] | |
| 21 | 555 | 4,898,578 | 2017[16] | |
| 22 | 550 | 725,944 | 2017[16] | |
| 23 | 541 | 1,117,935 | 2017[16] | |
| 24 | 539 | 5,538,222 | 2017[16] | |
| 25 | 514 | 2,719,396 | 2017[16] | |
| 26 | 509 | 526,617 | 2017[16] | |
| 27 | 508 | 5,785,447 | 2017[16] | |
| 28 | 492 | 5,059,472 | 2017[16] | |
| 29 | 487 | 8,373,244 | 2017[16] | |
| 29 | 487 | 5,235,928 | 2017[16] | |
| 30 | 483 | 2017[16] | ||
| 31 | 479 | 4,844,823 | 2017[16] | |
| 32 | 478 | 32,005,986 | 2017[16] | |
| 33 | 477 | 1,876,188[8] | 2015 | |
| 34 | 475 | 23,444,165[19] | 2019 | |
| 35 | 471 | 31,200,182 | 2017[16] | |
| 36 | 463 | 1,356,987 | 2017[16] | |
| 37 | 458 | 8,900,000[20] | 2019 | |
| 38 | 444 | 2,142,390 | 2017[16] | |
| 39 | 438 | 2,530,047 | 2017[16] | |
| 40 | 433 | 13,308,716[8] | 2015 | |
| 41 | 422 | 578,471[8] | 2015 | |
| 42 | 411 | 1,020,000[8] | 2015 | |
| 43 | 408 | 2,223,117 | 2017[16] | |
| 44 | 393 | 2,770,615 | 2017[16] | |
| 45 | 389 | 1,596,087 | 2017[16] | |
| 46 | 387 | 110,000[8] | 2015 | |
| 47 | 384 | 3,373,139[21] | 2017[22] | |
| 48 | 381 | 55,838,224 | 2019[23] | |
| 49 | 369 | 3,501,981[8] | 2015 | |
| 50 | 368 | 6,900,000[8] | 2015 | |
| 51 | 364 | 77,191,524[24] | 2020 | |
| 52 | 356 | 689,536 | 2017[16] | |
| 53 | 355 | 3,471,997 | 2017[16] | |
| 54 | 349 | 193,000[8] | 2015 | |
| 55 | 333 | 7,842,423[25] | 2016[25] | |
| 56 | 326 | 202,322 | 2016[26] | |
| 57 | 316 | 13,726,226[8] | 2015 | |
| 58 | 297 | 37,353,597[8] | 2015 | |
| 59 | 292 | 397,000[8] | 2015> | |
| 60 | 288 | 2,052,067 | 2015[27] | |
| 61 | 281 | 1,043,900[8] | 2015 | |
| 62 | 280 | 960,000[8] | 2015 | |
| 63 | 258 | 910,969[8] | 2015 | |
| 64 | 251 | 4,397,354[8] | 2015 | |
| 65 | 234 | 2,140,000[8] | 2015 | |
| 66 | 233 | 980,000[8] | 2015 | |
| 67 | 230 | 4,444,941[8] | 2015 | |
| 67 | 230 | 2009[5] | ||
| 68 | 226 | 15,490,503[8] | 2015 | |
| 69 | 224 | 1,076,041[8] | 2015 | |
| 70 | 223 | [28] | ||
| 70 | 223 | 1,330,000[8] | 2015 | |
| 71 | 219 | 9,290,000[29] | 2018 | |
| 72 | 209 | 6,600,000[8] | 2015 | |
| 73 | 206 | 403,316 | 2017[16] | |
| 74 | 204 | 2008[5] | ||
| 75 | 201 | 715,480[8] | 2015 | |
| 76 | 192 | 236,853[8] | 2015 | |
| 77 | 188 | 2010[5] | ||
| 78 | 181 | 260,000,000 | 2019[1] | |
| 79 | 178 | 14,130,000[8] | 2015 | |
| 80 | 177 | 391,686[8] | 2015 | |
| 81 | 174 | [28] | ||
| 82 | 174 | 9,600,412[8] | 2015 | |
| 83 | 172 | 116,930[30] | 2020[31] | |
| 84 | 171 | 677,356[8] | 2015 | |
| 85 | 170 | 957,006[32] | 2018 | |
| 85 | 167 | 489,346 | 2018 [33] | |
| 86 | 167 | 481,114[8] | 2015 | |
| 87 | 165 | 2010[5] | ||
| 88 | 163 | [28] | ||
| 89 | 159 | 2004[34] | ||
| 90 | 153 | 1,610,551[8] | 2015 | |
| 91 | 150 | 2013[35] | ||
| 92 | 149 | 12,035,978 | 2017[16] | |
| 93 | 146 | 2008[5] | ||
| 94 | 145 | 4,510,000[8] | 2015 | |
| 95 | 141 | 2,267,344[8] | 2015> | |
| 96 | 140 | 5,570,000[8] | 2015 | |
| 97 | 139 | 50,000[8] | 2015 | |
| 98 | 124 | 1,135,936[36] | 2018 | |
| 99 | 129 | 1,450,000[8] | 2015 | |
| 100 | 123 | 1,130,000[8] | 2015 | |
| 101 | 122 | [37] | ||
| 102 | 117 | 683,000[38] | 2018 | |
| 103 | 116 | 5,800,000 | 2018[39][40] | |
| 104 | 115 | 1,862,535[8] | 2015 | |
| 105 | 109 | 10,695,694.00[8] | 2018 | |
| 106 | 107 | 2010[5] | ||
| 107 | 106 | 2008[5] | ||
| 108 | 105 | 3,900,000[41] | ||
| 109 | 103 | 3,570,000[41] | ||
| 110 | 101 | 2007[5] | ||
| 111 | 98 | 652,886[41] | ||
| 112 | 95 | 2008[5] | ||
| 113 | 92 | 674,253[8] | 2015 | |
| 114 | 89 | 2007[5] | ||
| 115 | 87 | 22,512,918[8] | 2015 | |
| 116 | 81 | 2007[5] | ||
| 117 | 79 | 480,000[8] | 2015 | |
| 118 | 78 | 2,444,478[8] | 2015 | |
| 119 | 77 | 2007[5] | ||
| 120 | 72 | 770,000[8] | 2015 | |
| 121 | 71 | 2010[5] | ||
| 122 | 70 | 1,469,821[8] | ||
| 123 | 66 | 190,000[8] | 2015 | |
| 124 | 64 | 11,458,370[42] | 2017 | |
| 125 | 60 | 940,000[8] | 2015 | |
| 126 | 57 | 2009[5] | ||
| 127 | 54 | [28] | ||
| 128 | 47 | 1,572,663[8] | 2015 | |
| 129 | 44 | 660,000[8] | 2015 | |
| 130 | 42 | 2010[5] | ||
| 130 | 42 | 480,000[8] | 2015 | |
| 132 | 41 | 940,000[8] | 2015 | |
| 132 | 41 | 260,000[8] | 2015 | |
| 134 | 38 | 2007[5] | ||
| 134 | 38 | 3,822,544[8] | ||
| 136 | 37 | 2004[43] | ||
| 136 | 37 | 2007[5] | ||
| 136 | 37 | 1,000,000[8] | 2015 | |
| 139 | 33 | 2007[5] | ||
| 139 | 33 | 2008[5] | ||
| 141 | 32 | 880,000[8] | 2015 | |
| 141 | 32 | 890,000[8] | 2015 | |
| 143 | 29 | 1,381,473[8] | 2015 | |
| 144 | 28 | 2010[5] | ||
| 144 | 28 | [28] | ||
| 146 | 27 | 660,000[8] | 2015 | |
| 146 | 27 | 2007[5] | ||
| 146 | 27 | 2007[5] | ||
| 146 | 27 | 198,000[8] | 2015 | |
| 150 | 25 | 1,900,000[8] | 2015 | |
| 151 | 24 | 252,000[8] | 2015 | |
| 152 | 23 | 2,170,000[8] | 2015 | |
| 152 | 23 | 370,000[8] | 2015> | |
| 152 | 22 | 28,860,000[44] | 2015 | |
| 154 | 22 | 2010[5] | ||
| 155 | 21 | 2005[5] | ||
| 156 | 20 | 2007[5] | ||
| 156 | 20 | 1,065,897[45] | 2017 | |
| 158 | 18 | 160,000[45] | 2017 | |
| 159 | 17 | 10,000,000[8] | 2015 | |
| 160 | 16 | 297,000[8] | 2015 | |
| 161 | 15 | 347,000[8] | 2015 | |
| 162 | 14 | 2004[46] | ||
| 162 | 14 | 400,000[8] | 2015 | |
| 162 | 14 | 63,000[8] | 2015 | |
| 165 | 13 | 2004[47] | ||
| 165 | 13 | [28] | ||
| 167 | 12 | 490,000[8] | 2015 | |
| 167 | 12 | 203,000[8] | 2015 | |
| 169 | 11 | 2007[5] | ||
| 169 | 11 | 2006[48] | ||
| 171 | 10 | 41,000[8] | 2015 | |
| 172 | 9 | 831,000[49] | 2017 | |
| 173 | 8 | 139,000[8] | 2015 | |
| 174 | 7 | 80,000[8] | 2015 | |
| 174 | 7 | 380,000[8] | 2015 | |
| 174 | 7 | 2004[5] | ||
| 174 | 7 | 2009[5] | ||
| 178 | 6 | 63,000[8] | 2015 | |
| 178 | 6 | 2008[5] | ||
| 178 | 6 | 2006[5] | ||
| 181 | 5 | [28] | ||
| 181 | 5 | 2007[5] | ||
| 181 | 5 | [28] | ||
| 184 | 4 | [28] | ||
| 184 | 4 | 2004[50] | ||
| 184 | 4 | 620,000[8] | 2015 | |
| 187 | 3 | [28] | ||
| 187 | 3 | 2004[51] | ||
| 188 | 2 | 2007[5] |
See also
References
- "China's private car parc exceeds 200 mln for first time". Autonews.gasgoo.com. Retrieved 2020-02-06.
- "Automobiles and Truck Trends". Plunkett Research. Retrieved 2011-08-18.
- John Sousanis (2011-08-15). "World Vehicle Population Tops 1 Billion Units". Ward AutoWorld. Archived from the original on 2011-08-27. Retrieved 2011-08-27.
- John Voelcker (2012-03-29). "80 Million Vehicles Built Globally Last Year - A New Record". Green Car Reports. Retrieved 2012-03-29.
- "World Bank Data: Motor vehicles (per 1,000 people)". The World Bank. Archived from the original on February 9, 2014. Retrieved 2014-02-09. Archived.
- "Highway Statistics 2018" (PDF). Retrieved 2020-06-20.
- "total no of vehicles". Gov.uk.
- "Iceland in figures 2018" (PDF). Retrieved 2019-05-20.
- "Passenger cars in the EU - Statistics Explained". Ec.europa.eu. Retrieved 2018-09-08.
- "Registered cars in Finland (in Finnish)". Statistics Finland. Retrieved 2019-11-14.
- "vehicles" (official site) (in English, German, French, and Italian). Neuchâtel, Switzerland: Federal Statistical Office FSO. Retrieved 2019-05-05.
- "Motor vehicle registrations, by province and territory". Statistics Canada. Retrieved 2019-05-20. (Motorcycles and mopeds subtracted)
- "World Vehicles In Use All Vehicles" (PDF). Retrieved 2016-02-19.
- "Passenger cars per 1 000 inhabitants". Ec.europa.eu. Retrieved 2019-11-30.
- "自動車保有台数に関する統計情報" (PDF). 日本自動車整備振興会連合会. Retrieved 2019-05-20.
- "Passenger cars in the EU - Statistics Explained". Ec.europa.eu. Retrieved 2019-03-13.
- http://www.index.go.kr/potal/main/EachDtlPageDetail.do?idx_cd=1257
- https://www.wall-street.ro/articol/Auto/248775/parcul-auto-din-romania-va-depasi-pragul-de-9-milioane-de-autovehicule-anul-acesta.html
- "כלי רכב מנועיים 2016" (PDF). Israel Central Bureau of Statistics. Archived from the original (PDF) on 2018-11-18. Retrieved 2018-02-15.
- "כלי רכב מנועיים 2017". Israel Central Bureau of Statistics.
- "ЕМИСС". Fedstat.ru. Retrieved 14 April 2019.
- "Frota de Veículos - 2020". infraestrutura.gov.br. Retrieved 2020-05-17.
- "Motor Vehicle Registration". Ministry of Transportation and Communications, R.O.C.
- "Montenegrin statistical office, 2017" (PDF). Retrieved 2017-11-13.
- "Serbian statistical office, 2017" (PDF). Retrieved 2017-11-13.
- "Motor vehicles (most recent) by country". Nationmaster.com. Retrieved 1 April 2012.
- "Ministry of Infrastructure of Ukraine Statistics". mtu.gov.ua. Retrieved 23 June 2019.
- https://www.dsec.gov.mo/TimeSeriesDatabase.aspx?KeyIndicatorID=85
- https://www.dsec.gov.mo/TimeSeriesDatabase.aspx?KeyIndicatorID=12
- "MOTOR VEHICLE POPULATION BY VEHICLE TYPE" (PDF). lta.gov.sg. Retrieved 2019-04-15.
- "Archived copy" (PDF). Archived from the original (PDF) on 2018-06-18. Retrieved 2018-06-18.CS1 maint: archived copy as title (link)
- "Nauru General Data". Populstat.info. Archived from the original on 2014-01-29. Retrieved 2012-06-02.
- "Motor vehicles (per 1,000 people)". Data.worldbank.org. Retrieved 2014-11-03.
- "Nəqliyyat vasitələrinin sayı".
- "Grenada General Data". Populstat.info. Archived from the original on 2012-05-25. Retrieved 2012-06-02.
- "865 شخصاً". Al-akhbar.com. Retrieved 23 March 2019.
- "ANDEMOS advierte sobre el envejecimiento de la población vehicular en Colombia". Andemos.org. Retrieved 23 March 2019.
- "¿Cuántos somos?". Dane.gov.co. Retrieved 23 March 2019.
- "Iraq Motor Vehicle Registered [2005 - 2019] [Data & Charts]". Ceicdata.com. Retrieved 23 March 2019.
- "Road Transport Data (Q1 2017)" (PDF). Nigeria: National Bureau of Statistics. 2017. Retrieved 2019-02-12.
- "Uzbekistan General Data". Populstat.info. Archived from the original on 2012-07-18. Retrieved 2012-06-02.
- "India Motor Vehicle Registered [2005 - 2019] [Data & Charts]". Ceicdata.com. Retrieved 23 March 2019.
- "Myanmar Motor Vehicle Statistics". Ceicdata.com. Retrieved 23 March 2019.
- "Gabon General Data". Populstat.info. Archived from the original on 2012-04-29. Retrieved 2012-06-02.
- "Equatorial Guinea General Data". Populstat.info. Archived from the original on 2012-04-15. Retrieved 2012-06-02.
- "North Korea General Data". Populstat.info. Archived from the original on 2012-06-10. Retrieved 2012-06-02.
- "Number of Vehicles in Ethiopia". 2merkato.com.
- "Lesotho General Data". Populstat.info. Archived from the original on 2012-04-22. Retrieved 2012-06-02.
- "Solomon Islands General Data". Populstat.info. Archived from the original on 2012-07-19. Retrieved 2012-06-02.
| By country |
| ||||||||||||
|---|---|---|---|---|---|---|---|---|---|---|---|---|---|
| Data | |||||||||||||
| History |
| ||||||||||||
| Manufacturers | |||||||||||||
| Organisations | |||||||||||||
| Related topics |
| ||||||||||||
This article is issued from Wikipedia. The text is licensed under Creative Commons - Attribution - Sharealike. Additional terms may apply for the media files.