List of manufacturers by motor vehicle production
This is a list of manufacturers by motor vehicle production, by year, based on Organisation Internationale des Constructeurs d'Automobiles (OICA).
Figures include passenger cars, light commercial vehicles, minibuses, trucks, buses and coaches. OICA defines these entries as follows:[1]
- Passenger cars are motor vehicles with at least four wheels, used for the transport of passengers, and comprising no more than eight seats in addition to the driver's seat.
- Light commercial vehicles (LCV) are motor vehicles with at least four wheels, used for the carriage of goods. Mass given in tons (metric tons) is used as a limit between light commercial vehicles and heavy trucks. This limit depends on national and professional definitions and varies between 3.5 and 7 tons. Minibuses, derived from light commercial vehicles, are used for the transport of passengers, comprising more than eight seats in addition to the driver's seat and having a maximum mass between 3.5 and 7 tons.
- Heavy trucks (HCV) are vehicles intended for the carriage of goods. Maximum authorised mass is over the limit (ranging from 3.5 to 7 tons) of light commercial vehicles. They include tractor vehicles designed for towing semi-trailers.
- Buses and coaches are used for the transport of passengers, comprising more than eight seats in addition to the driver's seat, and having a maximum mass over the limit (ranging from 3.5 to 7 tones) of light commercial vehicles.
Overview
Motor vehicle production by manufacturer (top five groups)
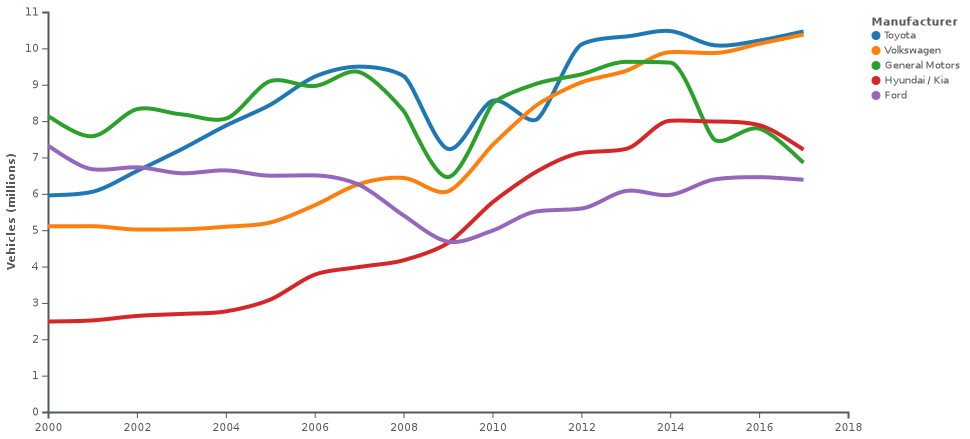
The summary chart includes the five largest worldwide automotive manufacturing groups as of 2017 by number of vehicles produced. Those same groups have held the top 5 positions since 2007; only Hyundai / Kia had a lower rank until it took the fifth spot from DaimlerChrysler in 2006. Figures were compiled by the International Organization of Motor Vehicle Manufacturers (OICA): 2000, 2001, 2002, 2003, 2004, 2005, 2006, 2007, 2008, 2009, 2010, 2011, 2012, 2013, 2014, 2015, 2016, 2017.
- The Toyota group includes Daihatsu and Hino.[2][lower-alpha 1]
- The Volkswagen group includes VW, Audi, SEAT, Skoda and luxury brands.[3][lower-alpha 2]
- The General Motors group includes Daewoo since 2005,[7][8] Saab until 2009[9] (sold to Spyker in 2010),[10] SAIC-GM-Wuling until 2014,[11][12] and Opel and Vauxhall until 2016 (sold to Groupe PSA in 2017).[13]
- Hyundai and Kia have operated as a group since 1998.[lower-alpha 3]
- The Ford group includes Jaguar Land Rover until 2007[14] (sold to Tata in 2008)[15] and Volvo until 2009[16] (sold to Geely in 2010).[17]
2017
This is a list of largest manufacturers by production in 2017.[18]
| Rank | Group | Country | Vehicles |
|---|---|---|---|
| 1 | Toyota | Japan | 10,466,051 |
| 2 | Volkswagen Group | Germany | 10,382,334 |
| 3 | Hyundai / Kia | South Korea | 7,218,391 |
| 4 | General Motors (with SAIC-GM-Wuling)[lower-alpha 4] | United States (China) | 6,856,880 (9,027,658) |
| 5 | Ford | United States | 6,386,818 |
| 6 | Nissan | Japan | 5,769,277 |
| 7 | Honda | Japan | 5,235,842 |
| 8 | FCA | Italy / United States | 4,600,847 |
| 9 | Renault | France | 4,153,589 |
| 10 | Groupe PSA | France | 3,649,742 |
| 11 | Suzuki | Japan | 3,302,336 |
| 12 | SAIC | China | 2,866,913 |
| 13 | Daimler | Germany | 2,549,142 |
| 14 | BMW | Germany | 2,505,741 |
| 15 | Geely | China | 1,950,382 |
| 16 | Changan | China | 1,616,457 |
| 17 | Mazda | Japan | 1,607,602 |
| 18 | Dongfeng Motor | China | 1,450,999 |
| 19 | BAIC | China | 1,254,483 |
| 20 | Mitsubishi | Japan | 1,210,263 |
2016
This is a list of largest manufacturers by production in 2016.[19] Some figures were amended in the 2017 report.[18]
| Rank | Group | Country | Vehicles |
|---|---|---|---|
| 1 | Toyota | Japan | 10,213,486 |
| 2 | Volkswagen Group | Germany | 10,126,281 |
| 3 | Hyundai / Kia | South Korea | 7,889,538 |
| 4 | General Motors (with SAIC-GM-Wuling)[lower-alpha 4] | United States (China) | 7,793,066 (9,937,434) |
| 5 | Ford | United States | 6,457,773 |
| 6 | Nissan | Japan | 5,556,241 |
| 7 | Honda | Japan | 4,999,266 |
| 8 | FCA | Italy / United States | 4,681,457 |
| 9 | Renault | France | 3,373,278 |
| 10 | Groupe PSA | France | 3,152,787 |
| 11 | Suzuki | Japan | 2,945,295 |
| 12 | SAIC | China | 2,564,786 |
| 13 | Daimler | Germany | 2,526,450 |
| 14 | BMW | Germany | 2,359,756 |
| 15 | Changan | China | 1,715,871 |
| 16 | Mazda | Japan | 1,586,013 |
| 17 | BAIC | China | 1,343,682 |
| 18 | Dongfeng Motor | China | 1,315,490 |
| 19 | Geely | China | 1,266,456 |
| 20 | Great Wall | China | 1,094,360 |
2015
Rank of manufacturers by production in 2015[12]
| Rank | Group | Country | Vehicles |
|---|---|---|---|
| 1 | Toyota | Japan | 10,083,831 |
| 2 | Volkswagen Group | Germany | 9,872,424 |
| 3 | Hyundai / Kia | South Korea | 7,988,479 |
| 4 | General Motors (with SAIC-GM-Wuling)[lower-alpha 4] | United States | 7,485,587 (9,490,835) |
| 5 | Ford | United States | 6,396,369 |
| 6 | Nissan | Japan | 5,170,074 |
| 7 | Fiat Chrysler | Italy / United States | 4,865,233 |
| 8 | Honda | Japan | 4,543,838 |
| 9 | Suzuki | Japan | 3,034,081 |
| 10 | Renault | France | 3,032,652 |
| 11 | PSA Peugeot Citroën | France | 2,982,035 |
| 12 | BMW | Germany | 2,279,503 |
| 13 | SAIC | China | 2,260,579 |
| 14 | Daimler | Germany | 2,134,645 |
| 15 | Mazda | Japan | 1,540,576 |
| 16 | Changan | China | 1,540,133 |
| 17 | Mitsubishi | Japan | 1,218,853 |
| 18 | Dongfeng | China | 1,209,296 |
| 19 | BAIC | China | 1,169,894 |
| 20 | Tata | India | 1,009,369 |
2014
Rank of manufacturers by production in 2014[11]
| Rank | Group | Country | Total | Cars | LCV | HCV | Buses |
|---|---|---|---|---|---|---|---|
| 1 | Toyota | Japan | 10,475,338 | 8,788,018 | 1,405,072 | 277,159 | 5,089 |
| 2 | Volkswagen Group | Germany | 9,894,891 | 9,766,293 | 128,598 | ||
| 3 | General Motors | United States | 9,609,326 | 6,643,030 | 2,951,895 | 10,875 | 3,526 |
| 4 | Hyundai / Kia | South Korea | 8,008,987 | 7,628,779 | 280,684 | 84,387 | 15,137 |
| 5 | Ford | United States | 5,969,541 | 3,230,842 | 2,643,854 | 94,845 | |
| 6 | Nissan | Japan | 5,097,772 | 4,279,030 | 796,992 | 21,750 | |
| 7 | Fiat Chrysler | Italy / United States | 4,865,758 | 1,904,618 | 2,812,345 | 102,997 | 45,798 |
| 8 | Honda | Japan | 4,513,769 | 4,478,123 | 35,646 | ||
| 9 | Suzuki | Japan | 3,016,710 | 2,543,077 | 473,633 | ||
| 10 | PSA Peugeot Citroën | France | 2,917,046 | 2,521,833 | 395,213 | ||
| 11 | Renault | France | 2,761,969 | 2,398,555 | 363,414 | ||
| 12 | BMW | Germany | 2,165,566 | 2,165,566 | |||
| 13 | SAIC | China | 2,087,949 | 1,769,837 | 265,087 | 52,715 | 310 |
| 14 | Daimler | Germany | 1,973,270 | 1,808,125 | 165,145 | ||
| 15 | Changan | China | 1,447,017 | 1,089,179 | 262,797 | 95,041 | |
| 16 | Mazda | Japan | 1,328,426 | 1,261,521 | 66,905 | ||
| 17 | Dongfeng | China | 1,301,695 | 745,765 | 201,667 | 340,955 | 13,308 |
| 18 | Mitsubishi | Japan | 1,262,342 | 1,199,823 | 61,302 | 1,217 | |
| 19 | BAIC | China | 1,115,847 | 538,027 | 278,949 | 293,055 | 5,816 |
| 20 | Tata | India | 945,113 | 614,247 | 11,399 | 304,829 | 14,638 |
2013
Rank of manufacturers by production in 2013[21]
| Rank | Group | Country | Total | Cars | LCV | HCV | Buses |
|---|---|---|---|---|---|---|---|
| 1 | Toyota | Japan | 10,324,995 | 8,565,176 | 1,481,722 | 272,411 | 5,686 |
| 2 | General Motors | United States | 9,628,912 | 6,733,192 | 2,890,958 | 4,762 | |
| 3 | Volkswagen Group | Germany | 9,379,229 | 9,259,506 | 119,723 | ||
| 4 | Hyundai / Kia | South Korea | 7,233,080 | 6,909,194 | 242,021 | 67,290 | 14,575 |
| 5 | Ford | United States | 6,077,126 | 3,317,048 | 2,667,220 | 92,858 | |
| 6 | Nissan | Japan | 4,950,924 | 4,090,677 | 837,331 | 22,916 | |
| 7 | Fiat Chrysler | Italy / United States | 4,681,704 | 2,163,040 | 2,350,697 | 124,131 | 43,836 |
| 8 | Honda | Japan | 4,298,390 | 4,263,239 | 35,151 | ||
| 9 | Suzuki | Japan | 2,842,133 | 2,452,573 | 389,560 | ||
| 10 | PSA Peugeot Citroën | France | 2,833,781 | 2,445,889 | 387,892 | ||
| 11 | Renault | France | 2,704,675 | 2,347,913 | 356,762 | ||
| 12 | BMW | Germany | 2,006,366 | 2,006,366 | |||
| 13 | SAIC | China | 1,992,250 | 1,685,392 | 231,374 | 74,431 | 1,053 |
| 14 | Daimler | Germany | 1,781,507 | 1,631,502 | 150,005 | ||
| 15 | Mazda | Japan | 1,264,173 | 1,175,443 | 88,730 | ||
| 16 | Dongfeng | China | 1,238,948 | 642,092 | 226,319 | 357,414 | 13,123 |
| 17 | Mitsubishi | Japan | 1,229,441 | 1,090,571 | 135,306 | 3,564 | |
| 18 | Changan | China | 1,109,889 | 873,794 | 166,056 | 70,039 | |
| 19 | Tata | India | 1,062,654 | 650,708 | 279,511 | 117,425 | 15,010 |
| 20 | Geely | China | 969,896 | 969,896 |
2012
Rank of manufacturers by production in 2012[22]
| Rank | Group | Country | Total | Cars | LCV | HCV | Buses |
|---|---|---|---|---|---|---|---|
| 1 | Toyota | Japan | 10,104,424 | 8,381,968 | 1,448,107 | 268,377 | 5,972 |
| 2 | General Motors | United States | 9,285,425 | 6,608,567 | 2,658,612 | 7,558 | 10,688 |
| 3 | Volkswagen Group | Germany | 9,254,742 | 8,576,964 | 486,544 | 169,064 | 22,170 |
| 4 | Hyundai / Kia | South Korea | 7,126,413 | 6,761,074 | 279,579 | 70,290 | 15,470 |
| 5 | Ford | United States | 5,595,483 | 3,123,340 | 2,394,221 | 77,922 | |
| 6 | Nissan | Japan | 4,889,379 | 3,830,954 | 1,022,974 | 35,451 | |
| 7 | Honda | Japan | 4,110,857 | 4,078,376 | 32,481 | ||
| 8 | PSA Peugeot Citroën | France | 2,911,764 | 2,554,059 | 357,705 | ||
| 9 | Suzuki | Japan | 2,893,602 | 2,483,721 | 409,881 | ||
| 10 | Renault | France | 2,676,226 | 2,302,769 | 373,457 | ||
| 11 | Chrysler | United States | 2,371,427 | 656,892 | 1,702,235 | 12,300 | |
| 12 | Daimler | Germany | 2,195,152 | 1,455,650 | 257,496 | 450,622 | 31,384 |
| 13 | Fiat | Italy | 2,127,295 | 1,501,979 | 498,984 | 85,513 | 40,819 |
| 14 | BMW | Germany | 2,065,477 | 2,065,216 | 261 | ||
| 15 | SAIC | China | 1,783,548 | 1,523,398 | 190,848 | 67,805 | 1,497 |
| 16 | Tata | India | 1,241,239 | 744,067 | 314,399 | 165,171 | 17,602 |
| 17 | Mazda | Japan | 1,189,283 | 1,097,661 | 91,622 | ||
| 18 | Dongfeng Motor | China | 1,137,950 | 539,845 | 245,641 | 337,545 | 14,919 |
| 19 | Mitsubishi | Japan | 1,109,731 | 980,001 | 127,435 | 2,295 | |
| 20 | Changan | China | 1,063,721 | 835,334 | 166,727 | 59,978 | 1,682 |
2011
| Total motor vehicle production | ||||||||||||||||||||||||||||||||||||||||||||||||||||||||||||||||||||||||||||||||||||||||||||||||||||||||||||||||||||||||
| Group | 1,000,000 | 2,000,000 | 3,000,000 | 4,000,000 | 5,000,000 | 6,000,000 | 7,000,000 | 8,000,000 | 9,000,000 | 10,000,000 | ||||||||||||||||||||||||||||||||||||||||||||||||||||||||||||||||||||||||||||||||||||||||||||||||||||||||||||||
| Key | Cars | Light Commercial Vehicles | Heavy Commercial Vehicles | Heavy Buses | ||||||||||||||||||||||||||||||||||||||||||||||||||||||||||||||||||||||||||||||||||||||||||||||||||||||||||||||||||||
| 1. General Motors | 9,031,670 | |||||||||||||||||||||||||||||||||||||||||||||||||||||||||||||||||||||||||||||||||||||||||||||||||||||||||||||||||||||||
| 2. Volkswagen Group | 8,525,573 | |||||||||||||||||||||||||||||||||||||||||||||||||||||||||||||||||||||||||||||||||||||||||||||||||||||||||||||||||||||||
| 3. Toyota | 8,050,181 | |||||||||||||||||||||||||||||||||||||||||||||||||||||||||||||||||||||||||||||||||||||||||||||||||||||||||||||||||||||||
| 4. Hyundai / Kia | 6,616,858 | |||||||||||||||||||||||||||||||||||||||||||||||||||||||||||||||||||||||||||||||||||||||||||||||||||||||||||||||||||||||
| 5. Ford | 5,516,931 | |||||||||||||||||||||||||||||||||||||||||||||||||||||||||||||||||||||||||||||||||||||||||||||||||||||||||||||||||||||||
| 6. Nissan | 4,631,673 | |||||||||||||||||||||||||||||||||||||||||||||||||||||||||||||||||||||||||||||||||||||||||||||||||||||||||||||||||||||||
| 7. PSA Peugeot Citroën | 3,582,410 | |||||||||||||||||||||||||||||||||||||||||||||||||||||||||||||||||||||||||||||||||||||||||||||||||||||||||||||||||||||||
| 8. Honda | 2,909,016 | |||||||||||||||||||||||||||||||||||||||||||||||||||||||||||||||||||||||||||||||||||||||||||||||||||||||||||||||||||||||
| 9. Renault | 2,825,089 | |||||||||||||||||||||||||||||||||||||||||||||||||||||||||||||||||||||||||||||||||||||||||||||||||||||||||||||||||||||||
| 10. Suzuki | 2,725,899 | |||||||||||||||||||||||||||||||||||||||||||||||||||||||||||||||||||||||||||||||||||||||||||||||||||||||||||||||||||||||
| 11. Fiat | 2,336,954 | |||||||||||||||||||||||||||||||||||||||||||||||||||||||||||||||||||||||||||||||||||||||||||||||||||||||||||||||||||||||
| 12. Daimler | 2,137,067 | |||||||||||||||||||||||||||||||||||||||||||||||||||||||||||||||||||||||||||||||||||||||||||||||||||||||||||||||||||||||
| 13. Chrysler | 1,999,017 | |||||||||||||||||||||||||||||||||||||||||||||||||||||||||||||||||||||||||||||||||||||||||||||||||||||||||||||||||||||||
| 14. BMW | 1,738,160 | |||||||||||||||||||||||||||||||||||||||||||||||||||||||||||||||||||||||||||||||||||||||||||||||||||||||||||||||||||||||
| 15. SAIC | 1,478,502 | |||||||||||||||||||||||||||||||||||||||||||||||||||||||||||||||||||||||||||||||||||||||||||||||||||||||||||||||||||||||
| 16. Tata | 1,197,192 | |||||||||||||||||||||||||||||||||||||||||||||||||||||||||||||||||||||||||||||||||||||||||||||||||||||||||||||||||||||||
| 17. Changan | 1,167,208 | |||||||||||||||||||||||||||||||||||||||||||||||||||||||||||||||||||||||||||||||||||||||||||||||||||||||||||||||||||||||
| 18. Mazda | 1,165,591 | |||||||||||||||||||||||||||||||||||||||||||||||||||||||||||||||||||||||||||||||||||||||||||||||||||||||||||||||||||||||
| 19. Mitsubishi | 1,140,282 | |||||||||||||||||||||||||||||||||||||||||||||||||||||||||||||||||||||||||||||||||||||||||||||||||||||||||||||||||||||||
| 20. Dongfeng Motor | 1,108,949 | |||||||||||||||||||||||||||||||||||||||||||||||||||||||||||||||||||||||||||||||||||||||||||||||||||||||||||||||||||||||
| Key | Cars | Light Commercial Vehicles | Heavy Commercial Vehicles | Heavy Buses | ||||||||||||||||||||||||||||||||||||||||||||||||||||||||||||||||||||||||||||||||||||||||||||||||||||||||||||||||||||
| Total: 80,045,075 | Cars: 59,897,273 | LCV: | HCV: | Heavy Bus: | ||||||||||||||||||||||||||||||||||||||||||||||||||||||||||||||||||||||||||||||||||||||||||||||||||||||||||||||||||||
| Reference: "WORLD MOTOR VEHICLE PRODUCTION OICA correspondents survey WORLD RANKING OF MANUFACTURERS Year 2011" (PDF). OICA. Retrieved 2013-09-11. | ||||||||||||||||||||||||||||||||||||||||||||||||||||||||||||||||||||||||||||||||||||||||||||||||||||||||||||||||||||||||
2010
| Total motor vehicle production | |||||||||||||||||||||||||||||||||||||||||||||||||||||||||||||||||||||||||||||||||||||||||||||||||||||||||||||||||||||||
| Group | 1,000,000 | 2,000,000 | 3,000,000 | 4,000,000 | 5,000,000 | 6,000,000 | 7,000,000 | 8,000,000 | 9,000,000 | 10,000,000 | |||||||||||||||||||||||||||||||||||||||||||||||||||||||||||||||||||||||||||||||||||||||||||||||||||||||||||||
| Key | Cars | Light Commercial Vehicles | Heavy Commercial Vehicles | Heavy Buses | |||||||||||||||||||||||||||||||||||||||||||||||||||||||||||||||||||||||||||||||||||||||||||||||||||||||||||||||||||
| 1. Toyota | 8,557,351 | ||||||||||||||||||||||||||||||||||||||||||||||||||||||||||||||||||||||||||||||||||||||||||||||||||||||||||||||||||||||
| 2. General Motors | 8,476,192 | ||||||||||||||||||||||||||||||||||||||||||||||||||||||||||||||||||||||||||||||||||||||||||||||||||||||||||||||||||||||
| 3. Volkswagen Group | 7,341,065 | ||||||||||||||||||||||||||||||||||||||||||||||||||||||||||||||||||||||||||||||||||||||||||||||||||||||||||||||||||||||
| 4. Hyundai / Kia | 5,764,918 | ||||||||||||||||||||||||||||||||||||||||||||||||||||||||||||||||||||||||||||||||||||||||||||||||||||||||||||||||||||||
| 5. Ford | 4,988,031 | ||||||||||||||||||||||||||||||||||||||||||||||||||||||||||||||||||||||||||||||||||||||||||||||||||||||||||||||||||||||
| 6. Nissan | 3,982,162 | ||||||||||||||||||||||||||||||||||||||||||||||||||||||||||||||||||||||||||||||||||||||||||||||||||||||||||||||||||||||
| 7. Honda | 3,643,057 | ||||||||||||||||||||||||||||||||||||||||||||||||||||||||||||||||||||||||||||||||||||||||||||||||||||||||||||||||||||||
| 8. PSA Peugeot Citroën | 3,605,524 | ||||||||||||||||||||||||||||||||||||||||||||||||||||||||||||||||||||||||||||||||||||||||||||||||||||||||||||||||||||||
| 9. Suzuki | 2,892,945 | ||||||||||||||||||||||||||||||||||||||||||||||||||||||||||||||||||||||||||||||||||||||||||||||||||||||||||||||||||||||
| 10. Renault | 2,716,286 | ||||||||||||||||||||||||||||||||||||||||||||||||||||||||||||||||||||||||||||||||||||||||||||||||||||||||||||||||||||||
| 11. Fiat | 2,410,021 | ||||||||||||||||||||||||||||||||||||||||||||||||||||||||||||||||||||||||||||||||||||||||||||||||||||||||||||||||||||||
| 12. Daimler | 1,940,465 | ||||||||||||||||||||||||||||||||||||||||||||||||||||||||||||||||||||||||||||||||||||||||||||||||||||||||||||||||||||||
| 13. Chrysler | 1,578,488 | ||||||||||||||||||||||||||||||||||||||||||||||||||||||||||||||||||||||||||||||||||||||||||||||||||||||||||||||||||||||
| 14. BMW | 1,481,253 | ||||||||||||||||||||||||||||||||||||||||||||||||||||||||||||||||||||||||||||||||||||||||||||||||||||||||||||||||||||||
| 15. Mazda | 1,307,540 | ||||||||||||||||||||||||||||||||||||||||||||||||||||||||||||||||||||||||||||||||||||||||||||||||||||||||||||||||||||||
| 16. Mitsubishi | 1,174,383 | ||||||||||||||||||||||||||||||||||||||||||||||||||||||||||||||||||||||||||||||||||||||||||||||||||||||||||||||||||||||
| 17. Changan | 1,102,683 | 2,378,052 | |||||||||||||||||||||||||||||||||||||||||||||||||||||||||||||||||||||||||||||||||||||||||||||||||||||||||||||||||||||
| 18. Tata | 1,011,343 | ||||||||||||||||||||||||||||||||||||||||||||||||||||||||||||||||||||||||||||||||||||||||||||||||||||||||||||||||||||||
| 19. FAW | 896,060 | 2,572,260 | |||||||||||||||||||||||||||||||||||||||||||||||||||||||||||||||||||||||||||||||||||||||||||||||||||||||||||||||||||||
| 20. Geely | 802,319 | ||||||||||||||||||||||||||||||||||||||||||||||||||||||||||||||||||||||||||||||||||||||||||||||||||||||||||||||||||||||
| Key | Cars | Light Commercial Vehicles | Heavy Commercial Vehicles | Heavy Buses | |||||||||||||||||||||||||||||||||||||||||||||||||||||||||||||||||||||||||||||||||||||||||||||||||||||||||||||||||||
| Total: 77,743,862 | Cars: 60,343,756 | LCV: 13,370,432 | HCV: 3,510,681 | Heavy Bus: 518,993 | |||||||||||||||||||||||||||||||||||||||||||||||||||||||||||||||||||||||||||||||||||||||||||||||||||||||||||||||||||
| Numbers in italics are including joint ventures | |||||||||||||||||||||||||||||||||||||||||||||||||||||||||||||||||||||||||||||||||||||||||||||||||||||||||||||||||||||||
| Reference: "World motor vehicle production by manufacturer: World ranking of manufacturers 2010" (PDF). OICA. August 2011. | |||||||||||||||||||||||||||||||||||||||||||||||||||||||||||||||||||||||||||||||||||||||||||||||||||||||||||||||||||||||
2009
| Total motor vehicle production | |||||||||||||||||||||||||||||||||||||||||||||||||||||||||||||||||||||||||||||||||||||||||||||||||||||||||||||||||||||||
| Group | 1,000,000 | 2,000,000 | 3,000,000 | 4,000,000 | 5,000,000 | 6,000,000 | 7,000,000 | 8,000,000 | 9,000,000 | 10,000,000 | |||||||||||||||||||||||||||||||||||||||||||||||||||||||||||||||||||||||||||||||||||||||||||||||||||||||||||||
| Key | Cars | Light Commercial Vehicles | Heavy Commercial Vehicles | Heavy Buses | |||||||||||||||||||||||||||||||||||||||||||||||||||||||||||||||||||||||||||||||||||||||||||||||||||||||||||||||||||
| 1. Toyota | 7,234,439 | ||||||||||||||||||||||||||||||||||||||||||||||||||||||||||||||||||||||||||||||||||||||||||||||||||||||||||||||||||||||
| 2. General Motors | 6,459,053 | ||||||||||||||||||||||||||||||||||||||||||||||||||||||||||||||||||||||||||||||||||||||||||||||||||||||||||||||||||||||
| 3. Volkswagen Group | 6,067,208 | ||||||||||||||||||||||||||||||||||||||||||||||||||||||||||||||||||||||||||||||||||||||||||||||||||||||||||||||||||||||
| 4. Ford | 4,685,394 | ||||||||||||||||||||||||||||||||||||||||||||||||||||||||||||||||||||||||||||||||||||||||||||||||||||||||||||||||||||||
| 5. Hyundai / Kia | 4,645,776 | ||||||||||||||||||||||||||||||||||||||||||||||||||||||||||||||||||||||||||||||||||||||||||||||||||||||||||||||||||||||
| 6. PSA Peugeot Citroën | 3,042,311 | ||||||||||||||||||||||||||||||||||||||||||||||||||||||||||||||||||||||||||||||||||||||||||||||||||||||||||||||||||||||
| 7. Honda | 3,012,637 | ||||||||||||||||||||||||||||||||||||||||||||||||||||||||||||||||||||||||||||||||||||||||||||||||||||||||||||||||||||||
| 8. Nissan | 2,744,562 | ||||||||||||||||||||||||||||||||||||||||||||||||||||||||||||||||||||||||||||||||||||||||||||||||||||||||||||||||||||||
| 9. Fiat | 2,460,222 | ||||||||||||||||||||||||||||||||||||||||||||||||||||||||||||||||||||||||||||||||||||||||||||||||||||||||||||||||||||||
| 10. Suzuki | 2,387,537 | ||||||||||||||||||||||||||||||||||||||||||||||||||||||||||||||||||||||||||||||||||||||||||||||||||||||||||||||||||||||
| 11. Renault | 2,296,009 | ||||||||||||||||||||||||||||||||||||||||||||||||||||||||||||||||||||||||||||||||||||||||||||||||||||||||||||||||||||||
| 12. Daimler | 1,447,953 | ||||||||||||||||||||||||||||||||||||||||||||||||||||||||||||||||||||||||||||||||||||||||||||||||||||||||||||||||||||||
| 13. Changan | 1,425,777 | ||||||||||||||||||||||||||||||||||||||||||||||||||||||||||||||||||||||||||||||||||||||||||||||||||||||||||||||||||||||
| 14. BMW | 1,258,417 | ||||||||||||||||||||||||||||||||||||||||||||||||||||||||||||||||||||||||||||||||||||||||||||||||||||||||||||||||||||||
| 15. Mazda | 984,520 | ||||||||||||||||||||||||||||||||||||||||||||||||||||||||||||||||||||||||||||||||||||||||||||||||||||||||||||||||||||||
| 16. Chrysler | 959,070 | ||||||||||||||||||||||||||||||||||||||||||||||||||||||||||||||||||||||||||||||||||||||||||||||||||||||||||||||||||||||
| 17. Mitsubishi | 802,463 | ||||||||||||||||||||||||||||||||||||||||||||||||||||||||||||||||||||||||||||||||||||||||||||||||||||||||||||||||||||||
| 18. Beijing Automotive | 684,534 | ||||||||||||||||||||||||||||||||||||||||||||||||||||||||||||||||||||||||||||||||||||||||||||||||||||||||||||||||||||||
| 19. Tata | 672,045 | ||||||||||||||||||||||||||||||||||||||||||||||||||||||||||||||||||||||||||||||||||||||||||||||||||||||||||||||||||||||
| 20. Dongfeng Motor | 663,262 | ||||||||||||||||||||||||||||||||||||||||||||||||||||||||||||||||||||||||||||||||||||||||||||||||||||||||||||||||||||||
| Key | Cars | Light Commercial Vehicles | Heavy Commercial Vehicles | Heavy Buses | |||||||||||||||||||||||||||||||||||||||||||||||||||||||||||||||||||||||||||||||||||||||||||||||||||||||||||||||||||
| Total: 60,499,159 | Cars: 51,075,480 | LCV: 7,817,520 | HCV: 1,305,755 | Heavy Bus: 300,404 | |||||||||||||||||||||||||||||||||||||||||||||||||||||||||||||||||||||||||||||||||||||||||||||||||||||||||||||||||||
| Reference: "World motor vehicle production by manufacturer: World ranking of manufacturers 2009" (PDF). OICA. July 2010. | |||||||||||||||||||||||||||||||||||||||||||||||||||||||||||||||||||||||||||||||||||||||||||||||||||||||||||||||||||||||
2008
This is a list of the 20 largest automotive manufacturers, ranked by their production volume in 2008.[23]
| Rank | Group | Country | Vehicles |
|---|---|---|---|
| 1 | Toyota | Japan | 9,237,780 |
| 2 | General Motors | United States | 8,282,803 |
| 3 | Volkswagen Group | Germany | 6,437,414 |
| 4 | Ford | United States | 5,407,000 |
| 5 | Hyundai / Kia[lower-alpha 3] | South Korea | 4,172,461 |
| 6 | Honda | Japan | 3,912,700 |
| 7 | Nissan | Japan | 3,395,065 |
| 8 | PSA Peugeot Citroën | France | 3,325,407 |
| 9 | Suzuki | Japan | 2,623,567 |
| 10 | Fiat | Italy | 2,524,325 |
| 11 | Renault | France | 2,417,351 |
| 12 | Daimler | Germany | 2,174,299 |
| 13 | Chrysler | United States | 1,893,068 |
| 14 | BMW | Germany | 1,439,918 |
| 15 | Mazda | Japan | 1,349,274 |
| 16 | Mitsubishi | Japan | 1,309,231 |
| 17 | AvtoVAZ | Russia | 801,563 |
| 18 | Tata | India | 798,265 |
| 19 | FAW Group[lower-alpha 5] | China | 637,720 |
| 20 | Subaru | Japan | 616,497 |
2007
This is a list of the 20 largest automotive manufacturers, ranked by their production volume in 2007.[24]
| Rank | Group | Country | Vehicles |
|---|---|---|---|
| 1 | General Motors | United States | 9,349,818 |
| 2 | Toyota (with Daihatsu and Hino)[lower-alpha 1] | Japan | 8,534,690 (9,497,754) |
| 3 | Volkswagen Group | Germany | 6,267,891 |
| 4 | Ford | United States | 6,247,506 |
| 5 | Hyundai / Kia[lower-alpha 3] | South Korea | 3,987,055 |
| 6 | Honda | Japan | 3,911,814 |
| 7 | PSA Peugeot Citroën | France | 3,457,385 |
| 8 | Nissan | Japan | 3,431,398 |
| 9 | Fiat | Italy | 2,679,451 |
| 10 | Renault | France | 2,669,040 |
| 11 | Suzuki | Japan | 2,596,316 |
| 12 | Chrysler | United States | 2,538,624 |
| 13 | Daimler | Germany | 2,096,977 |
| 14 | BMW | Germany | 1,541,503 |
| 15 | Mitsubishi | Japan | 1,411,975 |
| 16 | Mazda | Japan | 1,286,730 |
| 17 | Daihatsu | Japan | 856,171 |
| 18 | AvtoVAZ | Russia | 735,897 |
| 19 | FAW Group[lower-alpha 5] | China | 690,712 |
| 20 | Tata | India | 588,158 |
2006
This is a list of the 20 largest automotive manufacturers, ranked by their production volume in 2006.[25]
| Rank | Group | Country | Vehicles |
|---|---|---|---|
| 1 | General Motors | United States | 8,965,305 |
| 2 | Toyota (with Daihatsu and Hino)[lower-alpha 1] | Japan | 8,036,010 (9,221,357) |
| 3 | Ford | United States | 6,506,847 |
| 4 | Volkswagen Group | Germany | 5,684,603 |
| 5 | Hyundai / Kia[lower-alpha 3] | South Korea | 3,775,749 |
| 6 | Honda | Japan | 3,669,514 |
| 7 | PSA Peugeot Citroën | France | 3,356,859 |
| 8 | Nissan[lower-alpha 6][26] | Japan | 3,266,205 |
| 9 | Chrysler | United States | 2,544,590 |
| 10 | Renault | France | 2,543,649 |
| 11 | Fiat | Italy | 2,319,642 |
| 12 | Suzuki | Japan | 2,297,277 |
| 13 | Daimler | Germany | 2,044,533 |
| 14 | Mazda | Japan | 1,396,412 |
| 15 | BMW | Germany | 1,366,838 |
| 16 | Mitsubishi | Japan | 1,313,409 |
| 17 | Daihatsu | Japan | 1,084,721 |
| 18 | AvtoVAZ | Russia | 765,627 |
| 19 | Subaru | Japan | 587,274 |
| 20 | Tata | India | 561,761 |
2005
This is a list of the 20 largest automotive manufacturers, ranked by their production volume in 2005.[8]
| Rank | Group | Country | Total | Cars | LCV | HCV | Buses |
|---|---|---|---|---|---|---|---|
| 1 | General Motors | United States | 9,097,855 | 5,657,225 | 3,383,084 | 46,786 | 10,760 |
| 2 | Toyota (with Daihatsu and Hino)[lower-alpha 1] | Japan | 7,338,314 (8,446,944) | 6,157,038 (6,960,214) | 943,129 (1,143,245) | 185,910 (285,979) | 52,237 (57,506) |
| 3 | Ford | United States | 6,497,746 | 3,514,496 | 2,903,920 | 79,330 | |
| 4 | Volkswagen Group | Germany | 5,211,413 | 4,979,487 | 193,864 | 32,563 | 5,499 |
| 5 | DaimlerChrysler | Germany / United States | 4,815,593 | 1,965,410 | 2,353,989 | 435,535 | 60,659 |
| 6 | Nissan[lower-alpha 6] | Japan | 3,535,345 | 2,697,362 | 651,301 | 179,105 | 7,577 |
| 7 | Honda | Japan | 3,436,164 | 3,324,282 | 48,642 | 63,240 | |
| 8 | PSA Peugeot Citroën | France | 3,375,366 | 2,982,690 | 392,676 | ||
| 9 | Hyundai / Kia | South Korea | 3,091,060 | 2,726,600 | 126,836 | 137,995 | 99,629 |
| 10 | Renault | France | 2,616,818 | 2,195,162 | 421,656 | ||
| 11 | Suzuki | Japan | 2,071,707 | 1,723,022 | 348,685 | ||
| 12 | Fiat | Italy | 2,037,695 | 1,539,576 | 394,900 | 81,632 | 21,587 |
| 13 | Mitsubishi | Japan | 1,331,060 | 998,043 | 328,992 | 4,025 | |
| 14 | BMW | Germany | 1,323,119 | 1,323,119 | |||
| 15 | Mazda | Japan | 1,287,561 | 1,091,756 | 193,374 | 2,431 | |
| 16 | Daihatsu | Japan | 1,011,249 | 803,176 | 194,877 | 13,196 | |
| 17 | AvtoVAZ | Russia | 721,492 | 721,492 | |||
| 18 | Dongfeng[lower-alpha 7] | China | 593,055 | 403,055 | 180,000 | 10,000 | |
| 19 | Subaru | Japan | 591,825 | 508,281 | 83,544 | ||
| 20 | BAIC[lower-alpha 8] | China | 559,190 | 559,190 |
2004
This is a list of the 20 largest automotive manufacturers, ranked by their production volume in 2004.[7]
| Rank | Group | Country | Total | Cars | LCV | HCV | Buses |
|---|---|---|---|---|---|---|---|
| 1 | General Motors (with GM Daewoo)[lower-alpha 9] | United States | 8,066,536 (8,965,476) | 4,502,680 (5,372,062) | 3,530,767 (3,545,769) | 33,089 (36,850) | — (10,795) |
| 2 | Toyota (with Daihatsu and Hino)[lower-alpha 1] | Japan | 6,814,554 (7,874,694) | 5,869,629 (6,654,795) | 676,399 (853,805) | 230,511 (321,763) | 38,015 (44,331) |
| 3 | Ford | United States | 6,644,024 | 3,497,334 | 3,071,784 | 73,780 | 1,126 |
| 4 | Volkswagen Group | Germany | 5,095,480 | 4,892,529 | 168,840 | 29,212 | 4,899 |
| 5 | DaimlerChrysler | Germany / United States | 4,627,883 | 1,913,693 | 2,368,437 | 298,708 | 47,045 |
| 6 | PSA Peugeot Citroën | France | 3,405,245 | 3,004,710 | 400,535 | ||
| 7 | Honda | Japan | 3,237,434 | 3,183,269 | 54,165 | ||
| 8 | Nissan[lower-alpha 6] | Japan | 3,230,326 | 2,423,893 | 616,278 | 184,074 | 6,081 |
| 9 | Hyundai / Kia | South Korea | 2,766,321 | 2,377,546 | 146,883 | 128,655 | 113,237 |
| 10 | Renault | France | 2,471,654 | 2,163,620 | 308,034 | ||
| 11 | Fiat | Italy | 2,119,717 | 1,583,501 | 385,207 | 119,821 | 31,188 |
| 12 | Suzuki | Japan | 1,976,824 | 1,639,366 | 337,458 | ||
| 13 | Mitsubishi | Japan | 1,428,563 | 1,110,679 | 310,749 | 7,135 | |
| 14 | Mazda | Japan | 1,275,080 | 1,042,849 | 228,069 | 4,162 | |
| 15 | BMW | Germany | 1,250,345 | 1,250,345 | |||
| 16 | Daihatsu | Japan | 965,295 | 785,166 | 172,731 | 7,398 | |
| 17 | GM Daewoo | South Korea | 898,940 | 869,382 | 15,002 | 3,761 | 10,795 |
| 18 | AvtoVAZ | Russia | 717,985 | 717,985 | |||
| 19 | Subaru | Japan | 601,205 | 512,953 | 88,252 | ||
| 20 | FAW Group[lower-alpha 5] | China | 587,427 | 50,009 | 403,218 | 125,007 | 9,193 |
See also
Notes
- Daihatsu (100%) and Hino (50.1%) are subsidiaries of Toyota. OICA listed them combined until 2002, separately from 2003 to 2007, and combined again since 2008.
- Truck producers Scania AB and M.A.N. were included by OICA in group totals for 2011[4] and 2012,[5] then removed for the following years;[6] they are excluded from the chart for consistency.
- Hyundai and Kia have operated as a group since 1998 when Hyundai first took 51% control of Kia. However OICA listed their manufacturing figures separately from 2006 to 2008; they are combined here for consistency with previous and subsequent years.
- Including production figures from the Chinese SAIC-GM-Wuling joint venture,[20] which the OICA left out from the 2015 and 2016 GM total contrary to prior practice; they are combined here to allow for consistent comparison with previous years.
- FAW production excluding joint ventures with Volkswagen, Toyota and Mazda
- Including production figures from Nissan Diesel as a Nissan subsidiary until 2006 (sold to Volvo in 2007).
- Dongfeng production excluding joint venture with Citroën
- BAIC production excluding joint ventures with Hyundai and Isuzu
- GM Daewoo is a 96% subsidiary of General Motors. OICA listed it separately until 2004, then combined since 2005.
References
- "Definitions" (PDF). OICA. Retrieved 25 March 2014.
- "World motor vehicle production by manufacturer – World ranking 2000" (PDF). OICA. Retrieved April 15, 2017.
- "World motor vehicle production by manufacturer, make, country and type – Year 2000, Groupe VW" (PDF). OICA. Retrieved April 15, 2017.
- "World motor vehicle production by manufacturer – Group: Volkswagen, Year 2011" (PDF). OICA. Retrieved April 15, 2017.
- "World motor vehicle production by manufacturer – Group: Volkswagen, Year 2012" (PDF). OICA. Retrieved April 15, 2017.
- "World motor vehicle production by manufacturer – Group: Volkswagen, Year 2013" (PDF). OICA. Retrieved April 15, 2017.
- "World motor vehicle production by manufacturer – World ranking 2004" (PDF). OICA. June 2007. Retrieved April 3, 2017.
- "World motor vehicle production by manufacturer – World ranking 2005" (PDF). OICA. June 2007. Retrieved April 3, 2017.
- "World motor vehicle production by manufacturer without double counts – 2009, Group: G.M." (PDF). OICA. Retrieved April 15, 2017.
- "Saab sale - full details". Autocar. UK. 26 January 2010. Archived from the original on 1 February 2010. Retrieved 15 April 2017.
- "World Motor Vehicle Production: World Ranking of Manufacturers, Year 2014" (PDF). OICA. Retrieved 2017-04-02.
- "World Motor Vehicle Production: World Ranking of Manufacturers, Year 2015" (PDF). OICA. Retrieved 2017-04-02.
- Frost, Lawrence; Taylor, Edward (6 March 2017). "PSA targets Opel turnaround as GM exits Europe". Reuters. Retrieved 10 March 2017.
- "World motor vehicle production by manufacturer without double counts – 2007, Group: Ford" (PDF). OICA. Retrieved April 15, 2017.
- "World motor vehicle production by manufacturer without double counts – 2008, Group: Tata" (PDF). OICA. Retrieved April 15, 2017.
- "World motor vehicle production by manufacturer without double counts – 2009, Group: Ford" (PDF). OICA. Retrieved April 15, 2017.
- "World motor vehicle production by manufacturer without double counts – 2010, Group: Geely" (PDF). OICA. Retrieved April 15, 2017.
- "World Motor Vehicle Production: World Ranking of Manufacturers, Year 2017" (PDF). OICA. Retrieved 5 May 2019.
- "World Motor Vehicle Production: World Ranking of Manufacturers, Year 2016" (PDF). OICA. Retrieved 2017-10-17.
- See SGMW in "World Motor Vehicle Production: Group SAIC, Years 2015 and 2016" (PDF). OICA. Retrieved 2017-11-03.
- "World Motor Vehicle Production: World Ranking of Manufacturers, Year 2013" (PDF). OICA. Archived from the original (PDF) on 2016-04-05. Retrieved 2017-04-02.
- "World Motor Vehicle Production: World Ranking of Manufacturers, Year 2012" (PDF). OICA. Retrieved 2017-04-02.
- "World motor vehicle production by manufacturer – World ranking of manufacturesrs – Year 2008" (PDF). OICA. Retrieved April 3, 2017.
- "World motor vehicle production by manufacturer – World ranking of manufacturesrs – Year 2007" (PDF). OICA. Retrieved April 3, 2017.
- "World motor vehicle production by manufacturer – World ranking of manufacturesrs – Year 2006" (PDF). OICA. July 2008. Retrieved April 3, 2017.
- "World Motor Vehicle Production: Nissan Diesel, Year 2006" (PDF). OICA. July 2007. Retrieved April 3, 2017.
| By country |
| ||||||||||||
|---|---|---|---|---|---|---|---|---|---|---|---|---|---|
| Data | |||||||||||||
| History |
| ||||||||||||
| Manufacturers | |||||||||||||
| Organisations | |||||||||||||
| Related topics |
| ||||||||||||