List of countries by Fragile States Index
This is a list of countries by order of appearance in the Fragile States Index (formerly the Failed States Index) of the United States think tank Fund for Peace.
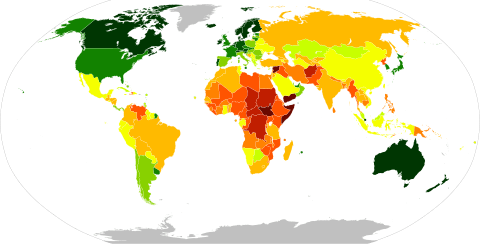
A fragile state has several attributes. Common indicators include a state whose central government is so weak or ineffective that it has little practical control over much of its territory; non-provision of public services; widespread corruption and criminality; refugees and involuntary movement of populations; and sharp economic decline.[1] Since 2005, the index has been published annually by the Fund for Peace and the magazine Foreign Policy. The list has been cited by journalists and academics in making broad comparative points about countries or regions.[2][3]
This is the list for 2020,[4] with comparisons of each country's current score to previous years' indices.
The report uses 12 factors to determine the rating for each nation, including security threats, economic implosion, human rights violations and refugee flows.
Indicators of a fragile state
The following factors are used by Fund For Peace to ascertain the status of a country.[5]
Social
- Mounting demographic pressures and tribal, ethnic and/or religious conflicts.
- Massive internal and external displacement of refugees, creating severe humanitarian emergencies.
- Widespread vengeance-seeking group grievances.
- Chronic and sustained human flight.
Economic
- Widespread corruption
- High economic inequality
- Uneven economic development along group lines.
- Severe economic decline.
Political
- Delegitimization of the state.
- Deterioration of public services.
- Suspension or arbitrary application of law; widespread human rights abuses.
- Security forces operating as a "state within a state" often with impunity.
- Rise of factionalized elites.
- Intervention of external political agents and foreign states.
Fragile States Index 2013–2020
- Very high alert
| Rank | Country | 2020 score[4] | Change from 2019[6] | Change from 2018[7] | Change from 2017[8] | Change from 2016[9] | Change from 2015[10] | Change from 2014 | Change from 2013[12] |
|---|---|---|---|---|---|---|---|---|---|
| 1 | 112.4 | ||||||||
| 2 | 110.9 | ||||||||
| 3 | 110.8 | ||||||||
| 4 | 110.7 |
- High alert
| Rank | Country | 2020 score | Change from 2019 | Change from 2018 | Change from 2017 | Change from 2016 | Change from 2015 | Change from 2014 | Change from 2013 |
|---|---|---|---|---|---|---|---|---|---|
| 5 | 109.4 | ||||||||
| 6 | 107.5 | ||||||||
| 7 | 106.4 | ||||||||
| 8 | 104.8 | ||||||||
| 9 | 102.9 |
- Alert
| Rank | Country | 2020 score | Change from 2019 | Change from 2018 | Change from 2017 | Change from 2016 | Change from 2015 | Change from 2014 | Change from 2013 |
|---|---|---|---|---|---|---|---|---|---|
| 10 | 99.2 | ||||||||
| 11 | 97.9 | ||||||||
| 12 | 97.9 | ||||||||
| 13 | 97.7 | ||||||||
| 14 | 97.3 | ||||||||
| 15 | 97.2 | ||||||||
| 16 | 96.0 | ||||||||
| 17 | 95.9 | ||||||||
| 18 | 95.8 | ||||||||
| 19 | 95.3 | ||||||||
| 20 | 95.2 | ||||||||
| 21 | 94.6 | ||||||||
| 22 | 94.0 | ||||||||
| 23 | 92.9 | ||||||||
| 24 | 92.8 | ||||||||
| 25 | 92.1 | ||||||||
| 25 | 92.1 | ||||||||
| 27 | 91.7 | ||||||||
| 28 | 91.2 | ||||||||
| 29 | 90.3 | ||||||||
| 30 | 90.2 | ||||||||
| 31 | 90.0 |
- High warning
| Rank | Country | 2020 score | Change from 2019 | Change from 2018 | Change from 2017 | Change from 2016 | Change from 2015 | Change from 2014 | Change from 2013 |
|---|---|---|---|---|---|---|---|---|---|
| 32 | 89.7 | ||||||||
| 33 | 88.7 | ||||||||
| 34 | 87.3 | ||||||||
| 35 | 86.0 | ||||||||
| 35 | 86.0 | ||||||||
| 37 | 85.9 | ||||||||
| 38 | 85.8 | ||||||||
| 39 | 85.7 | ||||||||
| 40 | 84.7 | ||||||||
| 41 | 84.5 | ||||||||
| 42 | 84.4 | ||||||||
| 43 | 84.0 | ||||||||
| 44 | 83.4 | ||||||||
| 45 | 83.0 | ||||||||
| 45 | 83.0 | ||||||||
| 47 | 82.7 | ||||||||
| 47 | 82.7 | ||||||||
| 49 | 82.6 | ||||||||
| 50 | 82.3 | ||||||||
| 51 | 82.2 | ||||||||
| 52 | 81.8 | ||||||||
| 53 | 81.2 | ||||||||
| 54 | 81.0 | ||||||||
| 55 | 80.3 |
- Elevated warning
| Rank | Country | 2020 score | Change from 2019 | Change from 2018 | Change from 2017 | Change from 2016 | Change from 2015 | Change from 2014 | Change from 2013 |
|---|---|---|---|---|---|---|---|---|---|
| 56 | 79.7 | ||||||||
| 57 | 79.2 | ||||||||
| 58 | 79.5 | ||||||||
| 59 | 79.1 | ||||||||
| 60 | 78.3 | ||||||||
| 61 | 78.1 | ||||||||
| 62 | 77.1 | ||||||||
| 63 | 76.9 | ||||||||
| 64 | 76.8 | ||||||||
| 65 | 76.6 | ||||||||
| 66 | 75.5 | ||||||||
| 67 | 75.4 | ||||||||
| 68 | 75.3 | ||||||||
| 69 | (weighted average) | 75.1 | |||||||
| 70 | 75.0 | ||||||||
| 71 | 74.6 | ||||||||
| 71 | 74.6 | ||||||||
| 73 | 73.9 | ||||||||
| 74 | 73.1 | ||||||||
| 75 | 73.0 | ||||||||
| 76 | 72.6 | ||||||||
| 77 | 72.5 | ||||||||
| 78 | 71.3 | ||||||||
| 79 | 71.2 | ||||||||
| 79 | 71.2 | ||||||||
| 79 | 71.2 | ||||||||
| 82 | 70.8 | ||||||||
| 83 | 70.3 | ||||||||
| 84 | 70.2 | ||||||||
| 85 | 70.1 |
- Warning
| Rank | Country | 2020 score | Change from 2019 | Change from 2018 | Change from 2017 | Change from 2016 | Change from 2015 | Change from 2014 | Change from 2013 |
|---|---|---|---|---|---|---|---|---|---|
| 86 | 69.9 | ||||||||
| 86 | 69.9 | ||||||||
| 88 | 69.5 | ||||||||
| 89 | 69.4 | ||||||||
| 90 | 69.1 | ||||||||
| 90 | 69.1 | ||||||||
| 93 | 69.0 | ||||||||
| 93 | 68.9 | ||||||||
| 94 | 68.8 | ||||||||
| 95 | 68.1 | ||||||||
| 96 | 67.8 | ||||||||
| 97 | 67.6 | ||||||||
| 98 | 67.2 | ||||||||
| 99 | 66.2 | ||||||||
| 100 | 66.1 | ||||||||
| 101 | 66.0 | ||||||||
| 101 | 66.0 | ||||||||
| 103 | 65.8 | ||||||||
| 104 | 65.2 | ||||||||
| 105 | 65.1 | ||||||||
| 106 | 64.8 | ||||||||
| 107 | 64.4 | ||||||||
| 108 | 64.2 | ||||||||
| 108 | 64.2 | ||||||||
| 110 | 63.9 | ||||||||
| 110 | 63.9 | ||||||||
| 112 | 63.3 | ||||||||
| 113 | 62.1 | ||||||||
| 114 | 60.8 | ||||||||
| 115 | 60.1 | ||||||||
| 116 | 60.0 |
- Stable
| Rank | Country | 2020 score | Change from 2019 | Change from 2018 | Change from 2017 | Change from 2016 | Change from 2015 | Change from 2014 | Change from 2013 |
|---|---|---|---|---|---|---|---|---|---|
| 117 | 59.8 | ||||||||
| 118 | 59.2 | ||||||||
| 119 | 58.8 | ||||||||
| 120 | 57.6 | ||||||||
| 121 | 57.1 | ||||||||
| 122 | 56.6 | ||||||||
| 123 | 56.1 | ||||||||
| 124 | 55.5 | ||||||||
| 125 | 55.2 | ||||||||
| 126 | 54.7 | ||||||||
| 127 | 52.1 | ||||||||
| 127 | 52.1 | ||||||||
| 129 | 51.9 | ||||||||
| 129 | 51.9 | ||||||||
| 131 | 50.9 |
- More stable
| Rank | Country | 2020 score | Change from 2019 | Change from 2018 | Change from 2017 | Change from 2016 | Change from 2015 | Change from 2014 | Change from 2013 |
|---|---|---|---|---|---|---|---|---|---|
| 132 | 49.9 | ||||||||
| 133 | 49.2 | ||||||||
| 134 | 48.0 | ||||||||
| 135 | 47.6 | ||||||||
| 136 | 46.7 | ||||||||
| 137 | 46.4 | ||||||||
| 138 | 46.1 | ||||||||
| 139 | 46.1 | ||||||||
| 140 | 46.0 | ||||||||
| 141 | 43.7 | ||||||||
| 142 | 42.5 | ||||||||
| 143 | 42.4 | ||||||||
| 144 | 42.3 | ||||||||
| 145 | 41.0 | ||||||||
| 146 | 40.4 | ||||||||
| 147 | 40.2 |
- Very stable
| Rank | Country | 2020 score | Change from 2019 | Change from 2018 | Change from 2017 | Change from 2016 | Change from 2015 | Change from 2014 | Change from 2013 |
|---|---|---|---|---|---|---|---|---|---|
| 148 | 38.5 | ||||||||
| 149 | 38.3 | ||||||||
| 149 | 38.3 | ||||||||
| 151 | 38.2 | ||||||||
| 152 | 38.1 | ||||||||
| 153 | 37.2 | ||||||||
| 154 | 36.5 | ||||||||
| 155 | 35.7 | ||||||||
| 156 | 33.6 | ||||||||
| 157 | 33.4 | ||||||||
| 158 | 32.3 | ||||||||
| 159 | 32.0 | ||||||||
| 160 | 30.5 |
- Sustainable
| Rank | Country | 2020 score | Change from 2019 | Change from 2018 | Change from 2017 | Change from 2016 | Change from 2015 | Change from 2014 | Change from 2013 |
|---|---|---|---|---|---|---|---|---|---|
| 161 | 27.1 | ||||||||
| 162 | 26.3 | ||||||||
| 163 | 25.8 | ||||||||
| 164 | 24.1 | ||||||||
| 165 | 23.5 | ||||||||
| 166 | 23.2 | ||||||||
| 167 | 22.9 |
- Very sustainable
| Rank | Country | 2020 score | Change from 2019 | Change from 2018 | Change from 2017 | Change from 2016 | Change from 2015 | Change from 2014 | Change from 2013 |
|---|---|---|---|---|---|---|---|---|---|
| 168 | 19.9 | ||||||||
| 169 | 19.7 | ||||||||
| 170 | 18.8 | ||||||||
| 171 | 18.7 | ||||||||
| 172 | 18.2 | ||||||||
| 173 | 17.9 | ||||||||
| 174 | 17.8 | ||||||||
| 175 | 17.2 | ||||||||
| 176 | 17.1 | ||||||||
| 177 | 16.2 | ||||||||
| 178 | 14.6 |
Most improved and worsened countries
Following are the most improved and worsened countries in FSI 2019.[6] As per J.J. Messner, the executive director of the Fund for peace, countries improve at different paces and eventually face setbacks. However on average, world has been becoming less fragile every year.
| Most improved countries in 2019 | |||
|---|---|---|---|
| Rank | Country | 2019 score | Change from 2018 |
| 1 | 94.2 | ||
| 2 | 93.5 | ||
| 3 | 75.7 | ||
| 4 | 84.7 | ||
| 5 | 83.9 | ||
| 6 | 99.1 | ||
| 7 | 71.2 | ||
| 8 | 66.2 | ||
| 9 | 60.5 | ||
| 10 | 99.5 | ||
| 11 | 85.5 | ||
| 12 | 71.7 | ||
| 13 | 66.7 | ||
| Most worsened countries in 2019 | |||
|---|---|---|---|
| Rank | Country | 2019 score | Change from 2018 |
| 1 | 89.3 | ||
| 2 | 71.8 | ||
| 3 | 78.1 | ||
| 4 | 36.7 | ||
| 5 | 87.4 | ||
| 6 | 97.0 | ||
| 7 | 42.8 | ||
| 8 | 94.1 | ||
| 9 | 113.5 | ||
| 10 | 80.1 | ||
| 11 | 77.8 | ||
| 12 | 38.0 | ||
Following summarizes biggest long term improvements & losses by countries between 2009 and 2019. Former Soviet states have continued to dominate the list of most improved countries. Notably, among most improved countries, some continue to be restrictive and autocratic.
| Most improved countries (2009–19) | |||
|---|---|---|---|
| Rank | Country | 2019 score | Change from 2009 |
| 1 | 72.0 | ||
| 2 | 60.8 | ||
| 3 | 67.1 | ||
| 4 | 75.7 | ||
| 5 | 72.0 | ||
| 6 | 99.5 | ||
| 7 | 34.5 | ||
| 8 | 68.2 | ||
| 9 | 53.0 | ||
| 10 | 70.4 | ||
| 11 | 47.8 | ||
| 12 | 75.7 | ||
| 13 | 71.1 | ||
| 14 | 72.9 | ||
| 15 | 71.4 | ||
| 16 | 76.2 | ||
| 17 | 84.0 | ||
| 18 | 47.0 | ||
| 19 | 47.5 | ||
| 20 | 77.7 | ||
| Most worsened countries (2009–19) | |||
|---|---|---|---|
| Rank | Country | 2019 score | Change from 2009 |
| 1 | 92.2 | ||
| 2 | 111.5 | ||
| 3 | 94.1 | ||
| 4 | 113.5 | ||
| 5 | 89.3 | ||
| 6 | 88.7 | ||
| 7 | 53.9 | ||
| 8 | 96.4 | ||
| 9 | 83.9 | ||
| 10 | 63.8 | ||
| 11 | 85.1 | ||
| 12 | 38.0 | ||
| 13 | 71.1 | ||
| 14 | 108.9 | ||
| 15 | 36.7 | ||
| 16 | 34.3 | ||
| 17 | 77.2 | ||
| 18 | 85.3 | ||
| 19 | 87.8 | ||
| 20 | 50.0 | ||
References
- "What Does "State Fragility" Mean?". Fund for Peace. Retrieved 31 August 2015.
- "Failing States: SOS". The Economist. June 19, 2007. Retrieved 1 December 2012.
- Bloom, David E. (May 5, 2011). "Africa's Daunting Challenges". New York Times. Retrieved 1 December 2012.
- "Fragile States Index 2020". The Fund for Peace. 11 May 2020. Retrieved June 7, 2020.
- "Fragile States Index and CAST Framework Methodology". The Fund for Peace.
- "Fragile States Index 2019". The Fund for Peace. 10 April 2019. Retrieved June 9, 2019.
- "Fragile States Index 2018: Issues of Fragility Touch the World's Richest and Most Developed Countries in 2018". The Fund for Peace. 19 April 2018. Retrieved June 9, 2019.
- Fragile State Index 2017.The Fund for Peace
- Fragile State Index 2016.The Fund for Peace
- Fragile State Index 2015.The Fund for Peace
- Fragile State Index 2014.The Fund for Peace
- Fragile State Index 2013.The Fund for Peace