Economic inequality
There are a wide variety of types of economic inequality, most notably measured using the distribution of income (the amount of money people are paid) and the distribution of wealth (the amount of wealth people own). Besides economic inequality between countries or states, there are important types of economic inequality between different groups of people.[1]

Important types of economic measurements focus on wealth, income, and consumption. There are many methods for measuring economic inequality, with the Gini coefficient being a widely used one. Another type of measure is the Inequality-adjusted Human Development Index, which is a statistic composite index that takes inequality into account.[2] Important concepts of equality include equity, equality of outcome, and equality of opportunity.
Research suggests that greater inequality hinders economic growth, with land and human capital inequality reducing growth more than inequality of income.[3] Whereas globalization has reduced global inequality (between nations), it has increased inequality within nations.[4]
Measurements
In 1820, the ratio between the income of the top and bottom 20 percent of the world's population was three to one. By 1991, it was eighty-six to one.[5] A 2011 study titled "Divided we Stand: Why Inequality Keeps Rising" by the Organisation for Economic Co-operation and Development (OECD) sought to explain the causes for this rising inequality by investigating economic inequality in OECD countries; it concluded that following factors had a role:[6]
- Changes in the structure of households can play an important role. Single-headed households in OECD countries have risen from an average of 15% in the late 1980s to 20% in the mid-2000s, resulting in higher inequality.
- Assortative mating refers to the phenomenon of people marrying people with similar background, for example doctors marrying doctors rather than nurses. OECD found out that 40% of couples where both partners work belonged to the same or neighbouring earnings deciles compared with 33% some 20 years before.[7]
- In the bottom percentiles number of hours worked has decreased.[7]
- The main reason for increasing inequality seems to be the difference between the demand for and supply of skills.[7]
The study made the following conclusions about the level of economic inequality:
- Income inequality in OECD countries is at its highest level for the past half century. The ratio between the bottom 10% and the top 10% has increased from 1:7, to 1:9 in 25 years.[7]
- There are tentative signs of a possible convergence of inequality levels towards a common and higher average level across OECD countries.[7]
- With very few exceptions (France, Japan, and Spain), the wages of the 10% best-paid workers have risen relative to those of the 10% lowest paid.[7]
A 2011 OECD study investigated economic inequality in Argentina, Brazil, China, India, Indonesia, Russia and South Africa. It concluded that key sources of inequality in these countries include "a large, persistent informal sector, widespread regional divides (e.g. urban-rural), gaps in access to education, and barriers to employment and career progression for women."[7]
%2C_Credit_Suisse.png)
A study by the World Institute for Development Economics Research at United Nations University reports that the richest 1% of adults alone owned 40% of global assets in the year 2000. The three richest people in the world possess more financial assets than the lowest 48 nations combined.[8] The combined wealth of the "10 million dollar millionaires" grew to nearly $41 trillion in 2008.[9] A January 2014 report by Oxfam claims that the 85 wealthiest individuals in the world have a combined wealth equal to that of the bottom 50% of the world's population, or about 3.5 billion people.[10][11][12][13][14] According to a Los Angeles Times analysis of the report, the wealthiest 1% owns 46% of the world's wealth; the 85 richest people, a small part of the wealthiest 1%, own about 0.7% of the human population's wealth, which is the same as the bottom half of the population.[15] In January 2015, Oxfam reported that the wealthiest 1 percent will own more than half of the global wealth by 2016.[16][17] An October 2014 study by Credit Suisse also claims that the top 1% now own nearly half of the world's wealth and that the accelerating disparity could trigger a recession.[18]
In October 2015, Credit Suisse published a study which shows global inequality continues to increase, and that half of the world's wealth is now in the hands of those in the top percentile, whose assets each exceed $759,900.[19] A 2016 report by Oxfam claims that the 62 wealthiest individuals own as much wealth as the poorer half of the global population combined.[20] Oxfam's claims have however been questioned on the basis of the methodology used: by using net wealth (adding up assets and subtracting debts), the Oxfam report, for instance, finds that there are more poor people in the United States and Western Europe than in China (due to a greater tendency to take on debts).[21][22][23] Anthony Shorrocks, the lead author of the Credit Suisse report which is one of the sources of Oxfam's data, considers the criticism about debt to be a "silly argument" and "a non-issue … a diversion."[22] Oxfam's 2017 report says the top eight billionaires have as much wealth as the bottom half of the global population, and that rising inequality is suppressing wages, as businesses are focused on delivering higher returns to wealthy owners and executives.[24] In 2018, the Oxfam report said that the wealth gap continued to widen in 2017, with 82% of global wealth generated going to the wealthiest 1%.[25] The 2019 Oxfam report said that the poorest half of the human population has been losing wealth (around 11%) at the same time that a billionaire is minted every two days.[26] The 2020 report, while noting that 2,153 billionaires owned as much wealth as the bottom 4.6 billion people in 2019, highlighted the widening gap between genders largely as the result of unpaid care work performed by women, and stated that "our economic system was built by rich and powerful men, who continue to make the rules and reap the lion’s share of the benefit. Worldwide men own 50% more wealth than women."[27]
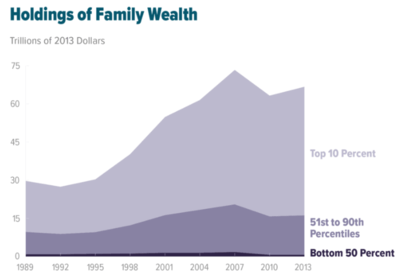
According to PolitiFact, the top 400 richest Americans "have more wealth than half of all Americans combined."[29][30][31][32] According to The New York Times on July 22, 2014, the "richest 1 percent in the United States now own more wealth than the bottom 90 percent".[14] Inherited wealth may help explain why many Americans who have become rich may have had a "substantial head start".[33][34] In September 2012, according to the Institute for Policy Studies (IPS), "over 60 percent" of the Forbes richest 400 Americans "grew up in substantial privilege".[35] A 2017 report by the IPS said that three individuals, Jeff Bezos, Bill Gates and Warren Buffett, own as much wealth as the bottom half of the population, or 160 million people, and that the growing disparity between the wealthy and the poor has created a "moral crisis", noting that "we have not witnessed such extreme levels of concentrated wealth and power since the first gilded age a century ago."[36][37] In 2016, the world's billionaires increased their combined global wealth to a record $6 trillion.[38] In 2017, they increased their collective wealth to 8.9 trillion.[39] In 2018, U.S. income inequality reached the highest level ever recorded by the Census Bureau.[40]
The existing data and estimates suggest a large increase in international (and more generally inter-macroregional) component between 1820 and 1960. It might have slightly decreased since that time at the expense of increasing inequality within countries.[41] The United Nations Development Programme in 2014 asserted that greater investments in social security, jobs and laws that protect vulnerable populations are necessary to prevent widening income inequality.[42]
There is a significant difference in the measured wealth distribution and the public's understanding of wealth distribution. Michael Norton of the Harvard Business School and Dan Ariely of the Department of Psychology at Duke University found this to be true in their research, done in 2011. The actual wealth going to the top quintile in 2011 was around 84% where as the average amount of wealth that the general public estimated to go to the top quintile was around 58%.[43]
Two researchers claim that global income inequality is decreasing, due to strong economic growth in developing countries.[44] However, the OECD reported in 2015 that income inequality is higher than it has ever been within OECD member nations and is at increased levels in many emerging economies.[45] According to a June 2015 report by the International Monetary Fund:
Widening income inequality is the defining challenge of our time. In advanced economies, the gap between the rich and poor is at its highest level in decades. Inequality trends have been more mixed in emerging markets and developing countries (EMDCs), with some countries experiencing declining inequality, but pervasive inequities in access to education, health care, and finance remain.[46]
In October 2017, the IMF warned that inequality within nations, in spite of global inequality falling in recent decades, has risen so sharply that it threatens economic growth and could result in further political polarization. The Fund's Fiscal Monitor report said that "progressive taxation and transfers are key components of efficient fiscal redistribution."[47] In October 2018 Oxfam published a Reducing Inequality Index which measured social spending, tax and workers' rights to show which countries were best at closing the gap between rich and poor.[48]
Wealth distribution within individual countries
The following table shows information about individual wealth distribution in different countries, from a 2018 report by Crédit Suisse.[49]
|
|
Income distribution within individual countries
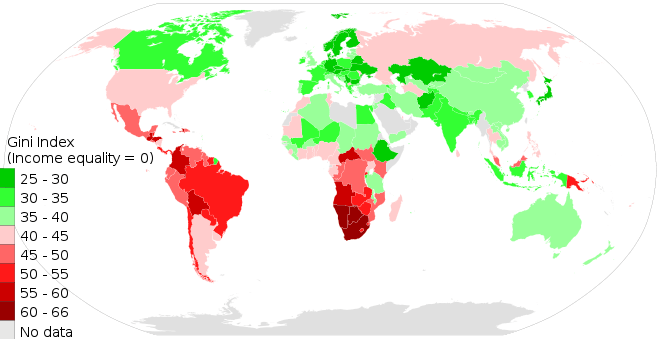
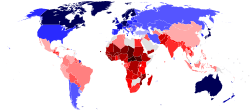
red = high, green = low inequality
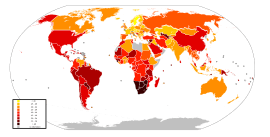
A Gini index value above 50 is considered high; countries including Brazil, Colombia, South Africa, Botswana, and Honduras can be found in this category. A Gini index value of 30 or above is considered medium; countries including Vietnam, Mexico, Poland, the United States, Argentina, Russia and Uruguay can be found in this category. A Gini index value lower than 30 is considered low; countries including Austria, Germany, Denmark, Slovenia, Sweden and Ukraine can be found in this category.[50]
Various proposed causes of economic inequality
There are various reasons for economic inequality within societies. Recent growth in overall income inequality, at least within the OECD countries, has been driven mostly by increasing inequality in wages and salaries.[6]
Economist Thomas Piketty argues that widening economic disparity is an inevitable phenomenon of free market capitalism when the rate of return of capital (r) is greater than the rate of growth of the economy (g).[51]
Labour market
A major cause of economic inequality within modern market economies is the determination of wages by the market. Where competition is imperfect; information unevenly distributed; opportunities to acquire education and skills unequal; market failure results. Since many such imperfect conditions exist in virtually every market, there is in fact little presumption that markets are in general efficient. This means that there is an enormous potential role for government to correct such market failures.[52]
Malthusian Argument
See Thomas Malthus
Taxes
Another cause is the rate at which income is taxed coupled with the progressivity of the tax system. A progressive tax is a tax by which the tax rate increases as the taxable base amount increases.[53][54][55][56][57] In a progressive tax system, the level of the top tax rate will often have a direct impact on the level of inequality within a society, either increasing it or decreasing it, provided that income does not change as a result of the change in tax regime. Additionally, steeper tax progressivity applied to social spending can result in a more equal distribution of income across the board.[58] Tax credits such as the Earned Income Tax Credit in the US can also decrease income inequality.[59] The difference between the Gini index for an income distribution before taxation and the Gini index after taxation is an indicator for the effects of such taxation.[60]
Education
An important factor in the creation of inequality is variation in individuals' access to education.[61] Education, especially in an area where there is a high demand for workers, creates high wages for those with this education.[62] However, increases in education first increase and then decrease growth as well as income inequality. As a result, those who are unable to afford an education, or choose not to pursue optional education, generally receive much lower wages. The justification for this is that a lack of education leads directly to lower incomes, and thus lower aggregate saving and investment. Conversely, education raises incomes and promotes growth because it helps to unleash the productive potential of the poor.
Economic liberalism, deregulation and decline of unions
John Schmitt and Ben Zipperer (2006) of the CEPR point to economic liberalism and the reduction of business regulation along with the decline of union membership as one of the causes of economic inequality. In an analysis of the effects of intensive Anglo-American liberal policies in comparison to continental European liberalism, where unions have remained strong, they concluded "The U.S. economic and social model is associated with substantial levels of social exclusion, including high levels of income inequality, high relative and absolute poverty rates, poor and unequal educational outcomes, poor health outcomes, and high rates of crime and incarceration. At the same time, the available evidence provides little support for the view that U.S.-style labor market flexibility dramatically improves labor-market outcomes. Despite popular prejudices to the contrary, the U.S. economy consistently affords a lower level of economic mobility than all the continental European countries for which data is available."[63]
More recently, the International Monetary Fund has published studies which found that the decline of unionization in many advanced economies and the establishment of neoliberal economics have fueled rising income inequality.[64][65]
Information technology
The growth in importance of information technology has been credited with increasing income inequality.[66] Technology has been called "the main driver of the recent increases in inequality" by Erik Brynjolfsson, of MIT.[67] In arguing against this explanation, Jonathan Rothwell notes that if technological advancement is measured by high rates of invention, there is a negative correlation between it and inequality. Countries with high invention rates — "as measured by patent applications filed under the Patent Cooperation Treaty" — exhibit lower inequality than those with less. In one country, the United States, "salaries of engineers and software developers rarely reach" above $390,000/year (the lower limit for the top 1% earners).[68]
Globalization
Trade liberalization may shift economic inequality from a global to a domestic scale.[70] When rich countries trade with poor countries, the low-skilled workers in the rich countries may see reduced wages as a result of the competition, while low-skilled workers in the poor countries may see increased wages. Trade economist Paul Krugman estimates that trade liberalisation has had a measurable effect on the rising inequality in the United States. He attributes this trend to increased trade with poor countries and the fragmentation of the means of production, resulting in low skilled jobs becoming more tradeable.
LSE anthropologist Jason Hickel contends that globalization and "structural adjustment" set off the "race to the bottom", a significant driver of surging global inequality. Another driver Hickel mentions is the debt system which advanced the need for structural adjustment in the first place.[71]
Gender
In many countries, there is a gender pay gap in favor of males in the labor market. Several factors other than discrimination contribute to this gap. On average, women are more likely than men to consider factors other than pay when looking for work, and may be less willing to travel or relocate.[73][74] Thomas Sowell, in his book Knowledge and Decisions, claims that this difference is due to women not taking jobs due to marriage or pregnancy. A U.S. Census's report stated that in US once other factors are accounted for there is still a difference in earnings between women and men.[75] The income gap in other countries ranges from 53% in Botswana to -40% in Bahrain.[76]
Economic development
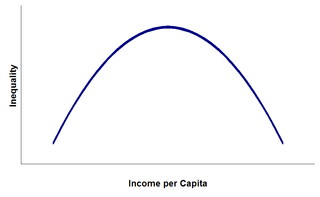
Economist Simon Kuznets argued that levels of economic inequality are in large part the result of stages of development. According to Kuznets, countries with low levels of development have relatively equal distributions of wealth. As a country develops, it acquires more capital, which leads to the owners of this capital having more wealth and income and introducing inequality. Eventually, through various possible redistribution mechanisms such as social welfare programs, more developed countries move back to lower levels of inequality.
Wealth concentration

Wealth concentration is the process by which, under certain conditions, newly created wealth concentrates in the possession of already-wealthy individuals or entities. Accordingly, those who already hold wealth have the means to invest in new sources of creating wealth or to otherwise leverage the accumulation of wealth, and thus they are the beneficiaries of the new wealth. Over time, wealth concentration can significantly contribute to the persistence of inequality within society. Thomas Piketty in his book Capital in the Twenty-First Century argues that the fundamental force for divergence is the usually greater return of capital (r) than economic growth (g), and that larger fortunes generate higher returns.[77]
Rent seeking
Economist Joseph Stiglitz argues that rather than explaining concentrations of wealth and income, market forces should serve as a brake on such concentration, which may better be explained by the non-market force known as "rent-seeking". While the market will bid up compensation for rare and desired skills to reward wealth creation, greater productivity, etc., it will also prevent successful entrepreneurs from earning excess profits by fostering competition to cut prices, profits and large compensation.[78] A better explainer of growing inequality, according to Stiglitz, is the use of political power generated by wealth by certain groups to shape government policies financially beneficial to them. This process, known to economists as rent-seeking, brings income not from creation of wealth but from "grabbing a larger share of the wealth that would otherwise have been produced without their effort"[79]
Finance industry
Jamie Galbraith argues that countries with larger financial sectors have greater inequality, and the link is not an accident.[80][81]
Global warming
A 2019 study published in PNAS found that global warming plays a role in increasing economic inequality between countries, boosting economic growth in developed countries while hampering such growth in developing nations of the Global South. The study says that 25% of gap between the developed world and the developing world can be attributed to global warming.[82]
Mitigating factors
Countries with a left-leaning legislature generally have lower levels of inequality.[83][84] Many factors constrain economic inequality – they may be divided into two classes: government sponsored, and market driven. The relative merits and effectiveness of each approach is a subject of debate.
Typical government initiatives to reduce economic inequality include:
- Public education: increasing the supply of skilled labor and reducing income inequality due to education differentials.[85]
- Progressive taxation: the rich are taxed proportionally more than the poor, reducing the amount of income inequality in society if the change in taxation does not cause changes in income.[86]
Market forces outside of government intervention that can reduce economic inequality include:
- propensity to spend: with rising wealth & income, a person may spend more. In an extreme example, if one person owned everything, they would immediately need to hire people to maintain their properties, thus reducing the wealth concentration.[87] On the other hand, high-income persons have higher propensity to save.[88] Robin Maialeh then shows that increasing economic wealth decreases propensity to spend and increases propensity to invest which consequently leads to even greater growth rate of already rich agents.[89]
Research shows that since 1300, the only periods with significant declines in wealth inequality in Europe were the Black Death and the two World Wars.[90] Historian Walter Scheidel posits that, since the stone age, only extreme violence, catastrophes and upheaval in the form of total war, Communist revolution, pestilence and state collapse have significantly reduced inequality.[91][92] He has stated that "only all-out thermonuclear war might fundamentally reset the existing distribution of resources" and that "peaceful policy reform may well prove unequal to the growing challenges ahead."[93][94]
Effects
A lot of research has been done about the effects of economic inequality on different aspects in society:
- Health: British researchers Richard G. Wilkinson and Kate Pickett have found higher rates of health and social problems (obesity, mental illness, homicides, teenage births, incarceration, child conflict, drug use) in countries and states with higher inequality.[95][96] Some studies link a surge in "deaths of despair", suicide, drug overdoses and alcohol related deaths, to widening income inequality.[97][98]
- Social goods: British researchers Richard G. Wilkinson and Kate Pickett have found lower rates of social goods (life expectancy by country, educational performance, trust among strangers, women's status, social mobility, even numbers of patents issued) in countries and states with higher inequality.[95][96]
- Social cohesion: Research has shown an inverse link between income inequality and social cohesion. In more equal societies, people are much more likely to trust each other, measures of social capital (the benefits of goodwill, fellowship, mutual sympathy and social connectedness among groups who make up a social units) suggest greater community involvement.
- Crime: In more equal societies homicide rates are consistently lower. A 2016 study finds that interregional inequality increases terrorism.[99]
- Welfare: Studies have found evidence that in societies where inequality is lower, population-wide satisfaction and happiness tend to be higher.[100][101]
- Debt: Income inequality has been the driving factor in the growing household debt,[102][103] as high earners bid up the price of real estate and middle income earners go deeper into debt trying to maintain what once was a middle class lifestyle.[104]
- Economic growth: A 2016 meta-analysis found that "the effect of inequality on growth is negative and more pronounced in less developed countries than in rich countries". The study also found that wealth inequality is more pernicious to growth than income inequality.[105]
- Civic participation: Higher income inequality led to less of all forms of social, cultural, and civic participation among the less wealthy.[106]
- Political instability: One study finds that income inequality increases political instability: "more unequal societies are more politically unstable".[107]
Perspectives
Fairness vs. equality
According to Christina Starmans et al. (Nature Hum. Beh., 2017), the research literature contains no evidence on people having an aversion on inequality. In all studies analyzed, the subjects preferred fair distributions to equal distributions, in both laboratory and real-world situations. In public, researchers may loosely speak of equality instead of fairness, when referring to studies where fairness happens to coincide with equality, but in many studies fairness is carefully separated from equality and the results are univocal. Already very young children seem to prefer fairness over equality.[108]
When people were asked, what would be the wealth of each quintile in their ideal society, they gave a 50-fold sum to the richest quintile than to the poorest quintile. The preference for inequality increases in adolescence, and so do the capabilities to favor fortune, effort and ability in the distribution.[108]
Preference for unequal distribution has been developed to the human race possibly because it allows for better co-operation and allows a person to work with a more productive person so that both parties benefit from the co-operation. Inequality is also said to be able to solve the problems of free-riders, cheaters and ill-behaving people, although this is heavily debated.[108] Researches demonstrate that people usually underestimate the level of actual inequality, which is also much higher than their desired level of inequality.[109]
In many societies, such as the USSR, the distribution led to protests from wealthier landowners.[110] In the current U.S., many feel that the distribution is unfair in being too unequal. In both cases, the cause is unfairness, not inequality, the researchers conclude.[108]
Socialist perspectives
Socialists attribute the vast disparities in wealth to the private ownership of the means of production by a class of owners, creating a situation where a small portion of the population lives off unearned property income by virtue of ownership titles in capital equipment, financial assets and corporate stock. By contrast, the vast majority of the population is dependent on income in the form of a wage or salary. In order to rectify this situation, socialists argue that the means of production should be socially owned so that income differentials would be reflective of individual contributions to the social product.[111]
Marxist socialists ultimately predict the emergence of a communist society based on the common ownership of the means of production, where each individual citizen would have free access to the articles of consumption (From each according to his ability, to each according to his need). According to Marxist philosophy, equality in the sense of free access is essential for freeing individuals from dependent relationships, thereby allowing them to transcend alienation.[112]
Meritocracy
Meritocracy favors an eventual society where an individual's success is a direct function of his merit, or contribution. Economic inequality would be a natural consequence of the wide range in individual skill, talent and effort in human population. David Landes stated that the progression of Western economic development that led to the Industrial Revolution was facilitated by men advancing through their own merit rather than because of family or political connections.[113]
Liberal perspectives
Most modern social liberals, including centrist or left-of-center political groups, believe that the capitalist economic system should be fundamentally preserved, but the status quo regarding the income gap must be reformed. Social liberals favor a capitalist system with active Keynesian macroeconomic policies and progressive taxation (to even out differences in income inequality). Research indicates that people who hold liberal beliefs tend to see greater income inequality as morally wrong.[114]
However, contemporary classical liberals and libertarians generally do not take a stance on wealth inequality, but believe in equality under the law regardless of whether it leads to unequal wealth distribution. In 1966 Ludwig von Mises, a prominent figure in the Austrian School of economic thought, explains:
The liberal champions of equality under the law were fully aware of the fact that men are born unequal and that it is precisely their inequality that generates social cooperation and civilization. Equality under the law was in their opinion not designed to correct the inexorable facts of the universe and to make natural inequality disappear. It was, on the contrary, the device to secure for the whole of mankind the maximum of benefits it can derive from it. Henceforth no man-made institutions should prevent a man from attaining that station in which he can best serve his fellow citizens.
Robert Nozick argued that government redistributes wealth by force (usually in the form of taxation), and that the ideal moral society would be one where all individuals are free from force. However, Nozick recognized that some modern economic inequalities were the result of forceful taking of property, and a certain amount of redistribution would be justified to compensate for this force but not because of the inequalities themselves. John Rawls argued in A Theory of Justice[115] that inequalities in the distribution of wealth are only justified when they improve society as a whole, including the poorest members. Rawls does not discuss the full implications of his theory of justice. Some see Rawls's argument as a justification for capitalism since even the poorest members of society theoretically benefit from increased innovations under capitalism; others believe only a strong welfare state can satisfy Rawls's theory of justice.
Classical liberal Milton Friedman believed that if government action is taken in pursuit of economic equality then political freedom would suffer. In a famous quote, he said:
A society that puts equality before freedom will get neither. A society that puts freedom before equality will get a high degree of both.
Economist Tyler Cowen has argued that though income inequality has increased within nations, globally it has fallen over the 20 years leading up to 2014. He argues that though income inequality may make individual nations worse off, overall, the world has improved as global inequality has been reduced.[116]
Social justice arguments
Patrick Diamond and Anthony Giddens (professors of Economics and Sociology, respectively) hold that 'pure meritocracy is incoherent because, without redistribution, one generation's successful individuals would become the next generation's embedded caste, hoarding the wealth they had accumulated'.
They also state that social justice requires redistribution of high incomes and large concentrations of wealth in a way that spreads it more widely, in order to "recognise the contribution made by all sections of the community to building the nation's wealth." (Patrick Diamond and Anthony Giddens, June 27, 2005, New Statesman)[117]
Pope Francis stated in his Evangelii gaudium, that "as long as the problems of the poor are not radically resolved by rejecting the absolute autonomy of markets and financial speculation and by attacking the structural causes of inequality, no solution will be found for the world's problems or, for that matter, to any problems."[118] He later declared that "inequality is the root of social evil."[119]
When income inequality is low, aggregate demand will be relatively high, because more people who want ordinary consumer goods and services will be able to afford them, while the labor force will not be as relatively monopolized by the wealthy.[120]
Effects on social welfare
In most western democracies, the desire to eliminate or reduce economic inequality is generally associated with the political left. One practical argument in favor of reduction is the idea that economic inequality reduces social cohesion and increases social unrest, thereby weakening the society. There is evidence that this is true (see inequity aversion) and it is intuitive, at least for small face-to-face groups of people. Alberto Alesina, Rafael Di Tella, and Robert MacCulloch find that inequality negatively affects happiness in Europe but not in the United States.[121]
It has also been argued that economic inequality invariably translates to political inequality, which further aggravates the problem. Even in cases where an increase in economic inequality makes nobody economically poorer, an increased inequality of resources is disadvantageous, as increased economic inequality can lead to a power shift due to an increased inequality in the ability to participate in democratic processes.[122]
Capabilities approach
The capabilities approach – sometimes called the human development approach – looks at income inequality and poverty as form of "capability deprivation".[123] Unlike neoliberalism, which "defines well-being as utility maximization", economic growth and income are considered a means to an end rather than the end itself.[124] Its goal is to "wid[en] people's choices and the level of their achieved well-being"[125] through increasing functionings (the things a person values doing), capabilities (the freedom to enjoy functionings) and agency (the ability to pursue valued goals).[126]
When a person's capabilities are lowered, they are in some way deprived of earning as much income as they would otherwise. An old, ill man cannot earn as much as a healthy young man; gender roles and customs may prevent a woman from receiving an education or working outside the home. There may be an epidemic that causes widespread panic, or there could be rampant violence in the area that prevents people from going to work for fear of their lives.[123] As a result, income inequality increases, and it becomes more difficult to reduce the gap without additional aid. To prevent such inequality, this approach believes it is important to have political freedom, economic facilities, social opportunities, transparency guarantees, and protective security to ensure that people aren't denied their functionings, capabilities, and agency and can thus work towards a better relevant income.
Policy responses intended to mitigate
—President Franklin Delano Roosevelt, 1933[127]
A 2011 OECD study makes a number of suggestions to its member countries, including:[7]
- Well-targeted income-support policies.
- Facilitation and encouragement of access to employment.
- Better job-related training and education for the low-skilled (on-the-job training) would help to boost their productivity potential and future earnings.
- Better access to formal education.
Progressive taxation reduces absolute income inequality when the higher rates on higher-income individuals are paid and not evaded, and transfer payments and social safety nets result in progressive government spending.[128][129][130] Wage ratio legislation has also been proposed as a means of reducing income inequality. The OECD asserts that public spending is vital in reducing the ever-expanding wealth gap.[131]
The economists Emmanuel Saez and Thomas Piketty recommend much higher top marginal tax rates on the wealthy, up to 50 percent, 70 percent or even 90 percent.[132] Ralph Nader, Jeffrey Sachs, the United Front Against Austerity, among others, call for a financial transactions tax (also known as the Robin Hood tax) to bolster the social safety net and the public sector.[133][134][135]
The Economist wrote in December 2013: "A minimum wage, providing it is not set too high, could thus boost pay with no ill effects on jobs....America's federal minimum wage, at 38% of median income, is one of the rich world's lowest. Some studies find no harm to employment from federal or state minimum wages, others see a small one, but none finds any serious damage."[136]
General limitations on and taxation of rent-seeking are popular across the political spectrum.[137]
Public policy responses addressing causes and effects of income inequality in the US include: progressive tax incidence adjustments, strengthening social safety net provisions such as Aid to Families with Dependent Children, welfare, the food stamp program, Social Security, Medicare, and Medicaid, organizing community interest groups, increasing and reforming higher education subsidies, increasing infrastructure spending, and placing limits on and taxing rent-seeking.[138]
A 2017 study in the Journal of Political Economy by Daron Acemoglu, James Robinson and Thierry Verdier argues that American "cutthroat" capitalism and inequality gives rise to technology and innovation that more "cuddly" forms of capitalism cannot.[139] As a result, "the diversity of institutions we observe among relatively advanced countries, ranging from greater inequality and risk-taking in the United States to the more egalitarian societies supported by a strong safety net in Scandinavia, rather than reflecting differences in fundamentals between the citizens of these societies, may emerge as a mutually self-reinforcing world equilibrium. If so, in this equilibrium, 'we cannot all be like the Scandinavians,' because Scandinavian capitalism depends in part on the knowledge spillovers created by the more cutthroat American capitalism."[139] A 2012 working paper by the same authors, making similar arguments, was challenged by Lane Kenworthy, who posited that, among other things, the Nordic countries are consistently ranked as some of the world's most innovative countries by the World Economic Forum's Global Competitiveness Index, with Sweden ranking as the most innovative nation, followed by Finland, for 2012–2013; the U.S. ranked sixth.[140]
See also
- Accumulation of capital
- Aporophobia
- Class conflict
- Criticism of capitalism
- Cycle of poverty
- Donor Class
- Economic migrant
- Equal opportunity
- Great Divergence, disproportionate economic advancement of Europe
- Human Development Index
- Income distribution
- Inequality for All
- International inequality
- List of countries by distribution of wealth
- List of countries by income equality
- List of countries by wealth per adult
- Occupy movement
- Paradise Papers
- Poverty reduction
- Rent-seeking
- Social inequality
- Tax haven
- Theories of poverty
- Wealth concentration
- Wealth distribution
References
- "Wealth Distribution and Income Inequality by Country 2018 | Global Finance Magazine".
- Human Development Reports. Inequality-adjusted Human Development Index (IHDI) Archived July 12, 2019, at the Wayback Machine. United Nations Development Programme. Retrieved: March 3, 2019.
- Neves, Pedro Cunha; Afonso, Óscar; Silva, Sandra Tavares (2016). "A Meta-Analytic Reassessment of the Effects of Inequality on Growth". World Development. 78: 386–400. doi:10.1016/j.worlddev.2015.10.038.
Summary - This paper develops a meta-analysis of the empirical literature that estimates the effect of inequality on growth. It covers studies published in scientific journals during 1994–2014 that examine the impact on growth of inequality in income, land, and human capital distribution. We find traces of publication bias in this literature, as authors and journals are more willing to report and publish statistically significant findings, and the results tend to follow a predictable time pattern over time according to which negative and positive effects are cyclically reported. After correcting for these two forms of publication bias, we conclude that the high degree of heterogeneity of the reported effect sizes is explained by study conditions, namely the structure of the data, the type of countries included in the sample, the inclusion of regional dummies, the concept of inequality and the definition of income. In particular, our meta-regression analysis suggests that: cross-section studies systematically report a stronger negative impact than panel data studies; the effect of inequality on growth is negative and more pronounced in less developed countries than in rich countries; the inclusion of regional dummies in the growth regression of the primary studies considerably weakens such effect; expenditure and gross income inequality tend to lead to different estimates of the effect size; land and human inequality are more pernicious to subsequent growth than income inequality is. We also find that the estimation technique, the quality of data on income distribution, and the specification of the growth regression do not significantly influence the estimation of the effect sizes. These results provide new insights into the nature of the inequality–growth relationship and offer important guidelines for policy makers.
- "The Globalization of Inequality". Princeton University Press. Retrieved August 19, 2017.
- Hunt, Michael (2004). The World Transformed: 1945 to the Present. Boston: Bedford/St. Martin's. pp. 442. ISBN 978-0312245832.
- Gurría, Angel (December 5, 2011). Press Release for Divided We Stand: Why Inequality Keeps Rising (Report). OECD. doi:10.1787/9789264119536-en. Retrieved December 16, 2011.
- Divided We Stand: Why Inequality Keeps Rising. OECD. 2011. doi:10.1787/9789264119536-en. ISBN 978-92-64-11953-6.
- "Stock quotes, financial tools, news and analysis – MSN Money". msn.com. Archived from the original on September 5, 2011. Retrieved July 24, 2010.
- "Growth of millionaires in India fastest in world ". Thaindian News. June 25, 2008.
- Rigged rules mean economic growth increasingly "winner takes all" for rich elites all over world. Oxfam. January 20, 2014.
- Neuman, Scott (January 20, 2014). Oxfam: World's Richest 1 Percent Control Half Of Global Wealth. NPR. Retrieved January 25, 2014.
- Stout, David (January 20, 2014). "One Stat to Destroy Your Faith in Humanity: The World's 85 Richest People Own as Much as the 3.5 Billion Poorest". Time. Retrieved January 21, 2014.
- Wearden, Graeme (January 20, 2014). "Oxfam: 85 richest people as wealthy as poorest half of the world". The Guardian. Retrieved January 21, 2014.
- Kristof, Nicholas (July 22, 2014). "An Idiot's Guide to Inequality". The New York Times. Retrieved July 22, 2014.
- Jim Puzzanghera (January 20, 2014). 85 richest people own as much as bottom half of population, report says. Los Angeles Times. Retrieved January 22, 2014.
- Cohen, Patricia (January 19, 2015). "Richest 1% Likely to Control Half of Global Wealth by 2016, Study Finds". The New York Times. Retrieved January 19, 2015.
- Larry Elliott and Ed Pilkington (January 19, 2015). New Oxfam report says half of global wealth held by the 1%. The Guardian. Retrieved January 19, 2015.
- Jill Treanor (October 13, 2014). Richest 1% of people own nearly half of global wealth, says report. The Guardian. Retrieved October 14, 2014.
- Jill Treanor (October 13, 2015). Half of world's wealth now in hands of 1% of population – report. The Guardian. Retrieved October 15, 2015.
- Richest 62 people as wealthy as half of world's population, says Oxfam. The Guardian, January 18, 2016.
- "Be careful with that viral statistic about the top 1% owning half the world's wealth". Vox. January 22, 2015. Retrieved January 18, 2016.
- Vara, Vauhini (January 28, 2015). "Critics of Oxfam's Poverty Statistics Are Missing the Point". The New Yorker. ISSN 0028-792X. Retrieved January 18, 2016.
- "Oxfam's Misleading Wealth Statistics". Fusion. Retrieved January 18, 2016.
- Elliott, Larry (January 15, 2017). "World's eight richest people have same wealth as poorest 50%". The Guardian. Retrieved January 16, 2017.
- Elliott, Larry (January 21, 2018). "Inequality gap widens as 42 people hold same wealth as 3.7bn poorest". The Guardian. Retrieved January 23, 2018.
- Picchi, Aimee (January 20, 2019). "A new billionaire is minted every 2 days as the poor lose wealth". CBS News. Retrieved January 21, 2019.
- Clifford, Catherine (January 19, 2020). "Global wealth inequality is 'founded on sexism,' says Oxfam International". CNBC. Retrieved January 26, 2020.
- "Trends in Family Wealth, 1989 to 2013". Congressional Budget Office. August 18, 2016.
- Kertscher, Tom; Borowski, Greg (March 10, 2011). "The Truth-O-Meter Says: True – Michael Moore says 400 Americans have more wealth than half of all Americans combined". PolitiFact. Retrieved August 11, 2013.
- Moore, Michael (March 6, 2011). "America Is Not Broke". Huffington Post. Retrieved August 11, 2013.
- Moore, Michael (March 7, 2011). "The Forbes 400 vs. Everybody Else". michaelmoore.com. Archived from the original on March 9, 2011. Retrieved August 11, 2013.
- Pepitone, Julianne (September 22, 2010). "Forbes 400: The super-rich get richer". CNN. Retrieved August 11, 2013.
- Bruenig, Matt (March 24, 2014). "You call this a meritocracy? How rich inheritance is poisoning the American economy". Salon. Retrieved August 24, 2014.
- "Inequality – Inherited wealth". The Economist. March 18, 2014. Retrieved August 24, 2014.
- Pizzigati, Sam (September 24, 2012). "The 'Self-Made' Hallucination of America's Rich". Institute for Policy Studies. Retrieved August 24, 2014.
- Neate, Rupert (November 8, 2017). "Bill Gates, Jeff Bezos and Warren Buffett are wealthier than poorest half of US". The Guardian. Retrieved November 9, 2017.
- Taylor, Matt (November 9, 2017). "The Paradise Papers Are Just a Glimpse at the Unreal Wealth Gap". Vice. Retrieved November 10, 2017.
- Neate, Rupert (October 26, 2017). "World's witnessing a new Gilded Age as billionaires' wealth swells to $6tn". The Guardian. Retrieved October 27, 2017.
- Neate, Rupert (October 26, 2018). "World's billionaires became 20% richer in 2017, report reveals". The Guardian. Retrieved November 5, 2018.
- Telford, Taylor (September 26, 2019). "Income inequality in America is the highest it's been since census started tracking it, data shows". The Washington Post. Retrieved September 30, 2019.
- Novotný, Josef (2007). "On the measurement of regional inequality: Does spatial dimension of income inequality matter?". The Annals of Regional Science. 41 (3): 563–80. doi:10.1007/s00168-007-0113-y.
- Mark Anderson (July 24, 2014). Jobs and social security needed as income inequality widens, UNDP warn. The Guardian. Retrieved July 24, 2014.
- Norton, Michael I.; Ariely, Dan (2011). "Building a Better America—One Wealth Quintile at a Time". Perspectives on Psychological Science. 6 (1): 9–12. doi:10.1177/1745691610393524. PMID 26162108.
- Hellebrandt; Mauro. "The Future of Worldwide Income Distribution". Cite journal requires
|journal=(help) - Improving job quality and reducing gender gaps are essential to tackling growing inequality. OECD, May 21, 2015.
- Era Dabla-Norris; Kalpana Kochhar; Nujin Suphaphiphat; Frantisek Ricka; Evridiki Tsounta (June 15, 2015). Causes and Consequences of Income Inequality : A Global Perspective. International Monetary Fund. Retrieved June 16, 2015.
- Dunsmuir, Lindsay (October 11, 2017). "IMF calls for fiscal policies that tackle rising inequality". Reuters. Retrieved October 30, 2017.
- Lawson, Max; Martin, Matthew (October 9, 2018). "The Commitment to Reducing Inequality Index 2018". Oxfam. Retrieved November 13, 2018.
- Anthony Shorrocks; Jim Davies; Rodrigo Lluberas (October 2018). "Global Wealth Report". Credit Suisse. Cite journal requires
|journal=(help) October 10, 2018 article: Global Wealth Report 2018: US and China in the lead. Report. Databook. Downloadable data sheets. See Table 3.1 (page 114) of databook for mean and median wealth by country. - "Country Comparison: Distribution of family income – Gini index". The World Factbook. CIA. Retrieved May 8, 2017.
- Piketty, Thomas (2014). Capital in the Twenty-First Century. Belknap Press. ISBN 067443000X p. 571
- Stiglitz, Joseph E. (June 4, 2012). The Price of Inequality: How Today's Divided Society Endangers Our Future (p. 34). Norton. Kindle Edition.
- Webster (4b): increasing in rate as the base increases (a progressive tax)
- American Heritage Archived February 9, 2009, at the Wayback Machine (6). Increasing in rate as the taxable amount increases.
- Britannica Concise Encyclopedia: Tax levied at a rate that increases as the quantity subject to taxation increases.
- Princeton University WordNet: (n) progressive tax (any tax in which the rate increases as the amount subject to taxation increases)
- Sommerfeld, Ray M., Silvia A. Madeo, Kenneth E. Anderson, Betty R. Jackson (1992), Concepts of Taxation, Dryden Press: Fort Worth, TX
- Alesina, Alberto; Dani Rodrick (May 1994). "Distributive Politics and Economic Growth" (PDF). Quarterly Journal of Economics. 109 (2): 465–90. doi:10.2307/2118470. JSTOR 2118470. Retrieved October 17, 2013.
- Hatch, Megan E.; Rigby, Elizabeth (2015). "Laboratories of (In)equality? Redistributive Policy and Income Inequality in the American States". Policy Studies Journal. 43 (2): 163–187. doi:10.1111/psj.12094.
- Shlomo Yitzhaki (1998). "More than a Dozen Alternative Ways of Spelling Gini" (PDF). Economic Inequality. 8: 13–30.
- Becker, Gary S.; Murphy, Kevin M. (May 2007). "The Upside of Income Inequality". The America. Archived from the original on January 2, 2014. Retrieved January 8, 2014.
- Bosworth, Barry; Burtless, Gary; Steuerle, C. Eugene (December 1999). Lifetime Earnings Patterns, the Distribution of Future Social Security Benefits, and the Impact of Pension Reform (PDF) (report no. CRR WP 1999-06). Chestnut Hill, Massachusetts: Center for Retirement Research at Boston College. p. 43. Retrieved October 1, 2012.
- Schmitt, John and Ben Zipperer. 2006. "Is the U.S. a Good Model for Reducing Social Exclusion in Europe?" CEPR
- Michael Hiltzik (March 25, 2015). IMF agrees: Decline of union power has increased income inequality. Los Angeles Times. Retrieved March 26, 2015.
- IMF: The last generation of economic policies may have been a complete failure. Business Insider. May 2016.
- Basu, Kaushik (January 6, 2016). "Is technology making inequality worse?". World Economic Forum. Retrieved November 17, 2017.
- Rotman, David (October 21, 2014). "Technology and Inequality". MIT Technology Review. Retrieved November 17, 2017.
- Rothwell, Jonathan (November 17, 2017). "Myths of the 1 Percent: What's Putting People at the Top". New York Times. Retrieved November 17, 2017.
- "Branko Milanovic-Global Income Inequality by the Numbers-In History and Now-February 2013" (PDF).
- "Economic Focus". The Economist. London: The Economist Group. April 19, 2008. p. 81.
- Hickel, Jason (2018). The Divide: A Brief Guide to Global Inequality and its Solutions. Windmill Books. pp. 175–176. ISBN 978-1786090034.
- OECD. OECD Employment Outlook 2008 – Statistical Annex Archived December 6, 2008, at the Wayback Machine. OECD, Paris, 2008, p. 358.
- "Are Women Earning More Than Men?". Forbes. May 12, 2006.
- Lukas, Carrie (April 3, 2007). "A Bargain At 77 Cents To a Dollar". The Washington Post. Retrieved May 3, 2010.
- Weinberg, Daniel H (May 2004). "Evidence From Census 2000 About Earnings by Detailed Occupation for Men and Women" (PDF). Retrieved February 21, 2017.
- "Jobs – Staffing – Workforce Solutions – Randstad USA". vedior.com.
- pp. 384 Table 12.2, U.S. university endowment size vs. real annual rate of return
- Stiglitz, Joseph E. (June 4, 2012). The Price of Inequality: How Today's Divided Society Endangers Our Future (pp. 30–1, 35–6). Norton. Kindle Edition.
- Stiglitz, Joseph E. (June 4, 2012). The Price of Inequality: How Today's Divided Society Endangers Our Future (p. 32). Norton. Kindle Edition.
- James K. Galbraith, Inequality and Instability: A Study of the World Economy Just before the Great Crisis (New York: Oxford University Press, 2012).
- Stiglitz, Joseph E. (June 4, 2012). The Price of Inequality: How Today's Divided Society Endangers Our Future, p. 334. Norton. Kindle Edition.
- Uchoa, Pablo (May 6, 2019). "How global warming has made the rich richer". BBC. Retrieved June 5, 2019.
- Bradley, David; Huber, Evelyne; Moller, Stephanie; Nielsen, François; Stephens, John D. (2011). "Distribution and Redistribution in Postindustrial Democracies" (PDF). World Politics. 55 (2): 193–228. doi:10.1353/wp.2003.0009. hdl:10419/160937.
- Huber, Evelyne; Nielsen, François; Pribble, Jenny; Stephens, John D. (2006). "Politics and Inequality in Latin America and the Caribbean". American Sociological Review. 71 (6): 943–63. doi:10.1177/000312240607100604. JSTOR 25472438.
- Keller, Katarina R.I. (2010). "How Can Education Policy Improve Income Distribution?: An Empirical Analysis of Education Stages and Measures on Income Inequality". The Journal of Developing Areas. 43 (2): 51–77. doi:10.1353/jda.0.0052. JSTOR 40376250.
- Clark, J. R.; Lawson, Robert A. (2008). "The Impact of Economic Growth, Tax Policy and Economic Freedom on Income Inequality". The Journal of Private Enterprise. SSRN 2566842.
- García-Peñalosa & Turnovsky 2007.
- Carroll, Christopher; Slacalek, Jiri; Kiichi, Tokuoka; White, Matthew (2017). "The distribution of wealth and the marginal propensity to consume". Quantitative Economics. 8 (3): 977–1020. doi:10.3982/QE694.
- Maialeh, Robin (2019). "Why Market Imperatives Invigorate Economic Inequality? Cobb-Douglas Utility Remodelled". Panoeconomicus. 66 (2): 145–163. doi:10.2298/PAN160220031M.
- Alfani, Guido (January 15, 2017). "The top rich in Europe in the long run of history (1300 to present day)". VoxEU.org. Retrieved January 16, 2017.
- Scheidel, Walter (February 23, 2017). "Inequality Has Historically Been Leveled Only By Terrible Violence And Upheaval". The Huffington Post. Retrieved March 30, 2017.
- Taylor, Matt (February 22, 2017). "One Recipe for a More Equal World: Mass Death". Vice. Retrieved April 7, 2017.
- Porter, Eduardo (December 6, 2016). "A Dilemma for Humanity: Stark Inequality or Total War". The New York Times. Retrieved March 30, 2017.
- Scheidel, Walter (2017). The Great Leveler: Violence and the History of Inequality from the Stone Age to the Twenty-First Century. Princeton: Princeton University Press. pp. 438 & 444. ISBN 978-0-691-16502-8.
- "The Spirit Level". equalitytrust.org.uk.
- Pickett, KE; Wilkinson, RG (March 2015). "Income inequality and health: a causal review". Social Science & Medicine. 128: 316–26. doi:10.1016/j.socscimed.2014.12.031. PMID 25577953.
- Woodward, Aylin (November 30, 2019). "Life expectancy in the US keeps going down, and a new study says America's worsening inequality could be to blame". Business Insider. Retrieved December 18, 2019.
- Coughlan, Sean; Brown, David (May 14, 2019). "Inequality driving 'deaths of despair'". BBC. Retrieved December 18, 2019.
- Ezcurra, Roberto; Palacios, David (2016). "Terrorism and spatial disparities: Does interregional inequality matter?". European Journal of Political Economy. 42: 60–74. doi:10.1016/j.ejpoleco.2016.01.004.
- "Happiness: Has Social Science A Clue?" Richard Layard Archived June 3, 2013, at the Wayback Machine 2003
- Blanchard and Oswald 2000, 2003
- "Conservative Inequality Denialism," by Timothy Noah The New Republic (October 25, 2012)
- The Way Forward Archived July 11, 2012, at Archive.today By Daniel Alpert, Westwood Capital; Robert Hockett, Professor of Law, Cornell University; and Nouriel Roubini, Professor of Economics, New York University, New America Foundation, October 10, 2011
- Plumer, Brad. "'Trickle-down consumption': How rising inequality can leave everyone worse off". 27 March 2013. Washington Post. Retrieved March 27, 2013.
- Pedro Cunha Neves, Óscar Afonso and Sandra Tavares Silva (2016). "A Meta-Analytic Reassessment of the Effects of Inequality on Growth". World Development. 78 (C): 386–400. doi:10.1016/j.worlddev.2015.10.038. Retrieved September 24, 2018.
- Bram Lancee and Hermanvande Werfhorst (2011) "Income Inequality and Participation: A Comparison of 24 European Countries" GINI Discussion Paper No. 6 (Amsterdam Centre for Inequality Studies)
- Alesina, Alberto; Perotti, Roberto (1996). "Income distribution, political instability, and investment". European Economic Review (Submitted manuscript). 40 (6): 1203–28. doi:10.1016/0014-2921(95)00030-5.
- Starmans, Christina; Sheskin, Mark; Bloom, Paul (2017). "Why people prefer unequal societies". Nature Human Behaviour. 1 (4): 0082. doi:10.1038/s41562-017-0082.
- Hauser, Oliver; Norton, Michael (2017). "(Mis)perceptions of inequality". Current Opinion in Psychology. 18 (18): 21–25. doi:10.1016/j.copsyc.2017.07.024. hdl:10871/33591. PMID 29221507.
- Editors of Encyclopedia Britannica. Kulak | Russian peasant class. Encyclopædia Britannica inc. 2016.
- Barbara Goodwin. Using Political Ideas. West Sussex, England, UK: John Wiley & Sons, Ltd., 2007. p. 107.
- Oldrich Kyn. "The Normative View of Marxian Theory on Income Distribution under Socialism". Archived from the original on March 14, 2015. Retrieved November 30, 2013.
- Landes, David. S. (1969). The Unbound Prometheus: Technological Change and Industrial Development in Western Europe from 1750 to the Present. Cambridge, New York: Press Syndicate of the University of Cambridge. ISBN 978-0-521-09418-4.
- O'Donnell, Michael, and Serena Chen. "Political Ideology, the Moralizing of Income Inequality, and Its Social Consequences." Available at SSRN 3253666 (2018).
- Rawls, John (2005). A Theory of Justice. Belknap Press of Harvard University Press. ISBN 978-0674017726.
- Cowen, Tyler (July 19, 2014). "Income Inequality Is Not Rising Globally. It's Falling". The New York Times. Retrieved July 26, 2014.
- "New Statesman – NS Essay – 'Accumulation of wealth is unjust where it arises not from hard work and risk-taking enterprise, but from brute luck factors such as returns from property. Inheritance is a form of brute-luck inequality'".
- John Nichols (December 2, 2013). Pope: "King Money" Culture is Hurting Young and Old. Moyers & Company. Retrieved December 8, 2013.
- Andrew Brown (April 28, 2014). Pope Francis condemns inequality, thus refusing to play the game. The Guardian. Retrieved May 27, 2014.
- The Economics of Welfare| Arthur Cecil Pigou
- "Inequality and Happiness: Are Europeans and Americans Different?". Archived from the original on February 1, 2014.
- The relation between economic inequality and political inequality is explained by Robert Alan Dahl in the chapters The Presence of a Market Economy (p. 63), The Distribution of Political Resources (p. 84) und Market Capitalism and Human Dispositions (p. 87) in On Political Equality, 2006, 120 pages, Yale University Press, ISBN 978-0-300-12687-7
- Amartya Sen (1999). "Poverty as Capability Deprivation". Development as Freedom. New York: Anchor Books.
- Fukuda-Parr 2003.
- , UNDP (1990) Human Deuelopment Report, Oxford University Press, New York
- Deneulin, Séverine; Alkire, Sabina (2009), "The human development and capability approach", in Deneulin, Séverine; Shahani, Lila (eds.), An introduction to the human development and capability approach freedom and agency, Sterling, Virginia Ottawa, Ontario: Earthscan International Development Research Centre, pp. 22–48, ISBN 9781844078066
- Tritch, Teresa (March 7, 2014). "F.D.R. Makes the Case for the Minimum Wage". The New York Times. Retrieved March 7, 2014.
- Moyes, P (1988). "A note on minimally progressive taxation and absolute income inequality". Social Choice and Welfare. 5: 227–34. doi:10.1007/BF00735763.
- Pickett and Wilkinson, The Spirit Level: Why More Equal Societies Almost Always Do Better, 2011
- Duncan, Denvil, Klara Sabirianova Peter (October 2012). "Unequal Inequalities: Do Progressive Taxes Reduce Income Inequality?" (PDF). Institute for the Study of Labor.
- Wealth Gap Widens In Rich Countries As Austerity Threatens To Worsen Inequality: OECD. The Huffington Post. Retrieved May 14, 2013
- Annie Lowrey (April 16, 2012). For Two Economists, the Buffett Rule Is Just a Start. The New York Times. Retrieved August 17, 2013.
- Nader, Ralph (April 18, 2013). Time for a Sales Tax on Wall Street Financial Transactions. The Huffington Post. Retrieved June 5, 2013.
- 1% Wall Street Sales Tax. UFAA.
- Erika Eichelberger (October 30, 2013). Economists to Congress: It's Time for a "Robin Hood Tax" on the Rich. Mother Jones. Retrieved November 15, 2013.
- "The logical floor". The Economist. December 14, 2013.
- Konczal, Mike (March 30, 2013). "How an anti-rentier agenda might bring liberals, conservatives together". The Washington Post. Retrieved April 6, 2013.
- Grusky, David B. (March–April 2013). "What to Do about Inequality". Boston Review. Archived from the original on April 20, 2013. Retrieved April 6, 2013.
- Acemoglu, Daron; Robinson, James A.; Verdier, Thierry (2017). "Asymmetric Growth and Institutions in an Interdependent World". Journal of Political Economy. 125 (5): 1245–1305. doi:10.1086/693038. hdl:1721.1/118645.
- Lane, Kenworthy (2015). Social Democratic America. USA: Oxford University Press. pp. 88–93. ISBN 978-0190230951.
Further reading
- Books
- Atkinson, Anthony B.; Bourguignon, François (2000). Handbook of income distribution. Amsterdam New York: Elvesier. ISBN 9780444816313.
- Atkinson, Anthony B. (2015). Inequality: What Can Be Done? Cambridge, Massachusetts: Harvard University Press. ISBN 0674504763
- Barro, Robert J.; Sala-i-Martin, Xavier (2003) [1995]. Economic growth (2nd ed.). Massachusetts: MIT Press. ISBN 9780262025539.
- Deneulin, Séverine; Shahani, Lila (2009). An introduction to the human development and capability approach freedom and agency. Sterling, Virginia Ottawa, Ontario: Earthscan International Development Research Centre. ISBN 9781844078066.
- Giddens, Anthony; Diamond, Patrick (2005). The new egalitarianism. Cambridge, UK Malden, Massachusetts: Polity. ISBN 9780745634319.
- Gilens, Martin (2012). Affluence and influence: Economic inequality and political power in America. Princeton, New Jersey New York: Princeton University Press Russell Sage Foundation. ISBN 9780691162423.
- Lambert, Peter J. (2001). The distribution and redistribution of income (3rd ed.). Manchester New York New York: Manchester University Press Palgrave. ISBN 9780719057328.
- Lynn, Richard; Vanhanen, Tatu (2002). IQ and the wealth of nations. Westport, Connecticut: Praeger. ISBN 9780275975104.
- Merino, Noël, ed. (2016). Income inequality. Opposing Viewpoints Series. Farmington Hills, Michigan: Greenhaven Press. ISBN 9780737775259.
- Page, Benjamin I.; Jacobs, Lawrence R. (2009). Class war?: What Americans really think about economic inequality. Chicago: University of Chicago Press. ISBN 9780226644554.
- Salverda, Wiemer; Nolan, Brian; Smeeding, Timothy M. (2009). The Oxford handbook of economic inequality. Oxford New York: Oxford University Press. ISBN 9780199231379.
- Schmidtz, David (2006). The elements of justice. Cambridge New York: Cambridge University Press. ISBN 9780521539364.
- Sen, Amartya (1999). Development as Freedom. New York: Oxford University Press. ISBN 9780198297581.
- Sen, Amartya; Foster, James E. (1997). On economic inequality. Radcliffe Lectures. Oxford New York: Clarendon Press Oxford University Press. ISBN 9780198281931.
- von Braun, Joachim; Diaz-Bonilla, Eugenio (2008). Globalization of food, and agriculture, and the poor. New Delhi Washington D.C: Oxford University Press International Food Policy Research Institute. ISBN 9780195695281.
- Wilkinson, Richard G. (2005). The impact of inequality: how to make sick societies healthier. London: Routledge. ISBN 9780415372695.
- Wilkinson, Richard G.; Pickett, Kate (2009). The spirit level: why more equal societies almost always do better. London: Allen Lane. ISBN 9781846140396.
- Articles
- Rivera Vicencio, Eduardo, "Inequality,Precariousness and Social Costs of Capitalism. In the Era of Corporate Governmentality" International Journal of Critical Accounting (IJCA), Vol 11, Nº1, pp. 40–70. https://www.researchgate.net/publication/337064312_InequalityPrecariousness_and_Social_Costs_of_Capitalism_In_the_Era_of_Corporate_Governmentality.
- Ahamed, Liaquat, "Widening Gyre: The rise and fall and rise of economic inequality", The New Yorker, September 2, 2019, pp. 26–29. "[T]here seems to [be] some sort of cap on inequality – a limit to the economic divisions a country can ultimately cope with." (p. 28.)
- Alesina, Alberto; Di Tella, Rafael; MacCulloch, Robert (2004). "Inequality and happiness: Are Europeans and Americans different?". Journal of Public Economics. 88 (9–10): 2009–42. CiteSeerX 10.1.1.203.664. doi:10.1016/j.jpubeco.2003.07.006.CS1 maint: ref=harv (link)
- Andersen, Robert (2012). "Support for Democracy in Cross-national Perspective: The Detrimental Effect of Economic Inequality" (PDF). Research in Social Stratification and Mobility. 30 (4): 389–402.
- Andersen, Robert; Fetner, Tina (2008). "Economic Inequality and Intolerance: Attitudes toward Homosexuality in 35 Democracies". American Journal of Political Science. 52 (4): 942–58. doi:10.1111/j.1540-5907.2008.00352.x. hdl:11375/22293. JSTOR 25193859.CS1 maint: ref=harv (link)
- Barro, Robert J. (1991). "Economic Growth in a Cross Section of Countries". The Quarterly Journal of Economics. 106 (2): 407–43. CiteSeerX 10.1.1.312.3126. doi:10.2307/2937943. JSTOR 2937943.CS1 maint: ref=harv (link)
- Barro, Robert J. (2000). "Inequality and Growth in a Panel of Countries". Journal of Economic Growth. 5 (1): 5–32. doi:10.1023/A:1009850119329.CS1 maint: ref=harv (link)
- Fukuda-Parr, Sakiko (2003). "The Human Development Paradigm: Operationalizing Sen's Ideas on Capabilities". Feminist Economics. 9 (2–3): 301–17. doi:10.1080/1354570022000077980.CS1 maint: ref=harv (link)
- Galor, Oded; Zeira, Joseph (1993). "Income Distribution and Macroeconomics". The Review of Economic Studies. 60 (1): 35–52. CiteSeerX 10.1.1.636.8225. doi:10.2307/2297811. JSTOR 2297811.CS1 maint: ref=harv (link)
- Hatch, Megan E.; Rigby, Elizabeth (2015). "Laboratories of (In)equality? Redistributive Policy and Income Inequality in the American States". Policy Studies Journal. 43 (2): 163–187. doi:10.1111/psj.12094.
- Kaldor, Nicholas (1955). "Alternative Theories of Distribution". The Review of Economic Studies. 23 (2): 83–100. doi:10.2307/2296292. JSTOR 2296292.CS1 maint: ref=harv (link)
- Kenworthy, Lane (2010). "Rising Inequality, Public Policy, and America's Poor". Challenge. 53 (6): 93–109. doi:10.2753/0577-5132530606. JSTOR 27896630.CS1 maint: ref=harv (link)
- Kenworthy, Lane (2017). "Why the Surge in Income Inequality?". Contemporary Sociology. 46 (1): 1–9. doi:10.1177/0094306116681789.CS1 maint: ref=harv (link)
- Komlos, John (2015). "In America, inequality begins in the womb". PBS, Making Sen$se. Retrieved July 29, 2018.
- Lagerlof, Nils-Petter (2005). "Sex, equality, and growth". Canadian Journal of Economics. 38 (3): 807–31. doi:10.1111/j.0008-4085.2005.00303.x.CS1 maint: ref=harv (link)
- Lazzarato, Maurizio (2009). "Neoliberalism in Action: Inequality, Insecurity and the Reconstitution of the Social". Theory, Culture & Society. 26 (6): 109–33. doi:10.1177/0263276409350283.CS1 maint: ref=harv (link)
- Maavak, Mathew (December 2012). "Class warfare, anarchy and the future society" (PDF). Journal of Futures Studies. 17 (2): 15–36. Archived from the original (PDF) on October 19, 2017. Retrieved March 18, 2013.CS1 maint: ref=harv (link)
- García-Peñalosa, Cecilia; Turnovsky, Stephen J. (2007). "Growth, Income Inequality, and Fiscal Policy: What Are the Relevant Trade-offs?". Journal of Money, Credit and Banking. 39 (2–3): 369–94. CiteSeerX 10.1.1.186.2754. doi:10.1111/j.0022-2879.2007.00029.x.CS1 maint: ref=harv (link)
- Pigou, Arthur C. (1932) [1920], "Part I, Chapter VIII: Economic welfare and changes in the distribution of the national dividend (section I.VIII.3)", in Pigou, Arthur C. (ed.), The economics of welfare (4th ed.), London: Macmillan and Co., OCLC 302702.CS1 maint: ref=harv (link)
- Sala-i-Martin, X. (2006). "The World Distribution of Income: Falling Poverty and ... Convergence, Period". The Quarterly Journal of Economics. 121 (2): 351–97. doi:10.1162/qjec.2006.121.2.351. JSTOR 25098796.CS1 maint: ref=harv (link)
- Seguino, Stephanie (2000). "Gender Inequality and Economic Growth: A Cross-Country Analysis". World Development. 28 (7): 1211–30. doi:10.1016/S0305-750X(00)00018-8.CS1 maint: ref=harv (link)
- Smeeding, Timothy M.; Thompson, Jeffrey P. (2011). "Recent Trends in Income Inequality". In Immervoll, Herwig; Peichl, Andreas; Tatsiramos, Konstantinos (eds.). Who Loses in the Downturn? Economic Crisis, Employment and Income Distribution. Research in Labor Economics. 32. pp. 1–50. doi:10.1108/S0147-9121(2011)0000032004. ISBN 978-0-85724-749-0.CS1 maint: ref=harv (link)
- Solow, Robert M. (1956). "A Contribution to the Theory of Economic Growth". The Quarterly Journal of Economics. 70 (1): 65–94. doi:10.2307/1884513. hdl:10338.dmlcz/143862. JSTOR 1884513.CS1 maint: ref=harv (link)
- Svizzero, Serge; Tisdell, Clem (2003). "Income inequality between skilled individuals" (PDF). International Journal of Social Economics. 30 (11): 1118–30. doi:10.1108/03068290310497486.CS1 maint: ref=harv (link)
Historical
- Crayen, Dorothee, and Joerg Baten. "New evidence and new methods to measure human capital inequality before and during the industrial revolution: France and the US in the seventeenth to nineteenth centuries." Economic History Review 63.2 (2010): 452-478. online
- Hickel, Jason (2018). The Divide: Global Inequality from Conquest to Free Markets. W. W. Norton & Company. ISBN 978-0393651362.
- Hoffman, Philip T., et al. "Real inequality in Europe since 1500." Journal of Economic History 62.2 (2002): 322-355. online
- Morrisson, Christian, and Wayne Snyder. "The income inequality of France in historical perspective." European Review of Economic History 4.1 (2000): 59-83. online
- Lindert, Peter H., and Steven Nafziger. "Russian inequality on the eve of revolution." Journal of Economic History 74.3 (2014): 767-798. online
- Nicolini, Esteban A.; Ramos Palencia, Fernando (2016). "Decomposing income inequality in a backward pre‐industrial economy: Old Castile (Spain) in the middle of the eighteenth century". Economic History Review. 69 (3): 747–772.
- Piketty, Thomas, and Emmanuel Saez. "The evolution of top incomes: a historical and international perspective." American economic review 96.2 (2006): 200-205. online
- Piketty, Thomas, and Emmanuel Saez. "Income inequality in the United States, 1913–1998." Quarterly journal of economics 118.1 (2003): 1-41. online
- Saito, Osamu. "Growth and inequality in the great and little divergence debate: a Japanese perspective." Economic History Review 68.2 (2015): 399-419. Covers 1600-1868 with comparison to Stuart England and Mughal India.
- Scheidel, Walter (2017). The Great Leveler: Violence and the History of Inequality from the Stone Age to the Twenty-First Century. Princeton: Princeton University Press. ISBN 978-0691165028.
- Stewart, Frances. "Changing perspectives on inequality and development." Studies in Comparative International Development 51.1 (2016): 60-80. covers 1801 to 2016.
- Sutch, Richard. "The One Percent across Two Centuries: A Replication of Thomas Piketty's Data on the Concentration of Wealth in the United States." Social Science History 41.4 (2017): 587-613. Strongly rejects all Piketty's estimates for US inequality before 1910 for both top 1% and top 10%. online
- Van Zanden, Jan Luiten. "Tracing the beginning of the Kuznets curve: Western Europe during the early modern period." Economic History Review 48.4 (1995): 643-664. covers 1400 to 1800.
- Wei, Yehua Dennis. "Geography of inequality in Asia." Geographical Review 107.2 (2017): 263-275. covers 1981 to 2015.
External links
| Wikiquote has quotations related to: Economic inequality |
| Wikimedia Commons has media related to Economic inequality. |
- Bowles, Samuel; Carlin, Wendy (2020). "Inequality as experienced difference: A reformulation of the Gini coefficient". Economics Letters. 186: 108789. doi:10.1016/j.econlet.2019.108789. ISSN 0165-1765.