Hérouville-Saint-Clair
Hérouville-Saint-Clair (French pronunciation: [eʁuvil sɛ̃ klɛʁ]) is a commune in the Calvados department in the Normandy region in northwestern France.
Hérouville-Saint-Clair | |
|---|---|
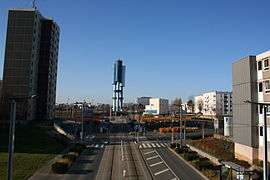 The Place de la Fontaine seen from the footbridge | |
 Coat of arms | |
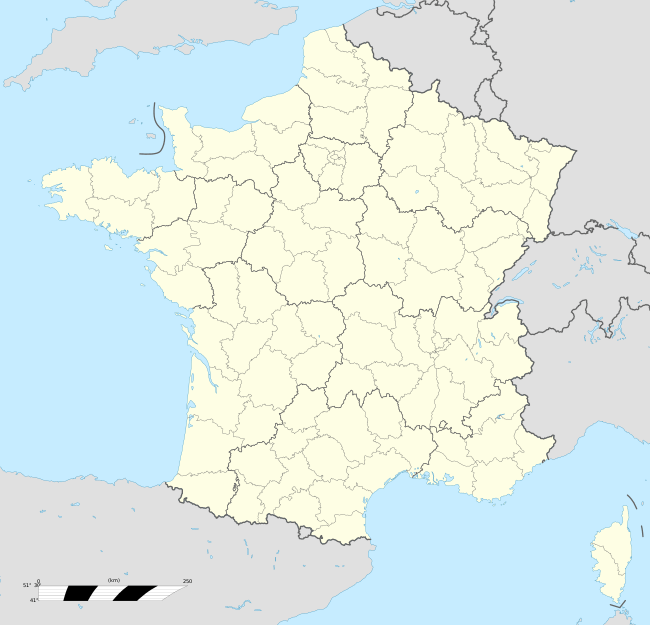
Location of Hérouville-Saint-Clair 
| |
 Hérouville-Saint-Clair 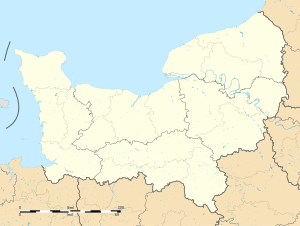 Hérouville-Saint-Clair | |
| Coordinates: 49°12′16″N 0°19′31″W | |
| Country | France |
| Region | Normandy |
| Department | Calvados |
| Arrondissement | Caen |
| Canton | Hérouville-Saint-Clair |
| Intercommunality | Caen la Mer |
| Government | |
| • Mayor (2014–2020) | Rodolphe Thomas |
| Area 1 | 10.64 km2 (4.11 sq mi) |
| Population (2017-01-01)[1] | 22,954 |
| • Density | 2,200/km2 (5,600/sq mi) |
| Time zone | UTC+01:00 (CET) |
| • Summer (DST) | UTC+02:00 (CEST) |
| INSEE/Postal code | 14327 /14200 |
| Elevation | 1–70 m (3.3–229.7 ft) (avg. 34.5 m or 113 ft) |
| 1 French Land Register data, which excludes lakes, ponds, glaciers > 1 km2 (0.386 sq mi or 247 acres) and river estuaries. | |
It is a suburb of the city of Caen, and lies adjacent to it in a northeasterly direction, along the west side of the Canal de Caen à la Mer. Its inhabitants are called Hérouvillais.
Just across the canal from Hérouville is a Renault Trucks manufacturing plant, which is situated between the canal and the Orne River. Just east of the river is the town of Colombelles.
Hérouville was the commune name until 1957.
Population
Hérouville-Saint-Clair experienced a very fast development which made it the most populous suburb of Caen. A simple village at the beginning of 1960, the commune passed from fewer than 2,000 inhabitants to almost 25,000 in less than fifteen years. This figure has varied little since 1975.
| Historical population | ||
|---|---|---|
| Year | Pop. | ±% |
| 1793 | 553 | — |
| 1800 | 465 | −15.9% |
| 1806 | 560 | +20.4% |
| 1821 | 621 | +10.9% |
| 1831 | 591 | −4.8% |
| 1836 | 636 | +7.6% |
| 1841 | 662 | +4.1% |
| 1846 | 618 | −6.6% |
| 1851 | 569 | −7.9% |
| 1856 | 630 | +10.7% |
| 1861 | 559 | −11.3% |
| 1866 | 591 | +5.7% |
| 1872 | 596 | +0.8% |
| 1876 | 595 | −0.2% |
| 1881 | 511 | −14.1% |
| 1886 | 560 | +9.6% |
| 1891 | 630 | +12.5% |
| 1896 | 608 | −3.5% |
| 1901 | 658 | +8.2% |
| 1906 | 629 | −4.4% |
| 1911 | 563 | −10.5% |
| 1921 | 672 | +19.4% |
| 1926 | 864 | +28.6% |
| 1931 | 939 | +8.7% |
| 1936 | 896 | −4.6% |
| 1946 | 957 | +6.8% |
| 1954 | 1,358 | +41.9% |
| 1962 | 1,784 | +31.4% |
| 1968 | 9,041 | +406.8% |
| 1975 | 23,712 | +162.3% |
| 1982 | 24,298 | +2.5% |
| 1990 | 24,795 | +2.0% |
| 1999 | 23,992 | −3.2% |
| 2008 | 22,267 | −7.2% |
| 2012 | 21,411 | −3.8% |
See also
References
- "Populations légales 2017". INSEE. Retrieved 6 January 2020.
External links
| Wikimedia Commons has media related to Hérouville-Saint-Clair. |
| Authority control |
|
|---|