Floods in Bihar
Bihar is India's most flood-prone state, with 76% population in the North Bihar living under the recurring threat of flood devastation.[1][2] Bihar makes up 16.5% of India's flood affected area and 22.1% of India's flood affected population.[3] About 73.06% of Bihar's geographical area, ie 68,800 square kilometres (26,600 sq mi) out of 94,160 square kilometres (36,360 sq mi), is flood affected. On an annual basis, they destroy thousands of human lives apart from livestock and assets worth millions.[4][2] In total, they have claimed 9,500 lives since the government started publishing figures in 1979.[5] The 2013 flood affected over 5.9 million people in 3,768 villages in 20 districts of the state.[6] 2017 flood affected 19 districts of North Bihar killing 514 people.[7][8][9][10][11][12][13] and affecting 1.71 crore people.[14][15][16][17]

| Year | Humans | Other animals |
|---|---|---|
| 2019 | ... | ... |
| 2017 | 521 | 192 |
| 2016 | 254 | 5383 |
| 2013 | 201 | 140 |
| 2008 | 434 | 845 |
| 2007 | 1287 | 126 |
| 2006 | 36 | 31 |
| 2005 | 58 | 4 |
| 2004 | 885 | 3272 |
| 2003 | 251 | 108 |
| 2002 | 489 | 1450 |
| 2001 | 231 | 565 |
| 2000 | 336 | 2568 |
| 1999 | 243 | 136 |
| 1998 | 381 | 187 |
| 1997 | 163 | 151 |
| 1996 | 222 | 171 |
| 1995 | 291 | 3742 |
| 1994 | 91 | 35 |
| 1993 | 105 | 420 |
| 1992 | 4 | |
| 1991 | 56 | 84 |
| 1990 | 36 | 76 |
| 1989 | 26 | |
| 1988 | 52 | 29 |
| 1987 | 1401 | 5302 |
| 1986 | 134 | 511 |
| 1985 | 83 | 20 |
| 1984 | 143 | 90 |
| 1983 | 36 | 21 |
| 1982 | 25 | 14 |
| 1981 | 18 | 11 |
| 1980 | 67 | 42 |
| 1979 | 14 | 50 |
History
Reason for flooding
Geographically Nepal is a mountainous region. When heavy rains occur in the mountains of central and eastern Nepal the water flows into the major drainages of Narayani, Bagmati, and Koshi rivers. As these rivers cross into India they flow into the plains and lowlands of Bihar and break their banks. To protect the Koshi River dam as well as the Koshi Barrage Pool's embankments, Indian engineers who are in charge of the dam in Nepal, further open the dam's gates which can cause flooding down river in Bihar. In 2008 during a high flow episode a breach in the East Koshi afflux embankment above the dam occurred and the Koshi river, known as the Sorrow of Bihar, picked up an old channel it had abandoned over 100 years previously near the border with Nepal and India. Approximately 2.7 million people were affected as the river broke its embankment at Kusaha in Nepal, submerging several districts of Nepal and India. 95% of the Koshi's total flowed through the new course.
Embankments
A recent fact finding report for the Kosi floods of 2008, prepared by a civil society organization by various experts like Dr. Sudhir Sharma, Dr. Dinesh Kumar Mishra, and Dr Gopal Krishna, highlighted that although India has built over 3000 km of embankments in Bihar over the last few decades, the flooding propensity has increased by 2.5 times during the same time period, not to mention that embankments failed during each major flooding event.
The Fact Finding Mission recently released a report titled Kosi Deluge: The Worst is Still to Come, in which it stressed that embankments straitjacket the river. In the case of the Kosi, it found that because of siltation the river bed was in fact several feet higher than the adjoining land. The high and low lands separated by embankments have created a situation where the low lands have become permanently waterlogged. Sixteen per cent of the land mass of north Bihar is subject to permanent waterlogging.
In 1954, when the Bihar flood policy was first introduced, Bihar had approximately 160 km of embankments. At this time, the flood-prone area in the state was estimated to be 2.5 million hectares. Upon the completion of the system of embankments, 3,465 km of embankments had been constructed and were administered by the Water Resources Department (WRD). However, the amount of flood-prone land increased to 6.89 million hectares by 2004.
Deforestation
Deforestation in the catchment area has led to increase in the silt content of the river flow. The total catchment area of the Kosi is 74,030 km2, excluding the catchment areas of its two important tributaries, the Kamla (7,232 km2) and the Bagmati (14,384 km2). These tributaries of the Kosi are important in themselves and are generally dealt with separately. Out of the total catchment of the Kosi, only 11,410 km2 are located in India and the rest (62,620 km2) lie in Nepal and Tibet. The river's catchment area at Triveni in Nepal is 59,550 km2. The average rainfall in the upper catchment of the Kosi is 1,589 mm while in the lower areas it is 1,323 mm. The average annual silt load of the river is 92,400 acre feet (114,000,000 m3).
Farakka Barrage
The period has caused serious interception in the dynamic equilibrium of the river hindering the natural oscillation of the river within its meandering belt. The meandering belt of Ganges in Malda and Murshidabad is 10 km wide. The water level of the Ganges rose about 8 m upstream of the Farakka barrage. The river which flowed in a South Easterly course between Rajmahal and Farakka during early decades of this century has now formed a mighty meander loop concentration to accommodate the additional discharge accumulated due to the barrage. Due to the obstruction caused by the Barrage each year nearly 640 million tonnes of silt is accumulated in the riverbed.[18] In the last three decades this has resulted in the accumulation of nearly 18.56 billion tonnes of silt.
Farakka barrage has led to following problems upstream of the barrage:
- Interception of the flow channel/ changed from straight to oblique
- Sedimentation (640 x106 metric tonnes/ year)
- Reduction of the cross-sectional area
- Declining slope of the long profile
- Widening of the river and increasing length
- Increase in flood frequency and magnitude
A Central Water Commission (CWC) report on Bihar floods in 2016 said that Farakka Barrage, even in the worst scenario can impact areas only up to about 42 km upstream, due to back water effect.[19] Patna is located about 400 km on the Ganga's upstream. The report blamed heavy banana plantation on the river bank between Patna and Bhagalpur as one of the reasons for the floods, based on the assessment of 100 years of floods in the Ganga. CWC report stated that the sedimentation in Ganga in Bihar is basically due to huge sediment load contributed from its northern tributaries- Ghaghra, Gandak and Kosi. The flood affected area in Bihar was 25 lakh hectares in 1954 when the length of all embankments in Bihar was 160 km, but the flood affected area increased to 72.95 lakh hectares in 2016 with the construction of 3731 km of embankments.[20]
Statistics
| Year | District | Blocks | Panchayat | Village | Human (in 100,000) | Animal (in 100,000) | Total Area (in 100,000 ha) | Cropped area (in 100,000 ha) | Crop Damaged (in 100,000 INR) | House Affected | Public Property Damaged (in 100,000 INR) |
|---|---|---|---|---|---|---|---|---|---|---|---|
| 2006 | 14 | 63 | 375 | 959 | 10.89 | 0.1 | 1.81 | 0.87 | 706.63 | 18,637 | 8,456.17 |
| 2005 | 12 | 81 | 562 | 1,464 | 21.04 | 5.35 | 4.6 | 1.35 | 1,164.50 | 5,538 | 305 |
| 2004 | 20 | 211 | 2,788 | 9,346 | 212.99 | 86.86 | 27 | 13.99 | 52,205.64 | 929,773 | 103,049.60 |
| 2003 | 24 | 172 | 1,496 | 5,077 | 76.02 | 11.96 | 15.08 | 6.1 | 6,266.13 | 45,262 | 1,035.16 |
| 2002 | 25 | 6 | 2,504 | 8,318 | 160.18 | 52.51 | 19.69 | 9.4 | 51,149.61 | 419,014 | 40,892.19 |
| 2001 | 22 | 194 | 1,992 | 6,405 | 90.91 | 11.7 | 11.95 | 6.5 | 26,721.79 | 222,074 | 18,353.78 |
| 2000 | 33 | 213 | 2,327 | 12,351 | 90.18 | 8.09 | 8.05 | 4.43 | 8,303.70 | 343,091 | 3,780.66 |
| 1999 | 24 | 150 | 1,604 | 5,057 | 65.66 | 13.58 | 8.45 | 3.04 | 24,203.88 | 91,813 | 5,409.99 |
| 1998 | 28 | 260 | 2,739 | 8,347 | 134.7 | 30.93 | 25.12 | 12.84 | 36,696.68 | 199,611 | 9,284.04 |
| 1997 | 26 | 169 | 1,902 | 7,043 | 69.65 | 10.11 | 14.71 | 6.55 | 5,737.66 | 174,379 | 2,038.09 |
| 1996 | 29 | 195 | 2,049 | 6,417 | 67.33 | 6.6 | 11.89 | 7.34 | 7,169.29 | 116,194 | 1,035.70 |
| 1995 | 26 | 177 | 1,901 | 8,233 | 66.29 | 8.15 | 9.26 | 4.24 | 19,514.32 | 297,765 | 2,183.57 |
| 1994 | 21 | 112 | 1,045 | 2,755 | 40.12 | 15.03 | 6.32 | 3.5 | 5,616.33 | 33,876 | 151.66 |
| 1993 | 18 | 124 | 1,263 | 3,422 | 53.52 | 6.68 | 15.64 | 11.35 | 13,950.17 | 219,826 | 3,040.86 |
| 1992 | 8 | 19 | 170 | 414 | 5.56 | 0.75 | 0.76 | 0.25 | 58.09 | 1,281 | 0.75 |
| 1991 | 24 | 137 | 1,336 | 4,096 | 48.23 | 5.13 | 9.8 | 4.05 | 2,361.03 | 27,324 | 139.93 |
| 1990 | 24 | 162 | 1,259 | 4,178 | 39.57 | 2.7 | 8.73 | 3.21 | 1,818.88 | 11,009 | 182.27 |
| 1989 | 16 | 74 | 652 | 1,821 | 18.79 | 0.35 | 4.71 | 1.65 | 704.88 | 7,746 | 83.7 |
| 1988 | 23 | 181 | 1,616 | 5,687 | 62.34 | 0.21 | 10.52 | 3.95 | 4,986.32 | 14,759 | 150.64 |
| 1987 | 30 | 382 | 6,112 | 24,518 | 286.62 | 33.25 | 47.5 | 25.7 | 67,881.00 | 1,704,999 | 680.86 |
| 1986 | 23 | 189 | 1,828 | 6,509 | 75.8 | XXXX | 19.18 | 7.97 | 10,513.51 | 136,774 | 3,201.99 |
| 1985 | 20 | 162 | 1,245 | 5,315 | 53.09 | XXXX | 7.94 | 4.38 | 3,129.52 | 103,279 | 204.64 |
| 1984 | 23 | 239 | 3,209 | 11,154 | 135 | XXXX | 30.5 | 15.87 | 18,543.85 | 310,405 | 2,717.72 |
| 1983 | 22 | 138 | 1,224 | 4,060 | 42.41 | XXXX | 18.13 | 5.78 | 2,629.25 | 38,679 | 258.14 |
| 1982 | 15 | 110 | 1,112 | 3,708 | 46.81 | 45.14 | 9.32 | 3.23 | 9,700.00 | 68,242 | 955.33 |
| 1981 | 21 | 201 | 2,138 | 7,367 | 69.47 | 74.83 | 12.61 | 7.71 | 7,213.19 | 75,776 | XXXX |
| 1980 | 21 | 193 | 1,869 | 7,010 | 74.45 | XXXX | 17.86 | 9.43 | 7,608.43 | 118,507 | XXXX |
| 1979 | 13 | 110 | XXXX | XXXX | 37.38 | XXXX | 8.06 | 2.74 | 1,901.52 | 27,816 | XXXX |
See also
Gallery
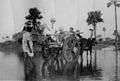
- A view of 2008 Bihar flood
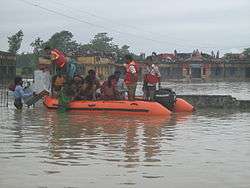 NDRF in 2008 Bihar flood
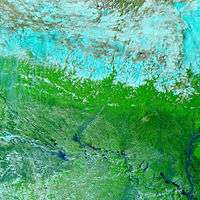 The Kosi before it flooded in August 2008
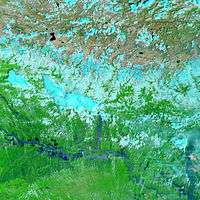 The Kosi during the August 2008 flood
References
- "District-level flood maps for Bihar ready".
- "FMIS". fmis.bih.nic.in.
- India Water Portal - Bihar Floods 2008 Archived 1 February 2009 at the Wayback Machine
- "Flood threat grows to 37 districts".
- "Bihar's scary new flood".
- "Bihar speeds up Flood Relief and Rescue Operations". Retrieved 5 September 2013.
- "Floods in state not man-made, says minister".
- "Flood Situation Improves In Bihar, Number Of Dead At 514".
- "Bihar Floods: Number Of Deaths Rises To 341".
- "Death toll in Bihar floods mounts to 304; situation grim in UP".
- "Flood situation worsens in Bihar, death toll rises to 253".
- "Bihar floods: 119 dead; bridge collapse caught on camera".
- "Bihar floods: Death toll rises to 202 in 18 districts; thundershowers likely to continue today".
- "Bihar Flood Deaths Rise To 440; Prime Minister Announces Rs. 500 Crore Relief".
- "Bihar floods' death toll touches 440, 1.71 crore people still affected".
- "Bihar floods cost 39 more lives, UP staggers".
- "Bihar floods: Death toll rises to 304, 1.38 crore people still battling deluge in 18 districts".
- "Over 50 years ago, Bengal's chief engineer predicted that the Farakka dam would flood Bihar".
- "Farakka not to blame for Bihar floods: CWC".
- "BJP leader Sushil Modi questions Nitish demand for decommissioning Farakka barrage".
- "Disaster Management". disastermgmt.bih.nic.in.
- "Loss of Public Property". disastermgmt.bih.nic.in.
External links
- CNN-IBN 30 Minutes documenetary on Bihar Floods 2008 by Marya Shakil - Part 1 Part 2 Part 3 Part 4
- Rapid Response providing relief support to the affected people since 2016.