Barrow and Furness (UK Parliament constituency)
Barrow and Furness, formerly known as Barrow-in-Furness, is a constituency[n 1] in Cumbria which has been represented in the House of Commons of the UK Parliament since 2019 by Simon Fell, a Conservative.[n 2]
| Barrow and Furness | |
|---|---|
| County constituency for the House of Commons | |
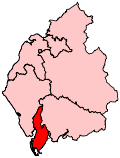 Boundary of Barrow and Furness in Cumbria for the 2007 general election | |
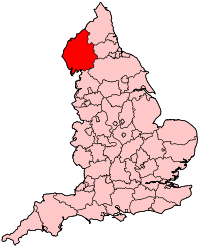 Location of Cumbria within England | |
| County | Cumbria (Lancashire until 1974) |
| Population | 88,826 (2011 census)[1] |
| Electorate | 69,148 (December 2010)[2] |
| Major settlements | Barrow-in-Furness, Ulverston, Dalton in Furness |
| Current constituency | |
| Created | 1885 |
| Member of Parliament | Simon Fell (Conservative) |
| Number of members | One |
| Created from | North Lancashire |
History and profile
The seat of Barrow and Furness was established by the Redistribution of Seats Act 1885 and covers the southwest part of Cumbria. The largest town in the constituency, Barrow-in-Furness, grew on the back of the shipbuilding industry and is now the site of the BAE Systems nuclear submarine and shipbuilding operation. This reliance on a single industry associated with controversial defence policies has proved politically volatile in a constituency the Labour Party would consider its own backyard. Labour Cabinet member Albert Booth represented Barrow from 1966 for many years but was defeated in 1983, in the aftermath of the Falklands War, by a Manchester lawyer, Cecil Franks of the Conservative Party, who retained the seat until 1992. Local media attributed this to widespread fears of job losses because the Labour Party was then signed up to doing away with all its nuclear capabilities including the submarines.[n 3]
As Labour revised its policies by favouring the retention of Britain's nuclear capability, and following massive job losses in the town's shipbuilding industry, Labour's fortunes revived in Barrow. John Hutton took the seat back for Labour in 1992 and retained it until the 2010 general election, when he was replaced by John Woodcock, also of Labour. In 2001, Hutton had the support of more than half of all those who voted. Other industries in the constituency currently include engineering and chemicals, and more than a quarter of all jobs are in manufacturing. The 2015 result gave the seat the 10th-smallest majority of Labour's 232 seats by percentage of majority.[3] In 2017, Woodcock's majority was reduced from 795 votes to 209 votes, the 16th smallest majority in the country.[4]
Boundaries
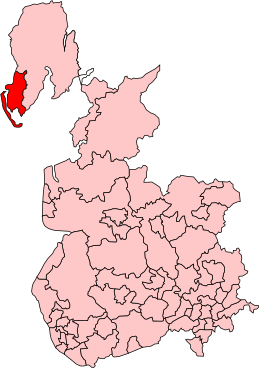
This constituency contains the southern half of the Furness peninsula, South Cumbria in the north-west of England.
1885–1918: The municipal borough of Barrow-in-Furness.[5]
1983–2010: The entire district of Barrow-in-Furness and the following wards from the District of South Lakeland: Low Furness, Pennington, Ulverston Central, Ulverston East, Ulverston North, Ulverston South and Ulverston West.
2010–: The entire district of Barrow-in-Furness and the following wards from the District of South Lakeland: Broughton, Crake Valley, Low Furness & Swarthmoor, Ulverston Central, Ulverston East, Ulverston North, Ulverston South, Ulverston Town and Ulverston West.
Members of Parliament
The current MP is Simon Fell, a Conservative Party MP. He replaced John Woodcock, an independent since 18 June 2018 and formerly a member of the Labour and Co-operative Parties, who stood down at the 2019 general election. In turn, he replaced John Hutton, a former lecturer. Hutton had taken the seat from Cecil Franks of the Conservative Party at the 1992 general election. He held the cabinet posts of Secretary of State for Defence, Secretary of State for Business, Enterprise and Regulatory Reform, Secretary of State for Work and Pensions and Chancellor of the Duchy of Lancaster.
| Election | Member[6] | Party | |
|---|---|---|---|
| 1885 | David Duncan | Liberal | |
| 1886 by-election | William Sproston Caine | ||
| 1886 | Liberal Unionist | ||
| 1890 by-election | James Duncan | Liberal | |
| 1892 | Sir Charles Cayzer, Bt | Conservative | |
| 1906 | Charles Duncan | Labour | |
| 1918 | Robert Chadwick | Conservative | |
| 1922 | Daniel Somerville | ||
| 1924 | John Bromley | Labour | |
| 1931 | Sir Jonah Walker-Smith | Conservative | |
| 1945 | Walter Monslow | Labour | |
| 1966 | Albert Booth | ||
| 1983 | Constituency renamed "Barrow and Furness" | ||
| 1983 | Cecil Franks | Conservative | |
| 1992 | John Hutton | Labour | |
| 2010 | John Woodcock | Labour Co-operative | |
| 2018 | Independent | ||
| 2019 | The Independents | ||
| 2019 | Simon Fell | Conservative | |
Elections
Elections in the 2010s
| Party | Candidate | Votes | % | ± | |
|---|---|---|---|---|---|
| Conservative | Simon Fell | 23,876 | 51.9 | ||
| Labour | Chris Altree | 18,087 | 39.3 | ||
| Liberal Democrats | Loraine Birchall | 2,025 | 4.4 | ||
| Brexit Party | Ged McGrath | 1,355 | 2.9 | N/A | |
| Green | Chris Loynes | 703 | 1.5 | ||
| Majority | 5,789 | 12.6 | N/A | ||
| Turnout | 46,155 | 65.8 | |||
| Conservative gain from Labour | Swing | ||||
| Party | Candidate | Votes | % | ± | |
|---|---|---|---|---|---|
| Labour Co-op | John Woodcock | 22,592 | 47.5 | ||
| Conservative | Simon Fell | 22,383 | 47.0 | ||
| Liberal Democrats | Loraine Birchall | 1,278 | 2.7 | 0.0 | |
| UKIP | Alan Piper | 962 | 2.0 | ||
| Green | Rob O'Hara | 375 | 0.8 | ||
| Majority | 209 | 0.5 | |||
| Turnout | 47,590 | 68.5 | |||
| Labour hold | Swing | ||||
| Party | Candidate | Votes | % | ± | |
|---|---|---|---|---|---|
| Labour Co-op | John Woodcock | 18,320 | 42.3 | −5.8 | |
| Conservative | Simon Fell | 17,525 | 40.5 | +4.2 | |
| UKIP | Nigel Cecil | 5,070 | 11.7 | +9.8 | |
| Liberal Democrats | Clive Peaple | 1,169 | 2.7 | −7.3 | |
| Green | Rob O'Hara | 1,061 | 2.5 | +1.3 | |
| Independent | Ian Jackson | 130 | 0.3 | N/A | |
| Majority | 795 | 1.8 | −10.0 | ||
| Turnout | 43,275 | 63.3 | −0.4 | ||
| Labour hold | Swing | −5.0 | |||
| Party | Candidate | Votes | % | ± | |
|---|---|---|---|---|---|
| Labour Co-op | John Woodcock | 21,226 | 48.1 | +2.9 | |
| Conservative | John Gough | 16,018 | 36.3 | +3.7 | |
| Liberal Democrats | Barry Rabone | 4,424 | 10.0 | −7.9 | |
| UKIP | John Smith | 841 | 1.9 | −0.2 | |
| BNP | Mike Ashburner | 840 | 1.9 | N/A | |
| Green | Chris Loynes | 530 | 1.2 | N/A | |
| Independent | Brian Greaves | 245 | 0.6 | N/A | |
| Majority | 5,208 | 11.8 | |||
| Turnout | 44,124 | 63.7 | +4.8 | ||
| Labour hold | Swing | −0.4 | |||
Elections in the 2000s
| Party | Candidate | Votes | % | ± | |
|---|---|---|---|---|---|
| Labour | John Hutton | 17,360 | 47.6 | −8.1 | |
| Conservative | William Dorman | 11,323 | 31.0 | +0.7 | |
| Liberal Democrats | Barry Rabone | 6,130 | 16.8 | +4.6 | |
| UKIP | Alan Beach | 758 | 2.1 | +0.3 | |
| Build Duddon and Morecambe Bridges | Timothey Bell | 409 | 1.1 | +1.1 | |
| Veritas | Brian Greaves | 306 | 0.8 | +0.8 | |
| Independent | Helene Young | 207 | 0.6 | +0.6 | |
| Majority | 6,037 | 16.6 | -8.8 | ||
| Turnout | 36,493 | 59.0 | −1.3 | ||
| Labour hold | Swing | −4.4 | |||
| Party | Candidate | Votes | % | ± | |
|---|---|---|---|---|---|
| Labour | John Hutton | 21,724 | 55.7 | −1.6 | |
| Conservative | James Airey | 11,835 | 30.3 | +3.1 | |
| Liberal Democrats | Barry Rabone | 4,750 | 12.2 | +3.3 | |
| UKIP | John Smith | 711 | 1.8 | N/A | |
| Majority | 9,889 | 25.4 | -4.7 | ||
| Turnout | 39,020 | 60.3 | −11.7 | ||
| Labour hold | Swing | −2.4 | |||
Elections in the 1990s
| Party | Candidate | Votes | % | ± | |
|---|---|---|---|---|---|
| Labour | John Hutton | 27,630 | 57.3 | +9.6 | |
| Conservative | Richard Hunt | 13,133 | 27.2 | −14.1 | |
| Liberal Democrats | Anne A. Metcalfe | 4,264 | 8.8 | −2.1 | |
| Independent | Jim Hamezeian | 1,995 | 4.1 | N/A | |
| Referendum | David Y. Mitchell | 1,208 | 2.5 | N/A | |
| Majority | 14,497 | 30.1 | |||
| Turnout | 48,230 | 72.0 | −10.1 | ||
| Labour hold | Swing | +11.9 | |||
| Party | Candidate | Votes | % | ± | |
|---|---|---|---|---|---|
| Labour | John Hutton | 26,568 | 47.7 | +8.5 | |
| Conservative | Cecil Franks | 22,990 | 41.3 | −5.1 | |
| Liberal Democrats | Clive J. Crane | 6,089 | 10.9 | −3.3 | |
| Majority | 3,578 | 6.4 | −0.7 | ||
| Turnout | 55,647 | 82.0 | +3.0 | ||
| Labour gain from Conservative | Swing | +6.8 | |||
Elections in the 1980s
| Party | Candidate | Votes | % | ± | |
|---|---|---|---|---|---|
| Conservative | Cecil Franks | 25,431 | 46.5 | +2.9 | |
| Labour | Peter Phizacklea | 21,504 | 39.3 | +4.6 | |
| SDP | Richard Phelps | 7,799 | 14.3 | −7.4 | |
| Majority | 3,927 | 7.2 | |||
| Turnout | 54,731 | 79.0 | +3.8 | ||
| Conservative hold | Swing | −0.9 | |||
| Party | Candidate | Votes | % | ± | |
|---|---|---|---|---|---|
| Conservative | Cecil Franks | 22,284 | 43.6 | ||
| Labour | Albert Booth | 17,707 | 34.7 | ||
| SDP | D. Cottier | 11,079 | 21.7 | ||
| Majority | 4,577 | 9.0 | |||
| Turnout | 51,070 | 75.2 | |||
| Conservative gain from Labour | Swing | ||||
Elections in the 1970s
| Party | Candidate | Votes | % | ± | |
|---|---|---|---|---|---|
| Labour | Albert Booth | 22,687 | 53.24 | ||
| Conservative | Patrick Thompson | 14,946 | 35.07 | ||
| Liberal | G. Thompson | 4,983 | 11.69 | ||
| Majority | 7,741 | 18.16 | |||
| Turnout | 78.26 | ||||
| Labour hold | Swing | ||||
| Party | Candidate | Votes | % | ± | |
|---|---|---|---|---|---|
| Labour | Albert Booth | 21,607 | 51.41 | ||
| Conservative | Richard Cecil | 14,253 | 33.91 | ||
| Liberal | M.A. Benjamin | 5,788 | 13.77 | ||
| Independent | V. Moore | 384 | 0.91 | ||
| Majority | 7,354 | 17.50 | |||
| Turnout | 77.06 | ||||
| Labour hold | Swing | ||||
| Party | Candidate | Votes | % | ± | |
|---|---|---|---|---|---|
| Labour | Albert Booth | 19,925 | 46.11 | ||
| Conservative | D.G.P. Bloomer | 14,818 | 34.29 | ||
| Liberal | M. Benjamin | 8,470 | 19.60 | ||
| Majority | 5,107 | 11.82 | |||
| Turnout | 79.97 | ||||
| Labour hold | Swing | ||||
| Party | Candidate | Votes | % | ± | |
|---|---|---|---|---|---|
| Labour | Albert Booth | 22,400 | 56.09 | ||
| Conservative | Hal Miller | 17,536 | 43.91 | ||
| Majority | 4,864 | 12.18 | |||
| Turnout | 73.69 | ||||
| Labour hold | Swing | ||||
Elections in the 1960s
| Party | Candidate | Votes | % | ± | |
|---|---|---|---|---|---|
| Labour | Albert Booth | 23,485 | 60.31 | ||
| Conservative | Richard W. Rollins | 15,453 | 39.69 | ||
| Majority | 8,032 | 20.63 | |||
| Turnout | 76.78 | ||||
| Labour hold | Swing | ||||
| Party | Candidate | Votes | % | ± | |
|---|---|---|---|---|---|
| Labour | Walter Monslow | 22,197 | 55.13 | ||
| Conservative | Peter Davies | 18,068 | 44.87 | ||
| Majority | 4,129 | 10.25 | |||
| Turnout | 78.03 | ||||
| Labour hold | Swing | ||||
Elections in the 1950s
| Party | Candidate | Votes | % | ± | |
|---|---|---|---|---|---|
| Labour | Walter Monslow | 23,194 | 54.68 | ||
| Conservative | Malcolm Metcalf | 19,220 | 45.32 | ||
| Majority | 3,974 | 9.37 | |||
| Turnout | 81.72 | ||||
| Labour hold | Swing | ||||
| Party | Candidate | Votes | % | ± | |
|---|---|---|---|---|---|
| Labour | Walter Monslow | 22,792 | 53.22 | ||
| Conservative | Edward du Cann | 20,033 | 46.78 | ||
| Majority | 2,759 | 6.44 | |||
| Turnout | 80.69 | ||||
| Labour hold | Swing | ||||
| Party | Candidate | Votes | % | ± | |
|---|---|---|---|---|---|
| Labour | Walter Monslow | 26,709 | 56.91 | ||
| Conservative | Kenneth F. Lawton | 20,225 | 43.09 | ||
| Majority | 6,484 | 13.82 | |||
| Turnout | 86.18 | ||||
| Labour hold | Swing | ||||
| Party | Candidate | Votes | % | |
|---|---|---|---|---|
| Labour | Walter Monslow | 26,342 | 56.27 | |
| Conservative | Wilfrid Sugden | 16,793 | 35.87 | |
| Liberal | Herbert Alexander Anderson Jardine | 3,678 | 7.86 | |
| Majority | 9,549 | 20.40 | ||
| Turnout | 87.83 | |||
| Labour hold | ||||
Elections 1918-1945
Elections in the 1910s
| Party | Candidate | Votes | % | ± | |
|---|---|---|---|---|---|
| Unionist | Robert Burton-Chadwick | 12,608 | 50.6 | +3.5 | |
| Labour | Charles Duncan | 12,309 | 49.4 | −3.5 | |
| Majority | 299 | 1.2 | N/A | ||
| Turnout | 24,917 | 66.1 | −20.7 | ||
| Unionist gain from Labour | Swing | +3.5 | |||
Elections in the 1920s
| Party | Candidate | Votes | % | ± | |
|---|---|---|---|---|---|
| Unionist | Daniel Somerville | 16,478 | 53.1 | +2.5 | |
| Labour | John Bromley | 14,551 | 46.9 | −2.5 | |
| Majority | 1,927 | 6.2 | +5.0 | ||
| Turnout | 87.1 | +21.0 | |||
| Unionist hold | Swing | +2.5 | |||
| Party | Candidate | Votes | % | ± | |
|---|---|---|---|---|---|
| Unionist | Daniel Somerville | 13,996 | 47.5 | −5.6 | |
| Labour | John Bromley | 13,576 | 46.0 | −0.9 | |
| Liberal | William Hood Wandless | 1,931 | 6.5 | n/a | |
| Majority | 420 | 1.5 | −4.7 | ||
| Turnout | 86.3 | −0.8 | |||
| Unionist hold | Swing | −2.3 | |||
| Party | Candidate | Votes | % | ± | |
|---|---|---|---|---|---|
| Labour | John Bromley | 15,512 | 51.2 | +5.2 | |
| Unionist | Daniel Somerville | 14,802 | 48.8 | +1.3 | |
| Majority | 710 | 2.4 | 3.9 | ||
| Turnout | 89.9 | +3.6 | |||
| Labour gain from Unionist | Swing | +1.9 | |||
| Party | Candidate | Votes | % | ± | |
|---|---|---|---|---|---|
| Labour | John Bromley | 19,798 | 56.0 | +4.8 | |
| Unionist | Kenneth McDonald Cameron | 15,551 | 44.0 | −4.8 | |
| Majority | 4,247 | 12.0 | +9.6 | ||
| Turnout | 35,349 | 86.8 | −3.1 | ||
| Labour hold | Swing | +4.8 | |||
Elections in the 1930s
| Party | Candidate | Votes | % | ± | |
|---|---|---|---|---|---|
| Conservative | Jonah Walker-Smith | 20,794 | 56.8 | +12.8 | |
| Labour | David Adams | 15,835 | 43.2 | −12.8 | |
| Majority | 4,959 | 13.4 | N/A | ||
| Turnout | 36,629 | 88.9 | +2.1 | ||
| Conservative gain from Labour | Swing | +12.8 | |||
| Party | Candidate | Votes | % | ± | |
|---|---|---|---|---|---|
| Conservative | Jonah Walker-Smith | 18,136 | 50.3 | −6.5 | |
| Labour | Percy Barstow | 17,919 | 49.7 | +6.5 | |
| Majority | 217 | 0.6 | −13.0 | ||
| Turnout | 85.4 | −3.5 | |||
| Conservative hold | Swing | −6.5 | |||
General Election 1939/40
Another General Election was required to take place before the end of 1940. The political parties had been making preparations for an election to take place and by the Autumn of 1939, the following candidates had been selected;
- Conservative: Jonah Walker-Smith
- Labour: Ronald McKinnon Wood[24]
Elections in the 1940s
| Party | Candidate | Votes | % | ± | |
|---|---|---|---|---|---|
| Labour | Walter Monslow | 25,939 | 65.5 | +15.8 | |
| Conservative | Jonah Walker-Smith | 13,648 | 34.5 | −15.8 | |
| Majority | 12,291 | 31.0 | N/A | ||
| Turnout | 39,587 | 79.7 | −5.7 | ||
| Labour gain from Conservative | Swing | +15.8 | |||
Elections 1885-1915
Elections in the 1880s
| Party | Candidate | Votes | % | ± | |
|---|---|---|---|---|---|
| Liberal | David Duncan | 2,958 | 53.1 | N/A | |
| Conservative | Henry Schneider | 2,612 | 46.9 | N/A | |
| Majority | 346 | 6.2 | N/A | ||
| Turnout | 5,570 | 91.9 | N/A | ||
| Registered electors | 6,063 | ||||
| Liberal win (new seat) | |||||
The election was declared void on petition, causing a by-election.
| Party | Candidate | Votes | % | ± | |
|---|---|---|---|---|---|
| Liberal | William Sproston Caine | 3,109 | 58.7 | +5.6 | |
| Conservative | Gainsford Bruce | 2,174 | 41.0 | −5.9 | |
| Independent Liberal | W H M Edmunds | 15 | 0.3 | N/A | |
| Majority | 935 | 17.7 | +11.5 | ||
| Turnout | 5,298 | 87.4 | −4.5 | ||
| Registered electors | 6,063 | ||||
| Liberal hold | Swing | +5.8 | |||

| Party | Candidate | Votes | % | ± | |
|---|---|---|---|---|---|
| Liberal Unionist | William Sproston Caine | 3,212 | 63.1 | +16.2 | |
| Liberal | John Ainsworth | 1,882 | 36.9 | −16.2 | |
| Majority | 1,330 | 26.2 | N/A | ||
| Turnout | 5,094 | 84.0 | −7.9 | ||
| Registered electors | 6,063 | ||||
| Liberal Unionist gain from Liberal | Swing | +16.2 | |||
Elections in the 1890s
| Party | Candidate | Votes | % | ± | |
|---|---|---|---|---|---|
| Liberal | James Duncan | 1,944 | 38.2 | +1.3 | |
| Conservative | Herbert Henry Wainwright | 1,862 | 36.6 | −26.5 | |
| Independent Liberal | William Sproston Caine | 1,280 | 25.2 | N/A | |
| Majority | 82 | 1.6 | N/A | ||
| Turnout | 5,086 | 84.3 | +0.3 | ||
| Registered electors | 6,034 | ||||
| Liberal gain from Liberal Unionist | Swing | +13.9 | |||
| Party | Candidate | Votes | % | ± | |
|---|---|---|---|---|---|
| Conservative | Charles Cayzer | 3,312 | 53.4 | −9.7 | |
| Liberal | James Duncan | 2,890 | 46.6 | +9.7 | |
| Majority | 422 | 6.8 | −19.4 | ||
| Turnout | 6,202 | 89.1 | +5.1 | ||
| Registered electors | 6,958 | ||||
| Conservative hold | Swing | −9.7 | |||

| Party | Candidate | Votes | % | ± | |
|---|---|---|---|---|---|
| Conservative | Charles Cayzer | 3,192 | 53.6 | +0.2 | |
| Liberal | Womesh Chunder Bonnerjee | 2,355 | 39.5 | −7.1 | |
| Ind. Labour Party | Pete Curran | 414 | 6.9 | N/A | |
| Majority | 837 | 14.1 | +7.3 | ||
| Turnout | 5,961 | 89.4 | +0.3 | ||
| Registered electors | 6,665 | ||||
| Conservative hold | Swing | +3.7 | |||
Elections in the 1900s
| Party | Candidate | Votes | % | ± | |
|---|---|---|---|---|---|
| Conservative | Charles Cayzer | Unopposed | |||
| Conservative hold | |||||
| Party | Candidate | Votes | % | ± | |
|---|---|---|---|---|---|
| Labour Repr. Cmte. | Charles Duncan | 5,167 | 60.3 | N/A | |
| Conservative | Charles Cayzer | 3,395 | 39.7 | N/A | |
| Majority | 1,772 | 20.6 | N/A | ||
| Turnout | 8,562 | 90.8 | N/A | ||
| Registered electors | 9,426 | ||||
| Labour Repr. Cmte. gain from Conservative | Swing | N/A | |||
Elections in the 1910s
| Party | Candidate | Votes | % | ± | |
|---|---|---|---|---|---|
| Labour | Charles Duncan | 5,304 | 55.2 | −5.1 | |
| Conservative | Francis Meynell | 4,298 | 44.8 | +5.1 | |
| Majority | 1,006 | 10.4 | −10.2 | ||
| Turnout | 9,602 | 91.6 | +0.8 | ||
| Registered electors | 10,478 | ||||
| Labour hold | Swing | −5.1 | |||
| Party | Candidate | Votes | % | ± | |
|---|---|---|---|---|---|
| Labour | Charles Duncan | 4,810 | 52.9 | −2.3 | |
| Conservative | Francis Meynell | 4,290 | 47.1 | +2.3 | |
| Majority | 520 | 5.8 | −4.6 | ||
| Turnout | 9,100 | 86.8 | −4.8 | ||
| Registered electors | 10,478 | ||||
| Labour hold | Swing | −2.3 | |||
General Election 1914/15:
Another General Election was required to take place before the end of 1915. The political parties had been making preparations for an election to take place and by the July 1914, the following candidates had been selected;
- Labour: Charles Duncan
- Unionist: Francis Meynell[30]
Notes and references
- Notes
- A county constituency (for the purposes of election expenses and type of returning officer)
- As with all constituencies, the constituency elects one Member of Parliament (MP) by the first past the post system of election at least every five years.
- See Labour Party and Campaign for Nuclear Disarmament
- References
- "Usual Resident Population, 2011". Neighbourhood Statistics. Office for National Statistics. Retrieved 27 January 2015.
- "Electorate Figures - Boundary Commission for England". 2011 Electorate Figures. Boundary Commission for England. 4 March 2011. Archived from the original on 6 November 2010. Retrieved 13 March 2011.
- List of Labour MPs elected in 2015 by % majority UK Political.info. Retrieved 2017-01-29
- "Marginal Seats". tutor2u. Retrieved 1 March 2019.
- "Chap. 23. Redistribution of Seats Act, 1885". The Public General Acts of the United Kingdom passed in the forty-eighth and forty-ninth years of the reign of Queen Victoria. London: Eyre and Spottiswoode. 1885. pp. 111–198.
- Leigh Rayment's Historical List of MPs – Constituencies beginning with "B" (part 1)
- "Barrow & Furness Parliamentary constituency". BBC News. BBC. Retrieved 25 November 2019.
- Council, Barrow Borough (12 December 2019). "Turnout was 65.79% with 46,155 votes cast. Counting continues #GE2019". @BarrowCouncil. Retrieved 13 December 2019.
- "Statement of Persons Nominated". Barrow Borough Council. Retrieved 14 May 2017.
- "Barrow & Furness parliamentary constituency". BBC News.
- "Election Data 2015". Electoral Calculus. Archived from the original on 17 October 2015. Retrieved 17 October 2015.
- "Barrow & Furness". BBC News. Retrieved 11 May 2015.
- "Election Data 2010". Electoral Calculus. Archived from the original on 26 July 2013. Retrieved 17 October 2015.
- "Barrow & Furness". BBC News. Archived from the original on 9 May 2010. Retrieved 8 May 2010.
- "Election Data 2005". Electoral Calculus. Archived from the original on 15 October 2011. Retrieved 18 October 2015.
- "Election Data 2001". Electoral Calculus. Archived from the original on 15 October 2011. Retrieved 18 October 2015.
- "Election Data 1997". Electoral Calculus. Archived from the original on 15 October 2011. Retrieved 18 October 2015.
- "Election Data 1992". Electoral Calculus. Archived from the original on 15 October 2011. Retrieved 18 October 2015.
- "Politics Resources". Election 1992. Politics Resources. 9 April 1992. Archived from the original on 24 July 2011. Retrieved 6 December 2010.
- "Election Data 1987". Electoral Calculus. Archived from the original on 15 October 2011. Retrieved 18 October 2015.
- "Election Data 1983". Electoral Calculus. Archived from the original on 15 October 2011. Retrieved 18 October 2015.
- http://tools.assembla.com/svn/grodt/uk/thc/files/marked_up/1959_marked_up.txt
- British Parliamentary Election Results 1918-1949, FWS Craig
- Report of the Annual Conference of the Labour Party, 1939
- British Parliamentary Election Results 1885-1918, FWS Craig
- The Liberal Year Book, 1907
- Debrett's House of Commons & Judicial Bench, 1886
- Debrett's House of Commons & Judicial Bench, 1901
- Debrett's House of Commons & Judicial Bench, 1916
- Manchester Courier and Lancashire General Advertiser 15 Jan 1914