Heywood and Middleton (UK Parliament constituency)
Heywood and Middleton is a constituency[n 1] in Greater Manchester represented in the House of Commons of the UK Parliament since 2019 by Chris Clarkson of the Conservative Party.[n 2]
| Heywood and Middleton | |
|---|---|
| County constituency for the House of Commons | |
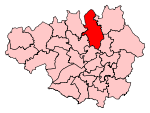 Boundary of Heywood and Middleton in Greater Manchester | |
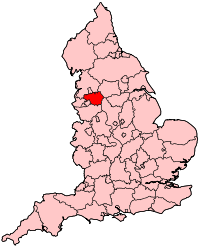 Location of Greater Manchester within England | |
| County | Greater Manchester |
| Electorate | 79,636 (December 2010)[1] |
| Major settlements | Heywood and Middleton |
| Current constituency | |
| Created | 1983 |
| Member of Parliament | Chris Clarkson (Conservative Party) |
| Number of members | One |
| Created from | Heywood and Royton; Middleton and Prestwich |
Boundaries
1983–1997: The Borough of Rochdale wards of Heywood North, Heywood South, Heywood West, Middleton Central, Middleton East, Middleton North, Middleton South, and Middleton West.
1997–2010: The Borough of Rochdale wards of Castleton, Heywood North, Heywood South, Heywood West, Middleton Central, Middleton East, Middleton North, Middleton South, Middleton West, and Norden and Bamford.
2010–present: The Borough of Rochdale wards of Bamford, Castleton, East Middleton, Hopwood Hall, Norden, North Heywood, North Middleton, South Middleton, West Heywood, and West Middleton.
The constituency is one of two covering the Metropolitan Borough of Rochdale, covering the west of the borough — it includes the towns of Heywood and Middleton, some of the western fringes of Rochdale itself (such as Castleton, and parts of Norden and Bamford) and some of the rural green buffer area to the north. Norden and Bamford are strong Conservative areas, but all other wards are mostly favourable to Labour.
History
The constituency was created in 1983 from parts of the former seats of Heywood and Royton and Middleton and Prestwich and had been held by the Labour Party since then until the 2019 Election.
From 1983 until his retirement in 1997, the MP was Jim Callaghan, not to be confused with a former Prime Minister with the same name.
Members of Parliament
| Election | Member[2] | Party | |
|---|---|---|---|
| 1983 | Jim Callaghan | Labour | |
| 1997 | Jim Dobbin | Labour Co-op | |
| 2014 by-election | Liz McInnes | Labour | |
| 2019 | Chris Clarkson | Conservative | |
Elections
Elections in the 2010s
| Party | Candidate | Votes | % | ± | |
|---|---|---|---|---|---|
| Conservative | Chris Clarkson | 20,453 | 43.1 | ||
| Labour | Liz McInnes | 19,790 | 41.7 | ||
| Brexit Party | Colin Lambert | 3,952 | 8.3 | ||
| Liberal Democrats | Anthony Smith | 2,073 | 4.4 | ||
| Green | Nigel Ainsworth-Barnes | 1,220 | 2.6 | ||
| Majority | 663 | 1.4 | N/A | ||
| Turnout | 47,488 | 59.2 | |||
| Conservative gain from Labour | Swing | ||||
| Party | Candidate | Votes | % | ± | |
|---|---|---|---|---|---|
| Labour | Liz McInnes | 26,578 | 53.3 | ||
| Conservative | Chris Clarkson | 18,961 | 38.0 | ||
| UKIP | Lee Seville | 3,239 | 6.5 | ||
| Liberal Democrats | Bill Winlow | 1,087 | 2.2 | ||
| Majority | 7,617 | 15.3 | |||
| Turnout | 49,865 | 62.4 | |||
| Labour hold | Swing | ||||
| Party | Candidate | Votes | % | ± | |
|---|---|---|---|---|---|
| Labour | Liz McInnes | 20,926 | 43.1 | +3.0 | |
| UKIP | John Bickley | 15,627 | 32.2 | +29.6 | |
| Conservative | Iain Gartside | 9,268 | 19.1 | −8.1 | |
| Liberal Democrats | Anthony Smith | 1,607 | 3.3 | −19.4 | |
| Green | Abi Jackson | 1,110 | 2.3 | +2.3 | |
| Majority | 5,299 | 10.9 | -2.0 | ||
| Turnout | 48,538 | 60.7 | +3.2 | ||
| Labour hold | Swing | -16.3 | |||
| Party | Candidate | Votes | % | ± | |
|---|---|---|---|---|---|
| Labour | Liz McInnes | 11,633 | 40.9 | +0.8 | |
| UKIP | John Bickley | 11,016 | 38.7 | +36.1 | |
| Conservative | Iain Gartside[5] | 3,496 | 12.3 | −14.9 | |
| Liberal Democrats | Anthony Smith[6] | 1,457 | 5.1 | −17.6 | |
| Green | Abi Jackson[7] | 870 | 3.1 | +3.1 | |
| Majority | 617 | 2.2 | |||
| Turnout | 28,472 | 36.0 | |||
| Labour hold | Swing | −18.5 | |||
| Party | Candidate | Votes | % | ± | |
|---|---|---|---|---|---|
| Labour Co-op | Jim Dobbin | 18,499 | 40.1 | −8.2 | |
| Conservative | Mike Holly | 12,528 | 27.2 | +5.4 | |
| Liberal Democrats | Wera Hobhouse | 10,474 | 22.7 | +2.5 | |
| BNP | Peter Greenwood | 3,239 | 7.0 | +2.6 | |
| UKIP | Victoria Cecil | 1,215 | 2.6 | +0.7 | |
| Independent | Chrissy Lee | 170 | 0.4 | N/A | |
| Majority | 5,971 | 12.9 | −13.6 | ||
| Turnout | 46,125 | 57.5 | +3.7 | ||
| Labour Co-op hold | Swing | −6.8 | |||
Elections in the 2000s
| Party | Candidate | Votes | % | ± | |
|---|---|---|---|---|---|
| Labour Co-op | Jim Dobbin | 19,438 | 49.8 | −7.9 | |
| Conservative | Stephen Pathmarajah | 8,355 | 21.4 | −6.2 | |
| Liberal Democrats | Crea Lavin | 7,261 | 18.6 | +7.4 | |
| BNP | Gary Aronsson | 1,855 | 4.7 | N/A | |
| Liberal | Philip Burke | 1,377 | 3.5 | +0.9 | |
| UKIP | John Whittaker | 767 | 2.0 | N/A | |
| Majority | 11,083 | 28.4 | |||
| Turnout | 39,053 | 54.6 | +1.5 | ||
| Labour Co-op hold | Swing | −0.9 | |||
| Party | Candidate | Votes | % | ± | |
|---|---|---|---|---|---|
| Labour Co-op | Jim Dobbin | 22,377 | 57.7 | +0.0 | |
| Conservative | Marilyn Hopkins | 10,707 | 27.6 | +4.6 | |
| Liberal Democrats | Ian Greenhalgh | 4,329 | 11.2 | −4.5 | |
| Liberal | Philip Burke | 1,021 | 2.6 | +1.1 | |
| Christian Democrats | Christine West | 345 | 0.9 | N/A | |
| Majority | 11,670 | 30.1 | |||
| Turnout | 38,779 | 53.1 | −15.3 | ||
| Labour Co-op hold | Swing | −2.3 | |||
Elections in the 1990s
| Party | Candidate | Votes | % | ± | |
|---|---|---|---|---|---|
| Labour Co-op | Jim Dobbin | 29,179 | 57.7 | +11.2 | |
| Conservative | Sebastian Grigg | 11,637 | 23.0 | −8.6 | |
| Liberal Democrats | David Clayton | 7,908 | 15.6 | -4.3 | |
| Referendum | Christine West | 1,076 | 2.1 | N/A | |
| Liberal | Philip Burke | 750 | 1.5 | −0.3 | |
| Majority | 17,542 | 34.7 | +15.8 | ||
| Turnout | 50,550 | 68.4 | -6.5 | ||
| Labour Co-op win | |||||
| Party | Candidate | Votes | % | ± | |
|---|---|---|---|---|---|
| Labour | James Callaghan | 22,380 | 52.3 | +2.4 | |
| Conservative | Eric Ollerenshaw | 14,306 | 33.4 | −0.9 | |
| Liberal Democrats | Michael B. Taylor | 5,252 | 12.3 | −3.6 | |
| Liberal | Philip Burke | 757 | 1.8 | N/A | |
| Natural Law | Anne-Marie Scott | 134 | 0.3 | N/A | |
| Majority | 8,074 | 18.9 | +3.3 | ||
| Turnout | 42,829 | 74.9 | +1.1 | ||
| Labour hold | Swing | +1.6 | |||
Elections in the 1980s
| Party | Candidate | Votes | % | ± | |
|---|---|---|---|---|---|
| Labour | Jim Callaghan | 21,900 | 49.9 | +6.6 | |
| Conservative | Roy Walker | 15,052 | 34.3 | +0.3 | |
| SDP | Ian Greenhalgh | 6,953 | 15.8 | −6.3 | |
| Majority | 6,848 | 15.6 | |||
| Turnout | 43,905 | 73.8 | |||
| Labour hold | Swing | +3.2 | |||
| Party | Candidate | Votes | % | ± | |
|---|---|---|---|---|---|
| Labour | Jim Callaghan | 18,111 | 43.3 | N/A | |
| Conservative | Christine Hodgson | 14,137 | 33.8 | N/A | |
| SDP | Arthur Rumbelow | 9,262 | 22.1 | N/A | |
| BNP | Kenneth Henderson | 316 | 0.8 | N/A | |
| Majority | 3,974 | 9.5 | N/A | ||
| Turnout | 41,826 | 69.9 | N/A | ||
| Labour win (new seat) | |||||
See also
- List of Parliamentary constituencies in Greater Manchester
Notes and references
- Notes
- A county constituency (for the purposes of election expenses and type of returning officer)
- As with all constituencies, the constituency elects one Member of Parliament (MP) by the first past the post system of election at least every five years.
- References
- "Electorate Figures - Boundary Commission for England". 2011 Electorate Figures. Boundary Commission for England. 4 March 2011. Archived from the original on 6 November 2010. Retrieved 13 March 2011.
- Leigh Rayment's Historical List of MPs – Constituencies beginning with "H" (part 3)
- "Statement of persons nominated 2019" (PDF).
- "Heywood & Middleton". BBC News. Retrieved 11 May 2015.
- "Iain Gartside Chosen as By-Election Candidate". Heywood, Middleton & Rochdale Conservatives.
- "Lib Dems select Anthony Smith for Heywood and Middleton contest". www.rochdaleonline.co.uk.
- "Rochdale Green Party Announce Abi Jackson as their candidate for the Heywood & Middleton by-election" (Press release). Green Party of England and Wales. 15 September 2014. Retrieved 15 September 2014.
- Council, Rochdale Metropolitan Borough (May 6, 2010). "Election results for Heywood & Middleton, 6 May 2010". democracy.rochdale.gov.uk.
- "UK General Election results April 1992". Richard Kimber's Political Science Resources. Politics Resources. 9 April 1992. Archived from the original on 11 August 2011. Retrieved 2010-12-06.
- http://www.psr.keele.ac.uk/area/uk/ge87/i11.htm
- http://www.psr.keele.ac.uk/area/uk/ge83/i11.htm